COVID-19 Cases and Deaths in India: Epidemiological Lessons and Projections from the Trend
←
→
Page content transcription
If your browser does not render page correctly, please read the page content below
Published online: 2020-05-12
THIEME
Commentary 1
COVID-19 Cases and Deaths in India: Epidemiological
Lessons and Projections from the Trend
Abhaya Indrayan1
1Department of Clinical Research, Max Healthcare, New Delhi, India Address for correspondence Abhaya Indrayan, PhD, FAMS, FRSS,
FASc, A-037 Telecom City, B-9/6 Sector 62, Noida 201309,
Uttar Pradesh, India (e-mail: a.indrayan@gmail.com).
Ann Natl Acad Med Sci (India)
Whereas most infections have origin from poor hygiene and not enough at present to make projections beyond the third
deprived nutrition and move upward from bottom rung of week of May.
social strata, pandemics mostly move top-down beginning An epidemic such as this should be tracked by occurrence
with the air travelers. Extensive infliction by COVID-19 has of new cases rather than with cumulative cases because
taken the world by surprise, but milder trend in India so far cumulative cases can never decline. The trend indicates that
has given us some lessons regarding its behavior. The first we are unlikely to reach to full blown Stage-III of the epidemic
case in India was reported on January 30, 2020 and it took so long as precautions such as physical distancing are strictly
45 days to reach to a mark of 100. Only 30 days later, the tally followed. There is evidence that effective implementation
reached to 10,000. This looks fast but is slow relative to most of ban on gathering of five or more with physical distanc-
European countries and the United States. The possible rea- ing and face masks, complete ban on all kinds of transport,
sons for this are many.1 We in India now have data of more malls, cinema halls, parties, etc., can play a decisive role in
than 40 days since the emergence of 100 cases to study the controlling the spread of infection.
trend and make educated projection for immediate future. After an erratic pattern, the relative increase in cases per
An empirical study of the trend indicates that the 5-day day was the highest, 22%, on 3rd April but it is showing a
multiplier was 2.5 in the beginning, but it gradually came declining trend since then in percentage terms and is now
down to 2.0 by the end of March due to measures such as nearly 6% on 24th April, primarily due to continued lock-
physical distancing. This reflects 20% reduction in transmis- down. If the opening up of lockdown after 3rd May does not
sion in a fortnight. This is the same as saying that the doubling disrupt the present trend and we are able to maintain reduced
time increased from less than 4 days to 5 days. The multiplier transmission by physical distancing, the rate of increase can
rose back to 2.5 by the end of the first week of April due to become less than 1% after the third week of May. The cumu-
Tablighi incident. The lockdown from 25th March and the lative number of active cases may be nearly 45,000 at that
quarantine strategy paid rich dividend and the multiplier time—others recovered or died. This is the number our med-
came down to 1.5 by the end of the third week of April—a ical care facilities should be ready to handle. It seems India
40% reduction in a fortnight. Thus, the lockdown provided is ready to handle that much load on medical care facilities.
an additional reduction of 20% in transmission over the pre- The present trend indicates that approximately 20% (nearly
vious strategy of physical distancing. A 5-day multiplier of 7,000 cases at its peak) of cases will need hospitalization.
1.5 corresponds to a doubling time of nearly 9 days. If the Cumulative cases will always rise and cannot decline but the
present favorable trend continues, we may see a 5-day mul- new cases after the third week of May could be less than the
tiplier reduced to 1.0 by the end of the third week of May recoveries and the active cases may decline that would reduce
that would stabilize the epidemic. Another incident such as the load on medical care facilities. We hope that the present
Tablighi can cause an unforeseen spike. If hot weather and trend continues, and the projections become a reality.
sunshine (ultraviolet rays) in May bring substantial relief and The trend further indicates that the number of patients
hampers virus transmission, as many expect,2 the stabiliza- reaching to the end point on any given day is nearly the same
tion can happen sooner. If these unusual occurrences do not as the new detections about 2 weeks earlier. The end point
happen, the present trend indicates the cumulative number is either recovery or death. The mortality is not less than 5%,
of cases may become 88,000 by the end of third week of May generally stated on the basis of the cumulative deaths and
(►Fig. 1) and the number of new cases may reach to a peak cumulative cases,3 as it ignores the fact that many of these
of nearly 3,000 during the second week of May. After this, the patients are still active and have not reached to their end point
occurrence of new cases may decline (►Fig. 2). The data are yet. The trend of death to recovery ratio indicates that the case
DOI https://doi.org/ ©2020 National Academy of
10.1055/s-0040-1712702 Medical Sciences (India)
ISSN 0379-038X.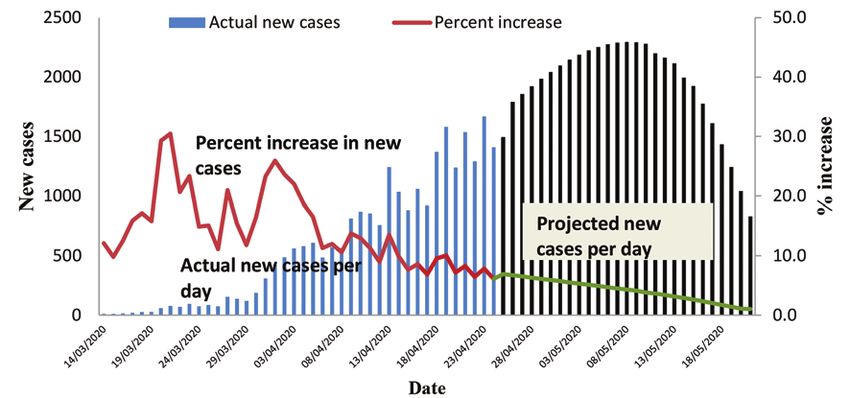
2 Commentary
Fig. 1 Cumulative cases and trend.
Fig. 2 New cases per day and the percentage increase over the cumulative on the previous day.
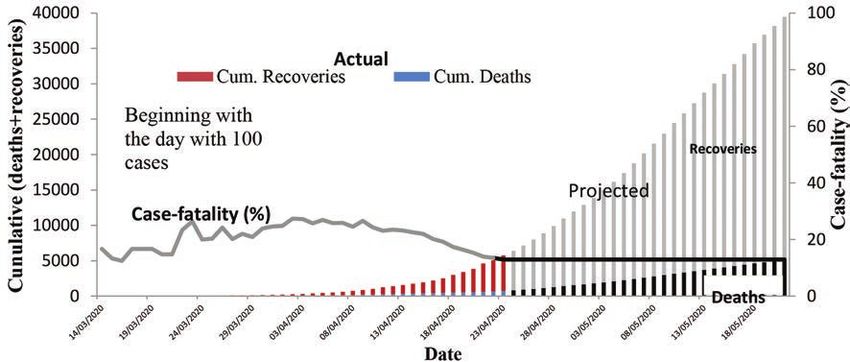
Fig. 3 Deaths and recoveries each day and the case fatality rate.
fatality, which at one point of time was 26%, has come down to could also be partially due to higher detection of cases at early
13% by the end of the third week of April as our medical care stages, some even those without symptoms, as testing intensi-
system learns to manage these cases (►Fig. 3). This decline fies. These mild cases generally recover due to early care. The
Annals of the National Academy of Medical Sciences (India)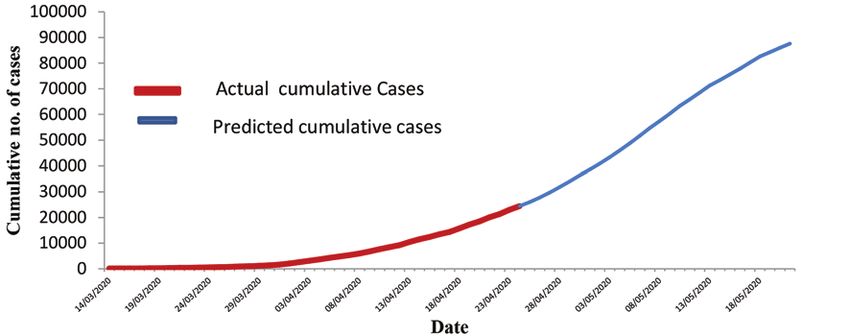
Commentary              3

case fatality may come down to 10%, even lower, in the course        vulnerable to death anyway. In addition, a substantial saving
of time due to accrued lessons and emergence of plasma or            of lives due to much less road and other injuries due to lock-
other therapies but the present mortality pattern does not           down, may be more than the loss of life due to this disease.
indicate a lower case fatality. Case fatality in China and some
                                                                       Conflict of Interest
other countries is lower perhaps due to their better medical
                                                                       None declared.
infrastructure and early detection.
   Despite no target treatment available for COVID-19, it is
strange that a large percentage of cases are recovering.4 This may   References
be attributed to our in-built immunity and perhaps because the
                                                                       1 Malani A, Gupta A, Abraham R. Why does India have so few
disease is mild in substantial percentage of cases. Low infections       Covid-19 cases and deaths? Quartz India. 16 April 2020.
and mild disease in many cases also may be due to our better             Available at: https://qz.com/india/1839018/why-does-india-
immunity levels. This point is not highlighted yet. Herd immu-           have-so-few-coronavirus-covid-19-cases-and-deaths/.
nity is long way off and short-term strategies to raise immunity         Accessed April 24, 2020
                                                                       2 Le Page M. Will the covid-19 coronavirus outbreak die out
level through diet and yoga may provide further help.
                                                                         in the summer’s heat? NewScientist. 12 Feb 2020. Available
   With such widespread concern over this disease, it is
                                                                         at: https://www.newscientist.com/article/2233249-will-the-
interesting to compare the loss of life due to COVID-19 with             covid-19-coronavirus-outbreak-die-out-in-the-summers-
the loss of life with injuries in India. With the crude death            heat/. Accessed April 25, 2020
rate of 7.2 per thousand population in India and an estimated          3 Jayakumar PB. Coronavirus death rate in India 3.3%, nearly
138 crore population in 2020,5 nearly 9.7 million deaths are             20 times less than global rateBusiness Today18 April 2020.
                                                                         Available at: https://www.businesstoday.in/latest/trends/coro-
likely to occur in India in the full year. According to the Global
                                                                         navirus-death-rate-india-3-3-percent-nearly-20-times-less-
Burden of Disease 2016 estimate for India, more than 10%                 than-global-rate/story/401389.html. Accessed April 19, 2020
of these deaths occurred due to injuries alone (of all kinds,          4 Covid 19 India. Available at: https://www.covid19india.org/.
including accidents, homicides, drowning, and animal bites).6            Accessed April 25, 2020
Thus, injuries are expected to take away nearly 1 million              5 India Population. Available at: http://www.populationu.com/
lives in 2020. Compare this with likely deaths by COVID-19.              india-population. Accessed April 25, 2020
                                                                       6 World Health Organization. Disease burden and mortality
Moreover, most deaths by injuries in India are of young peo-
                                                                         estimates: disease burden 2000–2016. Available at: https://
ple whereas the toll by COVID-19 is mostly of old people,                www.who.int/healthinfo/global_burden_disease/estimates/
particularly those who have comorbid conditions, and are                 en/index1.html. Accessed April 25, 2020

                                                                                           Annals of the National Academy of Medical Sciences (India)
You can also read