COVID-19 Delta Variant: Implications for employers and the return to work WHITE PAPER - CVS Health Payor Solutions

Page created by Lisa Horton
 
CONTINUE READING
COVID-19 Delta Variant: Implications for employers and the return to work WHITE PAPER - CVS Health Payor Solutions
WHITE PAPER

COVID-19 Delta Variant:
Implications for employers
and the return to work
COVID-19 Delta Variant: Implications for employers and the return to work WHITE PAPER - CVS Health Payor Solutions
The SARS-CoV-2 mutation that now plagues the world is the B.1.617.2 variant,
known as the Delta variant. The Delta variant has spread through many countries
and is now the dominant variety of COVID-19 virus in the United States.

As of July 20, the Delta variant represented 83 percent of new infections and
will likely be almost 100 percent in a week or two.* This prevalence is likely to
have implications for employers’ return-to-work plans this fall.

Epidemiology and clinical impact
The Delta variant is a model of viral mutation — different small changes in the molecular
structure1 that occur as a result of random variation and create selection pressure for more
“successful” models. It is 60 percent more transmissible than the previously dominant
Alpha variant, which in turn was at least 60 percent more transmissible than the original
SARS-CoV-2 strain.

The “load” of virus, or the number of copies a person harbors early in infection, is likely at least
1,000 times greater than the amount harbored by those originally infected with SARS-CoV-2.2
In very real terms, whereas the original SARS-CoV-2 strain carrier would infect 2.5 people, the
Delta carrier likely infects up to 6 people.3

Not only more transmissible, Delta is also considered more virulent, in that it causes worse
disease. A study in Scotland suggested that people infected with Delta were 85 percent more
likely to be hospitalized than people infected with Alpha.4 The mortality differences are not yet
known, but public officials are very worried.

                         The Delta variant is now the
                         dominant variety of COVID-19
                         virus in the United States.

                                                                      CVS Health: Perspectives on the COVID-19 Delta Variant | 2
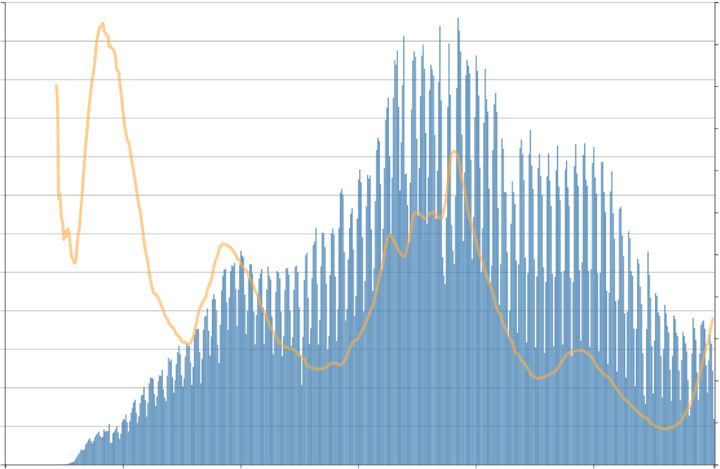
COVID-19 Delta Variant: Implications for employers and the return to work WHITE PAPER - CVS Health Payor Solutions
COVID-19 rates
of transmission

SARS-CoV-2   3

                              COVID-19
                              Delta variant

                              83            %
                              of new
1                2.5          infections
person           people

Delta variant
                              60%
                              more
                              transmissible

                              1,000x
                              viral load
1                up to 6
person           people

                           CVS Health: Perspectives on the COVID-19 Delta Variant | 3
The role of vaccinations
  The key solution to this phase of the pandemic is vaccination, preferably with
  messenger RNA (mRNA) vaccines.

  Many of those who are vaccinated will be able to completely resist the virus and, if vaccinated
  people do become infected, they are unlikely to get sick or be hospitalized.5 Moreover,
  vaccinated individuals will have much lower viral loads and represent less risk to others.

  Those who remain unvaccinated face substantial risk of
  severe illness and will contribute significantly to ongoing
  spread of the virus.

  There is also evidence that Delta may be more likely to evade some vaccine protection. While
  original reports6 suggested that protection from the Johnson & Johnson (J&J) vaccine was
  similar for Alpha and Delta, results emerged on July 20 that seem to suggest the J&J vaccine
  is less protective against Delta.7 The mRNA vaccines from Pfizer and Moderna appear to guard
  against hospitalization and severe infection, but more viral-positive, previously vaccinated
  people with mild disease are being reported — and they likely can infect others.

COVID-19 cases across
the United States have
significantly increased
since early June and
continue to trend upward,
especially in areas with
lower vaccination rates.

                                                                       CVS Health: Perspectives on the COVID-19 Delta Variant | 4
Viral density of the Delta variant
Perhaps the easiest way to look at this is to think about viral density.

Vaccination in any metropolitan area decreases viral density. Towns and cities with high
vaccination rates have much lower rates of virus present. But metropolitan areas that have low
rates of vaccination have much higher rates of virus present, and even vaccinated people are at
risk for infection.

Unvaccinated people are at risk for serious illness and death. Further, unvaccinated people who
have early infections with the Delta variant give off a dense fog of virus, compared to the wisps
of virus observed in March of 2020 with the original SARS-CoV-2 strain.

As a result, in a city with a low vaccination rate, a carrier of the
Delta variant who goes indoors to an office or a restaurant puts
everyone there at risk.

             Unvaccinated people                                                  By contrast, people
             who have early                                                       infected with the
             infections with the                                                  original SARS-CoV-2
             Delta variant give off                                               strain gave off wisps
             a dense fog of virus.                                                of virus.

                                                                      CVS Health: Perspectives on the COVID-19 Delta Variant | 5
Testing trends
   Our recent epidemiological analyses demonstrate this case. Figure 1 illustrates that rates of
   positive tests are rising dramatically. Despite the hopes shared by many in early summer that
   the pandemic would fade away, it is back — and unfortunately there is a chance that an even
   more infectious mutant could replace the Delta variant.

   Figure 1
   Total US incremental testing and case trends
                   2.4M                                                                                                   22

                   2.2M                                                                                                   20

                    2M                                                                                                    18
                   1.8M
                                                                                                                          16

                                                                                                                                 7-day Percent Positivity
                   1.6M
                                                                                                                          14
  Tests Reported

                   1.4M
                                                                                                                          12
                   1.2M
                                                                                                                          10
                     1M
                                                                                                                          8
                   800K
                                                                                                                          6
                   600K

                   400K                                                                                                   4

                   200K                                                                                                   2

                      0                                                                                                   0
                    Jan 22, ‘20   Apr 22, ‘20      Jul 22, ‘20   Oct 21, ‘20   Jan 20, ‘21      Apr 21, ‘21        Jul 23, ‘21

             Reported US Tests      % Positivity
    Source: View from CDC updated as of Jul 23, 2021

                                                        7           %
   Testing positivity
    has explosively
increased to almost

                                                                                             CVS Health: Perspectives on the COVID-19 Delta Variant | 6
COVID-19 is back,                           COVID-19 Hospitalization Trends
                                            Current State vs. June 6, 2021
especially in
areas with low                                             Avg. Daily
                                                           COVID-19

vaccination rates                                          Beds Used
                                                           Last 7 Days
                                                                           % Change
                                                                           vs. 7 Days       Vaccination
                                             State         per 1 M Pop.    Ending 7/24      Rate

Figure 2 compares rates of known
                                             Nevada            323            +327%             53%
infection in various states for June
6 with rates today. In Missouri
                                             Florida           273            +163%             57%
and Arkansas, for example, rates
of infection have risen eight-fold,          Missouri          272            +150%             48%
with overall low rates of protected
individuals. With this rise in infections    Arkansas          267            +259%             45%

is a concomitant increase in
                                             Louisiana          183           +188%             41%
hospitalization rates, as shown in
Figure 3.                                    Mississippi        154           +147%             39%

Based on what we know, the                   Alabama            143           +94%              42%

worst-case scenario is not being
                                             Texas              141            +97%             51%
played out today, but could be a
few weeks from now if the Delta              Oklahoma           139           +138%             47%
variant spreads unobstructed in an
unvaccinated population.                     Kansas             127           +190%             53%

                                             Georgia            118            +51%             45%
Ultimately, this kind of biological
phenomenon can eventually help               Arizona            117           +60%              52%
overwhelm vaccine opposition.
                                             Wyoming            116            +51%             41%
As Figure 4 shows, rates of new
                                             Alaska            104            +255%             51%
vaccinations in Arkansas this week
are more than double those in                Kentucky           95             +33%             51%
Massachusetts. In addition, those
who survive infection will have some
immunity which, like vaccination,
protects the rest of the population.
                                               States with the 15 highest
The overall pace of                            hospitalization rates
vaccinations is still slow                     all have vaccination rates

                                               below 57%**
despite cases significantly
surging nationwide.

                                                           CVS Health: Perspectives on the COVID-19 Delta Variant | 7
Implications for businesses
For businesses across the country, the Delta variant will force us to redraw the
map of how to return to the workplace. In the optimistic days of early June,
going back to work and life as normal in the fall seemed guaranteed; we now
see that it is not.

Vaccination requirements
For those who want to return to “normal” work, a reasonable option for employers to consider
from a clinical perspective is to allow only vaccinated individuals to enter the workplace.

Those who have not been vaccinated may increasingly be asked to work remotely, or, perhaps
in highly vaccinated areas, be allowed to return to the worksite only with full-time N-95 mask
coverage. As the Delta variant progresses, employers may wish to consider recommending
N-95 masks even for vaccinated colleagues. Otherwise, there is the risk that the unvaccinated
could infect even some of those who are vaccinated, who in turn can infect others, especially
children who are not yet qualified for vaccination.

Periodic testing
More frequent testing will also be necessary. Low-cost, very accurate tests are available today
that can detect the Delta variant and ongoing viral mutations. In some cases, employers may
decide that everyone coming into the workplace should be tested periodically.

Mask mandates
As we approach inclement weather that drives people inside, we will likely see another upswing
in infections. Masks indoors for all could very well be the default approach by year-end, as
we try to get to a more completely immune population, which would eventually decrease the
overall viral density and the opportunity for the virus to mutate toward more infectious variants.

                                                      It is not a pretty picture,
                                                      but prudent employers
                                                      should start to consider
                                                      their next steps with these
                                                      considerations in mind.

                                                                      CVS Health: Perspectives on the COVID-19 Delta Variant | 8
Looking ahead
The Delta variant will spread widely
in the coming weeks and months.
Ideas that were once thought to
be off the table, such as vaccine
mandates for employees, may
increasingly appear reasonable and
necessary. Wider use of masks likely
will return, as will testing.

At the beginning of this pandemic, wise
epidemiologists were unanimous that this
would be a three- to four-year struggle,
and they are appearing especially
prescient. Hopefully, this reality will
wear down vaccination hesitance and
antipathy to public health, which would
help us overcome this pattern of recurring
upswings in viral prevalence. Businesses
can help take the lead.

                                             Troy A. Brennan, MD
                                             Executive Vice President and
                                             Chief Medical Officer, CVS Health

                                             Sree Chaguturu, MD
                                             Senior Vice President, CVS Health and
                                             Chief Medical Officer, CVS Caremark

                                             Kyu Rhee, MD, MPP
                                             Senior Vice President, CVS Health and
                                             Chief Medical Officer, CVS Aetna

                                                   CVS Health: Perspectives on the COVID-19 Delta Variant | 9
APPENDIX                                                                                                                       Back

Figure 2

COVID-19 Case Trends
Current State vs. June 6, 2021
State               Avg. Daily Cases per 1M Pop.                       Avg. Daily Cases per 1M Pop.,
                     Avg7Daily
                    (vs.  Days Cases per 1M
                                 Ending     Pop
                                          6/6)                         7 Days Ending 6/6
State                (Vs 7 Days Ending 6/6)                            Avg Daily Cases per 1M Pop, 7 Days Ending 6/6

Arkansas                                              605 (+1080%)        51
Louisiana                                          519 (+636%)               71

Florida                                        487 (+507%)                    80

Missouri                                   394 (+649%)                    53

Mississippi                           306 (+715%)                        38

Alabama                               305 (+380%)                         64

Nevada                               276 (+262%)                              76

Alaska                              269 (+428%)                           51

Oklahoma                         237 (+748%)                             28

Kansas                        187 (+423%)                                36

Wyoming                       180 (+50%)                                          119

Texas                        178 (+272%)                                  48

Arizona                      175 (+166%)                                   66

Utah                         169 (+135%)                                     72

California                   164 (+616%)                                23

Georgia                     158 (+364%)                                  34

Kentucky                    151 (+122%)                                    68

Tennessee                   149 (+394%)                                  30

Hawaii                     142 (+280%)                                   37

South Carolina             140 (+385%)                                   29

North Carolina             123 (+158%)                                    48

Washington                116 (+47%)                                          79

Idaho                     115 (+84%)                                      63

Puerto Rico              100 (+357%)                                    22

Oregon                   97 (+44%)                                         67

Indiana                  91 (+50%)                                        61

Illinois                 90 (+123%)                                      40

New Mexico               88 (+99%)                                        44

Montana                 79 (+31%)                                         60

New Jersey              77 (+170%)                                       28

Notes:
1. Historical values may have slightly changed since first reported due to retroactive reporting changes by states.
2. Top 30 states by cases / population are shown in the chart.
3. Data as of July 25, 2021.

                                                                                        CVS Health: Perspectives on the COVID-19 Delta Variant | 10
APPENDIX                                                                                                                         Back

Figure 3

COVID-19 Hospitalization Trends
Current State vs. June 6, 2021
State                  Avg. Daily COVID-19 Beds Used Last               Avg. Daily COVID-19 Beds Used Last
                       7 Days per 1M Pop.                               per 1M Pop., 7 Days Ending 6/6
                       (vs. 7 Days
                        Avg Daily   Ending
                                  COVID      6/6)Last 7 Days / 1M Pop
                                        Beds Used                       Avg Daily COVID Beds Used Last per 1M Pop,
State                   (Vs 7 Days Ending 6/6)                          7 Days Ending 6/6

Nevada                                                    323 (+327%)             76
Florida                                             273 (+163%)                        104
Missouri                                            272 (+150%)                        109
Arkansas                                            267 (+259%)                   74
Louisiana                                   183 (+188%)                         63

Mississippi                               154 (+147%)                           62

Alabama                                143 (+94%)                                 74

Texas                                  141 (+97%)                                 72

Oklahoma                              139 (+138%)                               59

Kansas                               127 (+190%)                             44

Georgia                             118 (+51%)                                    78

Arizona                             117 (+60%)                                    73

Wyoming                             116 (+51%)                                    77

Alaska                             104 (+255%)                             29

Kentucky                          95 (+33%)                                       71

Utah                              94 (+119%)                                43

Tennessee                        87 (+22%)                                        72

Indiana                         81 (-16%)                                             96

District of Columbia            76 (-54%)                                                       164

Idaho                          72 (+12%)                                        64

Washington                     71 (-20%)                                             88

Colorado                       70 (-19%)                                             86

California                     69 (+105%)                                  34

North Carolina                 69 (+21%)                                        57

Rhode Island                   67 (-21%)                                             85

Montana                        67 (+12%)                                        60

Iowa                           66 (-1%)                                          67

Ohio                           65 (-29%)                                             91

South Carolina                 65 (+61%)                                    40

West Virginia                 59 (-46%)                                                   110

Notes:
1. Hospitalization data is updated weekly; data as of July 24, 2021.
2. Top 30 states by COVID-19 hospitalizations / population are shown in the chart.

                                                                                          CVS Health: Perspectives on the COVID-19 Delta Variant | 11
APPENDIX                                                                                                                                                                                                                         Back

          Figure 4

         Incremental Cases vs. State Vaccination Rates

           Average Daily New COVID-19 Cases by State                                                                                                                 Vaccination Active States Last Week
           Per 1M Population, 7 Days Ending 7/25/2021
           (% Change vs. Prior 7 Days)                                                                                                              ME
                                                                                                                                                                                                                                                          ME
                                                                                                                                                    46
                                                                                                                                                   (�68%)                                                                                                0.49%
 AK
 269                                                                                                                               VT         NH               AK
                                                                                                                                   29         26             0.42%                                                                          VT         NH
(�94%)                                                                                                                                                                                                                                    0.39%       0.49%
                                                                                                                                (�35%)       (�23%)

         WA            MT             ND            MN            WI                           MI                          NY           MA            RI
         116           79             41            47            55                           42                          69           60            64          WA      MT      ND      MN       WI               MI                NY         MA        RI
       (�24%)         (�40%)     (�45%)            (�52%)        (�84%)                      (�74%)                       (�51%)     (�102%)       (�97%)        0.64%   0.39%   0.52%   0.51%   0.54%            0.54%              0.81%      0.58%    0.69%

                ID           WY               SD            IA            IL            IN           OH             PA             NJ         CT
                115          180              32            63            90            91           61             42             77         55                       ID     WY       SD      IA      IL       IN      OH         PA       NJ          CT
           (�40%)           (�31%)       (�75%)        (�114%)         (�79%)         (�38%)        (�76%)     (�85%)           (�67%)       (�93%)                  0.43%   0.58%   0.73%   0.54%   0.78%    0.62%    0.47%     0.80%    0.89%       0.82%

         OR            NV             CO            NE            MO            KY            WV            MD             DE
         97            276            74            72            394           151           61            41             60                                      OR      NV     CO       NE     MO       KY       WV       MD        DE
       (�62%)         (�18%)         (�15%)        (�42%)        (�24%)        (�68%)        (�64%)        (�73%)         (�31%)                                 0.52%   1.10%   0.62%   0.83%   1.18%   0.80%     0.16%    0.77%     0.71%

               CA              AZ          UT             KS            AR             TN             VA            NC
               164             175         169            187           605            149            64            123             DC                                CA       AZ      UT      KS      AR       TN       VA       NC
                                                                                                                                    65                               0.91%   0.69%   0.66%   0.77%   1.75%    0.76%    0.74%     0.79%          DC
           (�82%)           (�31%)         (�4%)         (�29%)        (�79%)         (�81%)     (�108%)       (�66%)                                                                                                                         0.64%
                                                                                                                                   (�63%)
                                      NM            OK            LA            MS            AL            SC
                                      88            237           519           306           305           140                                                                   NM       OK      LA      MS       AL        SC
                                 (�39%)            (�67%)    (�101%)       (�132%)           (�87%)        (�74%)                                                                0.73%   0.85%   1.48%   1.06%    0.95%     0.75%

                                              TX                                                     GA
                                              178                                                    158                                                                               TX                                GA
                                         (�50%)                                                     (�78%)                                                                           1.15%                             0.58%

  HI                                                                                                         FL                     PR
 142                                                                                                        487                     100                        HI                                                             FL                PR
(�82%)                                                                                                     (�61%)                  (�111%)                   0.40%                                                          1.34%             0.89%

                                                                                                          Daily Cases per 1M Population                                                                             % 12+ Receiving First Dose Last Week
                                                                                                      0                                                250                                                       0.25%                               1.00%

         Last Refresh Date:
         07/25/2021

                                                                                                                                                                                                     CVS Health: Perspectives on the COVID-19 Delta variant | 12
*COVID-19 Data Repository by the Center for Systems Science and Engineering (CSSE) at Johns Hopkins University
**COVID-19 Reported Patient Impact and Hospital Capacity by State Timeseries dataset, U.S. Department of Health and Human Services

1. https://www.cdc.gov/coronavirus/2019-ncov/variants/variant-info.html?CDC_AA_refVal=https%3A%2F%2Fwww.cdc.gov%2Fcoronavirus%2F2019-
   ncov%2Fcases-updates%2Fvariant-surveillance%2Fvariant-info.html.
2. https://www.medrxiv.org/content/10.1101/2021.07.07.21260122v1.
3. https://www.forbes.com/sites/williamhaseltine/2021/07/13/the-delta-dilemma-loosening-covid-19-controls-at-a-time-of-increased-
   danger/?sh=45471e222750.
4. https://www.thelancet.com/journals/lancet/article/PIIS0140-6736(21)01358-1/fulltext.
5. https://www.cdc.gov/coronavirus/2019-ncov/science/science-briefs/fully-vaccinated-people.html.
6. https://www.gov.uk/government/news/vaccines-highly-effective-against-b-1-617-2-variant-after-2-doses.
7. https://www.nytimes.com/2021/07/20/health/coronavirus-johnson-vaccine-delta.html.

This page contains trademarks or registered trademarks of CVS Pharmacy, Inc. and/or one of its affiliates.
©2021 CVS Health. All rights reserved. 106-55365A 072721
You can also read