COVID-19 Recovery Committee 4th Meeting, 2022 (Session 6), Thursday, 3 February 2022 Modelling the epidemic in Scotland
←
→
Page content transcription
If your browser does not render page correctly, please read the page content below
CVDR/S6/22/4/3

COVID-19 Recovery Committee
4th Meeting, 2022 (Session 6), Thursday, 3
February 2022
Modelling the epidemic in Scotland
This note looks at how the Omicron variant has been modelled in Scotland

Overview of the performance of modelling
By the end of January 2022, the Scottish Government had published 87 separate
reports setting out its Covid modelling assumptions and results. These set out the
results of modelling, as well as some of the underlying assumptions and
underpinning data, for example from contact surveys, and from samples of
wastewater. The most recent modelling report (27 January 2022) looked back at
how well the SG modelling had performed compared to estimate of the actual data.
Some of the points made by the government were that:

   •   Overall the actual number of infections were largely within the ranges
       modelled throughout 2021. However, there were some variations and for
       example, at the start of the year, the actual infections were higher than
       expected in the modelling due to the effects of the Alpha variant
   •   The actual number of hospital beds has been in general within model
       ranges.
   •   The actual number of ICU beds has in general been within model ranges.
       There is however a period in October 2021 where the number of ICU beds
       were lower than expected. This also occurred at the end of December 2021
       when Omicron was dominant (see chart below.)

                                         1
Figure 5. ICU bed projections versus actuals, for historical projections published between
one and two weeks before the actual data came in.

Scottish Government Omicron in Scotland: evidence paper: 11
December 2021

The Scottish Government produced an evidence paper in early December, which set
out its understanding of the new variant at that time. Amongst its conclusions were
that:

       “Based on data to 6th December, we can estimate a doubling time for
       Scotland of between 2.18 - 2.66 days” ... “Omicron is likely to make up the
       majority of cases in Scotland between mid-December and early January
       2022”

The chart below sets out the government’s understanding of the possible number
of Omicron infections over the next two weeks, at that time.

Figure 6: Medium term projections of modelled total new daily Omicron infections,
adjusting SGTF positive tests to account for asymptomatic and undetected infections, from
Scottish Government modelling, based on positive test data reported up to 6th

                                              2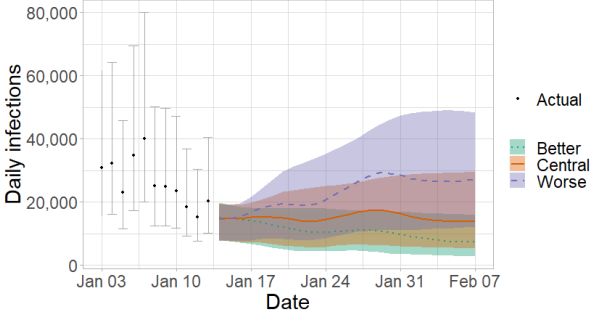
December

The government said the implications of this were that:

   •   “Omicron is spreading at a rate that threatens a rapid and large surge
       of COVID-19 cases. Even if the resulting illness is relatively mild the number
       of cases could potentially cause great disruption to other services, in the
       economy and businesses, and in wider society, as more people would be
       absent from work due to illness and asked to isolate if they test positive, or as
       contacts of someone who has tested positive.

   •   “It also means that the rapid rise in Omicron infections could put significant
       additional pressure on hospitals and other health and care services, close to
       the point in the winter when they are already likely to be at peak pressure”.

Scottish Government modelling the epidemic reports

Below, are some of the key results of the modelling, particularly in relation to the
growth and impact of Omicron. Further detail and associated caveats and
explanations are set out in each report

The December 2nd report 80 said that at this point

       “It is too soon to take account of the potential impact of Omicron within the
       modelling presented in this report. Therefore, projections included are based
       on Delta only. In the coming weeks we hope to have further data to enable us
       to model the impact of Omicron with some degree of confidence.”

                                           3
The 10 December report 81 included some of the same analysis for Omicron as set
out in the evidence paper described above. This report also included projections for
hospitalisations and deaths, but these were explicitly based on the available
evidence for Delta only, (the central projections show a downward path for
hospitalisations and ICU demand up to December 20th (figures 6/7) with SPI-M
projections showing a continuation of that trend over a longer period (figures 8/9).
The 17 December report 82 said that
“Infections are rising and the number of infections are expected to continue to
rise in the coming weeks as Omicron becomes more dominant. In three
weeks' time we estimate that daily infections may be between 15,000 and
130,000”
And also that
“At the present time, due to the lag between infections and hospitalisations,
only infections figures are provided … We hope to be able to provide hospital
occupancy and ICU in future weeks.”
In its last report of the year, the 23 December report 83 still showed a wide possible
range of numbers of infections (although slightly narrower than the previous week),
and said:
“Infections are rising and the number of infections are expected to continue to rise
in the coming weeks as Omicron becomes more dominant. In three weeks' time
we estimate that daily infections may be between 18,000 and 110,000 based on
the effect of the new interventions announced on 14th and 21st December, and
booster take up”.
However, consensus projections for hospital admissions and deaths were not
available:
“Due to uncertainty surrounding the characteristics of the Omicron variant and
its increasing prevalence across the UK, SPI-M-O has been unable to
produce consensus medium-term projections for hospital admissions and
deaths this week”.
In the new year, the 7 January 2022 report 84 provided data for total combined daily
infections (including Omicron and Delta), and took the projections to the end of
January. The report said
“We estimate that daily infections may be between 25,000 and 110,000 by
mid-January. In two weeks, we estimate that daily hospital admissions will be
between 400 and 770, and daily deaths will be between 5 and 92”
4Figure 12. Medium term projections of modelled total new combined daily infections in
Scotland, adjusting positive tests to account for asymptomatic and undetected infections,
from Scottish Government modelling, based on positive test data reported up to 2nd January
2022
The 13 January report 85 had the same analysis as the previous week, though
updated, and the projected number of infections ran into February. The estimate for
daily infections was “between 20,000 and 80,000 by mid-January. By 7th February
daily infections are estimated to be between 5,000 and 26,000” and that generally,
“hospitalisations, hospital occupancy and deaths are rising and are expected to
continue to rise”
Figure 9: Medium term projections of modelled total new combined daily infections in
Scotland, adjusting positive tests to account for asymptomatic and undetected infections,
from Scottish Government modelling, based on positive test data reported up to 5th January
2022
5The report of 21 January 2022 includes an estimate of daily infections may be
between 5,000 and 50,000 in early February
Figure 10. Medium term projections of modelled total new combined daily infections in
Scotland, adjusting positive tests5 to account for asymptomatic and undetected infections,
from Scottish Government modelling, based on positive test data reported up to 17th January
2022
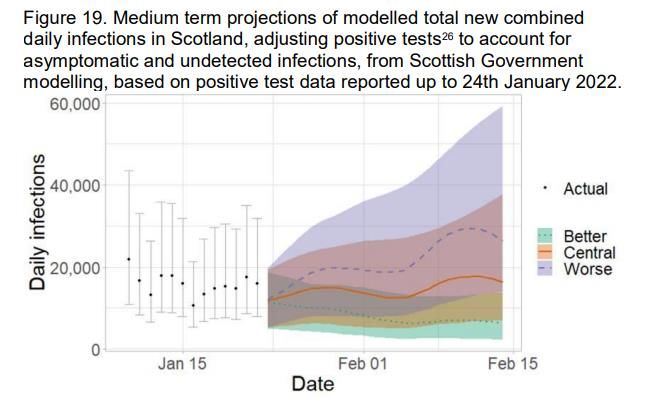
Finally, the most recent report (of 28 January 2022) indicated that
• The future trajectory of infections, hospitalisations, hospital occupancy and
deaths is highly uncertain; some Delta infections may also continue. We
estimate that daily infections may be between 5,000 and 60,000 in mid-
February. This includes the impact of the interventions announced on 14th and
21st December; those announced as being lifted from 17th, 24th and 31st
January; and booster take up.
6Modelling Omicron – early data from England
In early December there was considerable uncertainty about Omicron. This paper
(11 December 2021) which described itself as “a work in progress”, modelled the
potential consequences of Omicron in England (London School of Hygiene &
Tropical Medicine and Stellenbosch University). The paper described a number of
scenarios, and also said “Due to a lack of data, we assume Omicron has the same
severity as Delta. If Omicron exhibits lower severity than Delta, this would decrease
the projected number of severe outcomes in our model.”
The paper’s summary includes the following results:
“In all four main scenarios, we model a policy of compulsory mask wearing in
shops and on public transport from 30th November 2021, as well as
introducing “Plan B” measures from 12th December 2021. Under these
control measures, our most optimistic scenario projects peak daily hospital
admissions of 2,400 (95% projection interval: 1,700–3,600) in England
occurring in January 2022. Our most pessimistic scenario projects peak
hospital admissions of approximately twice the size of the January 2021
peak….
…These results suggest that Omicron has the potential to cause substantial
surges in cases, hospital admissions and deaths in populations with high
levels of immunity, including England. The reintroduction of additional non-
pharmaceutical interventions may be required to prevent hospital admissions
exceeding the levels seen in England during the previous peak in winter
2020–2021.”
7Figure 2 in the paper set out a number of scenarios and included projections of
deaths in England due to Omicron from 1 December 2021 to 1 April 2022 of between
24,700 and 74,800.
In an update (23 December 2021) the authors identified new evidence and said
“A new paper released on 22nd December 2021 by Imperial College (Report
50) shows that A&E visits among Omicron cases are reduced by 30–40%
relative to Delta. This could translate into a baseline severity for Omicron of
60–70% relative to Delta …. which would scale our projections for severe
outcomes down by 30–40%.”
Simon Wakefield SPICe Research,
2 February 2022
Note: Committee briefing papers are provided by SPICe for the use of Scottish
Parliament committees and clerking staff. They provide focused information or
respond to specific questions or areas of interest to committees and are not intended
to offer comprehensive coverage of a subject area.
The Scottish Parliament, Edinburgh, EH99 1SP www.parliament.scot
8You can also read