COVID-19 UTILITY DEBT - BRIEFING PAPER
←
→
Page content transcription
If your browser does not render page correctly, please read the page content below
BRIEFING PAPER
                                           JUNE 2021

KEEPING THE LIGHTS AND HEAT ON:

   COVID-19
  UTILITY DEBT
    IN COMMUNITIES SERVED BY
PACIFIC GAS AND ELECTRIC COMPANY

        Paul M. Ong, Silvia R. González,
       Kelly Trumbull and Gregory Pierce

                                                      |1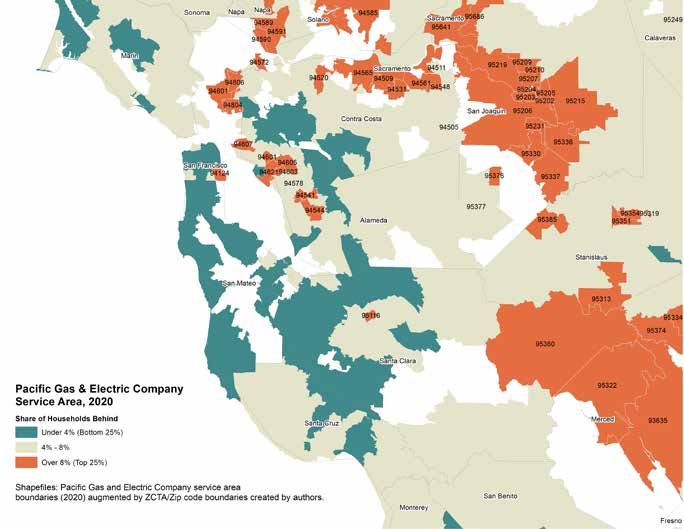
AUTHORSHIP
» Paul M. Ong, director, UCLA Center for
  Neighborhood Knowledge
» Silvia R. González, senior researcher, UCLA Luskin
  Center for Innovation and affiliated researcher, UCLA
  Center for Neighborhood Knowledge
» Kelly Trumbull, researcher, UCLA Luskin Center for
  Innovation
» Gregory Pierce, associate director, UCLA Luskin
  Center for Innovation

ACKNOWLEDGEMENTS
This report was made possible by generous support
from the Chan-Zuckerberg Foundation. The authors
would like to thank Michelle Einstein and Nick Cuccia
for copy editing and designing this report.

This project builds on UCLA’s Center for Neighborhood
Knowledge (CNK) COVID-19 Equity Research Initiative,
which includes studies examining how the negative
economic impacts of COVID-19 are distributed across
neighborhoods, as well as UCLA’s Luskin Center for
Innovation collaborations with civic partners to help
advance renewable and affordable energy in California.
This research brief is part of a series that explores
utility debt as a useful measure to track housing
stability in California’s neighborhoods. Learn more here
about our first brief, Keeping the Lights and Water On:
COVID-19 and Utility Debt in Los Angeles’ Communities
of Color.

As a land grant institution, UCLA and the Center for
Neighborhood Knowledge and the Luskin Center for
Innovation acknowledge the Gabrielino and Tongva
peoples as the traditional land caretakers of Tovaangar
(Los Angeles basin, Southern Channel Islands) and
that their displacement has enabled the flourishing of
UCLA.

DISCLAIMER
The views expressed herein are those of the authors
and not necessarily those of the University of
California, Los Angeles as a whole. The authors alone
are responsible for the content of this report.

FOR MORE INFORMATION
Contact: Silvia R. González, sil.rgonzalez@ucla.edu

© June 2021 by the Regents of the University of
California, Los Angeles. All rights reserved. Printed in
the United States.

TABLE OF CONTENTS
Executive Summary������������������������������������������������������������������������4

Introduction��������������������������������������������������������������������������������������5

Methodology �����������������������������������������������������������������������������������6
    Map 1: PG&E’s Service Area ������������������������������������������������������7

Utility Debt Is Unevenly Distributed�����������������������������������������8

Racial and Income Disparities in Utility Debt Rates�������������8
    Map 2: Share of Households
    in COVID-19 Utility Debt, 2020 Q2��������������������������������������������9
    Map 3: Bay Area Neighborhoods
    by COVID-19 Utility Debt Burden, 2020 Q2���������������������������10

Conclusions and Policy Recommendations������������������������� 11
    Table 1: Profile Of Utility Debt by Neighborhoods���������������11

Endnotes������������������������������������������������������������������������������������������ 13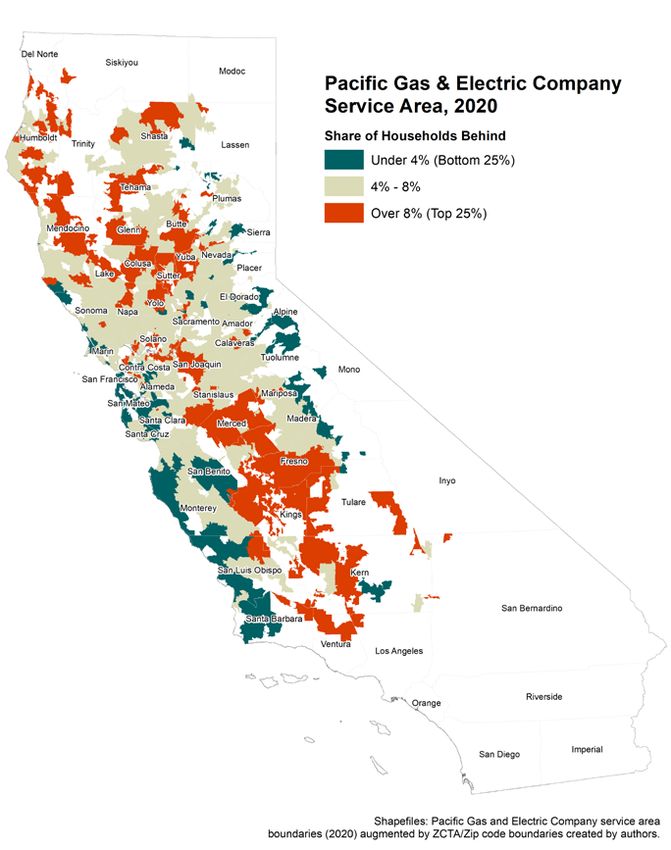
EXECUTIVE SUMMARY                                        continued utility access for many families, debt on
                                                         residential accounts has not been forgiven; thus,
THE COVID-19 PUBLIC HEALTH CRISIS has                    residential utility debt has accumulated and will be
deepened existing economic and environmental             due when the moratorium ends, which is set for
justice crises in the United States. Previous            June 30, 2021.
research by the UCLA Center for Neighborhood
                                                         We provide findings for two analyses on residential
Knowledge and its partners shows that the
pandemic has exacerbated pre-pandemic health             utility debt in neighborhoods served by PG&E
and economic inequalities for disadvantaged              during the second quarter of 2020, the most
neighborhoods. Communities of color in particular        recently available data, which captures the
have shouldered a disproportionate share of              California Public Utility Commission’s (CPUC) April
interrelated health and economic risks due to            2020 order to suspend service disconnections.
widespread job and income loss, increased                First, we provide an overview of the spatial
housing vulnerability and food insecurity, a lack        distribution of housing units with past-due utility
of basic resources to shelter in place, and less         bills in PG&E service areas and then identify
access to critical utilities such as broadband           neighborhoods facing the greatest debt burden.
Internet service. The pandemic’s economic impacts        Second, we use bivariate analysis to examine
have also exacerbated the unaffordability of             economic, housing, and ethnoracial characteristics
basic environmental service utilization, like trash      in areas with the highest burden. Overall, our
collection, for many households.                         focus on neighborhoods enables elected officials
                                                         to understand how utility debt relief distribution
In this brief, we study household utility debt           impacts their constituents; encourages advocacy
burden as another measure of the economic                for an equitable distribution of utility debt relief
pressure facing low-income neighborhoods, with           that is on its way from the federal stimulus and
an emphasis on the impacts on racial equity. We          state budget surplus aid; and informs thoughtful
define utility debt burden in this brief as the share    long-term solutions as we move into a phase of
of households in arrears (i.e., with past-due utility    recovery.
bills) within a zip code. Our findings highlight the
reproduction of racial and economic inequality           ⊲ Our main findings are:
during the pandemic. We use data from Pacific Gas        1. R
                                                             oughly 6% households served by PG&E are
and Electric Company (PG&E), an investor-owned              facing financial difficulties paying for the most
utility that provides electricity and gas service to        essential services.
much of the population in Northern and Central
                                                         2. U
                                                             tility debt burden is higher across historically
California, about 40% of the state’s residents, to
                                                            underserved rural areas and urban areas
examine the prevalence and degree of residential
                                                            left behind more broadly during the
past-due accounts and debt. Utility debt levels
                                                            COVID-19 pandemic. For instance, one in five
serve as a useful proxy to track households that
                                                            households are behind on their utilities in
are facing difficulties paying their rent or mortgage,
                                                            high-heat exposure areas in Fresno, Stockton,
because these two types of debt are likely to be
                                                            Bakersfield in the San Joaquin Valley, and in
highly correlated during economic crises. Further,
                                                            the unincorporated Hoopa Valley home to the
when families are unable to pay their bills, they
                                                            Natinnoh-hoi People.
face difficult trade-offs, including skipping meals,
delaying or avoiding medical treatment, and              3. B
                                                             lack, Latinx, and economically vulnerable
risking eviction. While the April 2020 statewide            neighborhoods face the greatest utility debt
moratorium on utility shut-offs has provided                burden.

4 | COVID-19 UTILITY DEBT IN COMMUNITIES SERVED BY PG&E
⊲ Based on our findings, we recommend: enormous financial hardships for workers, families,
1. T
argeted allocation of existing COVID-19-related businesses, and communities.
federal, state, and local aid and further new
The pandemic has also exacerbated pre-
short-term and long-term commitments of aid to
pandemic health and economic neighborhood
develop and implement utility debt-forgiveness
inequalities, including widespread job and income
programs for low-income households and
loss,3 housing vulnerability,4 food insecurity,5
severely impacted neighborhoods.
and tap water precarity.6 People of color have
2. C
ontinued improvement in the value, quality, been disproportionately affected by COVID-19-
and availability of debt and shut-off data related layoffs and barriers to accessing a variety
collected and publicly reported by utilities of essential services — for instance, a digital
throughout California to better understand divide impacts virtual learning7 and remote work
the depth and breadth of utility burden on opportunities.8 The pandemic’s economic impacts
low-income residents and residents of color. have also made access to critical utilities less
Improved data will allow for targeted and affordable for many. Furthermore, the pandemic
relevant policy that addresses the distinct has led to an increase in residential energy
needs of these residents as they reflect broader consumption as people spent much more time
patterns of housing and climate insecurity. at home due to shelter-in-place orders and
3. R
eplication in non-PG&E service areas of this associated closures. Not only are economic
type of analysis, ideally using spatial data on conditions for low-income households worse, but
the combined impact of energy and water residential electricity consumption and therefore
bill debt so that state and local governments bills also increased as a direct result of people
can better develop and target policies and spending more time at home due to the pandemic,
programs to more holistically protect renters further exacerbating the economic burden of utility
and homeowners. bills on low-income households.
INTRODUCTION According to the California Public Utilities
Commission (CPUC), residential electric usage
THE SPREAD OF COVID-19 has created increased about 15% to 20% for Californians
upheavals not seen since the 1918 Spanish flu sheltering at home.9 To put this in context, the
pandemic. By the end of May 2021, the nation mean combined monthly household expenditure
reported over 33.2 million confirmed cases and for electricity and natural gas service in California
over 597,000 deaths.1 In California, the death toll was $166 in 2019, before the pandemic, and
reached more than 62,000 and cases reached generally should be below 6% of income to be
more than 3.69 million;2 the state was the considered affordable.10,11 In this brief, we study
epicenter of the crisis in the U.S. in late 2020. In unpaid residential gas and electric bills to measure
addition to the direct health costs of illness and the economic pressure facing neighborhoods
death, the indirect impacts on the economy have served by Pacific Gas & Electric (PG&E), with a
been tremendous. To flatten the curve and prevent focus on racial disparities in utility debt.
the number of new cases from overwhelming the
healthcare system, public officials took dramatic In April 2020, the CPUC ordered PG&E and
actions to limit person-to-person interactions by other investor-owned utilities to suspend service
restricting group gatherings, encouraging social disconnections due to non-payment for both
distancing, and ordering people to shelter in place. residential and commercial customers until April
These direct and indirect disruptions have created 16, 2021 and later extended these COVID-19
Introduction | 5emergency protections through June 30, 2021.12 to areas in brown with blue dots on the map,
As a result of the moratorium, PG&E has paused electricity only to the areas in brown, and gas only
service disconnections for non-payment for to areas with blue dots (many of which receive
residential and small, medium, and large business their electricity from publicly owned utilities like the
customers; paused income verification and re- Sacramento Municipal Utility District).
enrollment requirements for California Alternate
Rates for Energy (CARE) and Family Electric Rate We examine the extent of utility bill debt defined
Assistance (FERA) bill discount programs to make as the share of households in arrears in PG&E’s
it easier for customers to enroll or stay enrolled service territory in this brief. Specifically, we
in these rate assistance programs that can help analyze the disparities in utility debt across
to lower bills; waived security deposits for small neighborhoods. Using publicly available data
commercial customers; and paused on Medical provided to the CPUC by PG&E, we conduct two
Baseline program recertification.13 analyses on residential utility debt. We assess
areas served by PG&E during the second quarter
Although the statewide moratorium on utility shut- of 2020, which captures the CPUC’s April 2020
offs has ensured continued energy access for order to suspend service. First, we provide an
many families, accumulating debt levels are a crisis overview of the spatial distribution of housing
that has yet to be resolved. Utility debt can lead to units with past-due utility bills in PG&E service
difficult trade-offs for disadvantaged communities, areas and identify neighborhoods facing the
like paying utility bills to keep the lights on rather greatest debt burden. Second, we use bivariate
than buying groceries, making unsafe housing analysis to examine economic, housing, and
decisions such as coping with inadequate cooling ethnoracial characteristics in areas with the highest
systems, and accumulating debt.14 However, burden. We conclude with a discussion of policy
utility debt is not a new problem. In 2015, one- recommendations to address utility debt burden.
third of American households faced challenges in The results of this study can serve as an early
meeting their energy needs.15 Energy insecurity warning system that can assist state and local
in the United States disproportionately affects governments to develop better and targeted
households with children, households of color, policies and programs to assist households and
and low-income and fixed-income households.16 neighborhoods most at-risk when the eviction
At the start of the pandemic in 2020, an estimated moratorium expires.
4.8 million low-income American households
were unable to pay an energy bill, an issue that METHODOLOGY
intensified in the early months of the pandemic.17
OUR UNIT OF ANALYSIS in this study is census
PG&E is one of the largest combined natural gas zip code tabulation areas (ZCTAs), which we use
and electric energy companies in the United as a proxy for neighborhoods. We used two data
States, and easily the largest combined retail sources to construct our research dataset. The first
energy utility in California. Based in San Francisco, source is zip code level data submitted by PG&E
the company provides natural gas and electric to the CPUC in response to Resolution M-4849.19
service to about 16 million people spanning This is a part of PG&E’s COVID-19 Emergency
from Santa Barbara County in Central California Customer Protections Transition Plan, dated April 1,
to Humboldt County in Northern California and 2020, which includes information on arrearage on
extending almost to the Nevada State border.18 utility bills. The information includes the “number
Map 1 illustrates PG&E’s electricity and gas service and percent of unique customers, by ZIP code,
territory. PG&E provides both gas and electricity who are more than 90 days in arrears, not enrolled
6 | COVID-19 UTILITY DEBT IN COMMUNITIES SERVED BY PG&EMAP 1
PG&E’S SERVICE AREA
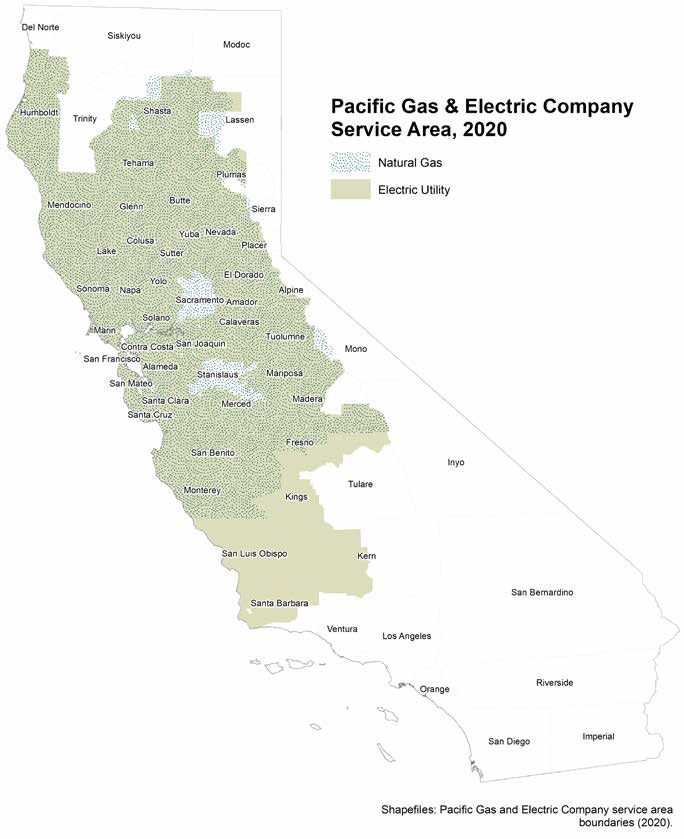
Methodology | 7in a Recent Applicable Payment Plan or in the San Joaquin Valley; and in northwestern
conventional extended payment plan, and in a California in the unincorporated Hoopa Valley
Recent Applicable Payment Plan or conventional (95546), which is located on the federally
extended payment plan, and more than $250 designated tribal area of the Natinnoh-hoi People.
in total arrears.” The data are for accounts with
outstanding debt during the second quarter of The neighborhoods with the greatest absolute
2020, capturing the months after the CPUC’s April number of households behind on their bills (at least
2020 order to suspend service disconnections. 3,000) are also in Bakersfield (93307 and 93306)
and Fresno (93722), as well as Pittsburgh (94565).
Residential account data were then merged with Neighborhoods with the fewest households
the second data source, ZCTA-level economic behind on utility bills include affluent and less
and housing information from the 2015 to 2019 heat-exposed coastal communities such as Pismo
five-year American Community Survey (ACS). For Beach (93449) and Palo Alto (94305).
the statistical analysis, we categorized ZCTAs
into three utility burden categories ranked by the Map 3 provides a snapshot of the neighborhoods
percent of households that are past due on their in the greater San Francisco Bay Area. Areas in the
utility bills in the ZCTA: lowest burden (bottom 25% top 25% of households in debt include historically
quartile), highest burden, (top 25% quartile), and segregated neighborhoods. For instance, more
the remainder representing the middle (roughly than 4,100 households are behind on their bill
50%). The share of households in debt is the payments in zip codes 94601, 94621 and 94603,
sum of past-due accounts in a ZCTA divided by which span Fruitvale and East Oakland. These
the number of residential customers. Each of the predominantly Latino and Black, as well as low-
three categories is weighted by the number of income, neighborhoods were among the hardest
customers in the neighborhood so that the lowest hit during the first peak of the pandemic.20 Other
quartile contains a quarter of PG&E’s customers, impacted communities include zip code 95116, which
the middle half contains half of the customers, and encompasses part of Alum Rock, one of San Jose’s
the top quartile contains the rest. most notable Chicano/Mexican-American districts.
UTILITY DEBT IS RACIAL AND INCOME DISPARITIES
UNEVENLY DISTRIBUTED IN UTILITY DEBT RATES
WE FIND THAT HOUSEHOLDS who are burdened TABLE 1 SHOWS the average profile of
by utility debt are unevenly distributed across neighborhoods served by PG&E by their utility
the PG&E service area. Roughly 6% households debt rate. Utility debt rate is defined as the share
served by PG&E are facing financial difficulties of households with past due account balances.
paying for the most essential services. We The utility debt rate is twice that in the highest-
find disproportionately high debt in historically debt neighborhoods compared to the lowest-debt
underserved rural areas and urban areas left neighborhoods. There are also variations by the
behind more broadly during the COVID-19 type of utility. Among the neighborhoods with
pandemic. Map 2 shows the estimated share of the highest debt, roughly 5% of households with
households behind on their gas and electric bills. gas-only accounts are in debt compared to only
The neighborhoods with the greatest share of 3% of households with electricity-only accounts.
households behind on their utility bills (roughly Households in the lowest-debt neighborhoods
20%) are high-heat exposure areas in Fresno served by one utility have a greater chance of
(93701); Stockton (95202) and Bakersfield (93305) holding debt.
8 | COVID-19 UTILITY DEBT IN COMMUNITIES SERVED BY PG&EMAP 2
SHARE OF HOUSEHOLDS IN COVID-19 UTILITY DEBT, 2020 Q2
Racial and income Disparities | 9MAP 3
BAY AREA NEIGHBORHOODS BY COVID-19 UTILITY DEBT BURDEN, 2020 Q2
We find that utility debt rates vary inversely The lowest burdened areas also experienced
with economic vulnerability. On average, lower job displacement levels than the state as a
neighborhoods with highest debt rates have whole (12% unemployment compared to over 15%
lower incomes and higher poverty rates. For for the state22). These findings highlight widening
instance, the neighborhoods with the highest rates racial and socioeconomic disparities through
(those in the top 25% quartile) have a poverty the job displacement caused by pandemic.23 As
rate — 20% — that is two-and-a-half times higher it relates to housing characteristics, high-debt
than the neighborhoods with the lowest rates neighborhoods have a larger share of renters —
(bottom 25%) — 8%. The COVID-19 pandemic 49% on average compared to 45% in lower-debt
had a significant effect on every labor market neighborhoods. Black and Latinx neighborhoods
indicator across all states and sectors in the face the highest utility debt rates. On average,
nation,21 and we show utility debt is correlated with neighborhoods with greater debt rates have a
unemployment rates — neighborhoods with the larger share of Black and Latinx residents and
lowest burden have lower unemployment rates. fewer white residents.
10 | COVID-19 UTILITY DEBT IN COMMUNITIES SERVED BY PG&EWhile the analysis does not account for the fact
that PG&E does not provide gas and electricity
CONCLUSIONS AND POLICY
to all customers, the findings of the uneven RECOMMENDATIONS
geographic distribution of the debt rate are robust.
THE EMPIRICAL ANALYSES presented in this
In a separate analysis of the ZCTAs covered by
research brief suggest that 6% households
both gas and electricity service not presented in
served by PG&E are facing financial difficulties
this brief, we find that low-income and minority
paying for the most essential services. There
neighborhoods have higher debt rates. There is
are also variations by the type of service with a
also a potential confounding factor: The energy
greater share of households with PG&E’s gas-
account is occasionally held by the landlord of
only accounts in debt compared to households
an apartment complex rather than tenants, in
with electricity-only accounts. Our findings
particular for low-income renters. We used a
also highlight the reproduction of racial and
multivariate model to account for this occurrence,
economic inequality during the pandemic. We find
and we still find that low-income and minority
disproportionately high debt in areas left behind
neighborhoods have higher debt rates.
more broadly during the COVID-19 pandemic,
including neighborhoods with a larger share of
residents of color, economically disadvantaged
individuals, and unemployed workers. These
findings likely mirror systematic patterns of racial
TABLE 1
PROFILE OF UTILITY DEBT BY NEIGHBORHOODS
Lowest Debt Highest Debt
Average (Bottom 25%, Middle Half (Top 25%,
n=136) (n=369) n=189)
Households Behind on Utility Bills
Average all neighborhoods 6% 2% 5% 11%
Natural gas service only 9% 5% 13% 5%
Electricity service only 2% 4% 1% 3%
Economic Characteristics
Poverty rate 12% 8% 10% 20%
Average household income $90k $124k $89k $56k
County unemployment rate 12% 14% 15%
Housing Characteristics
Renters 42% 45% 38% 49%
Do not pay utility separately 3% 5% 3% 2%
Demographic
Asian 17% 29% 14% 11%
Black 5% 3% 4% 9%
Latinx 29% 16% 25% 48%
Non-Latinx White 45% 47% 51% 28%
Conclusions and Recommendations | 11and income disparities in households facing burden on low-income residents and residents
difficulties paying housing costs. Some households of color, utilities throughout California need
may end up being evicted, while others will have to continue to improve the value, quality, and
a huge debt to repay, compounding the impact on availability of debt and shut-off data. This will allow
financial credit, as well as on physical and mental for targeted and relevant policy that addresses the
health impact due to electricity and gas rationing. distinct needs of these populations.
In addition to one-time funds allocated through We also recommend that the analysis of PG&E
the budget surplus in California ($2 billion for be replicated for other utilities using spatial data
water and electricity),24 we recommend further on electricity, gas, and water debt. Moreover,
prioritization of long-term financial support and to further understand the role of utility debt
systemic reform in financing for essential services on housing cost burden, it is desirable to
and infrastructure improvements to ensure that differentiate the impact on renters separately
the most vulnerable residents have access to from homeowners. The results can serve as
vital public services and housing. Support should an early warning system that can assist state
include the generous allocation of COVID-19-
and local governments to develop better
related federal, state, and local aid to develop and
and targeted policies and programs to assist
implement utility debt-forgiveness and avoidance
households and neighborhoods most at risk
programs for low-income households and severely
when the eviction moratorium expires. This type
burdened neighborhoods.
of system will be even more necessary as utility
While the analysis focuses on utility debt, bills may further increase as we work to make
the findings in this brief can likely assist in the necessary transition from carbon-dependent
understanding the geographic pattern of the to renewable fuels, and seek to provide heat,
housing crisis created by the pandemic and the smoke, and pollution-exposed households with
growing number of renters and homeowners energy-intensive but health protective in-home
behind in their monthly rents and mortgages. To technologies such as air conditioning and air
better understand the depth and breadth of utility filtration.
12 | COVID-19 UTILITY DEBT IN COMMUNITIES SERVED BY PG&EENDNOTES Peoples, J. H., Ong, P., Larson, T., & D. Mars.
7
(2020). “COVID-19 and the Digital Divide in
1
enters for Disease Control and Prevention
C Virtual Learning.”
(2021). “COVID Data Tracker,” accessed June 14, https://knowledge.luskin.ucla.edu/wp-content/
2021, available at: uploads/2020/12/Digital-Divide-v04_Pre_Final.
https://covid.cdc.gov/covid-data-tracker/#cases_ pdf
totalcases 8
ay, R. S., & P. Ong (2020). “Unequal Access to
R
2
tate of California (2021). “Tracking COVID-19 in
S Remote Work During the Covid-19 Pandemic.”
California Last updated June 14, 2021 at 10:00 https://knowledge.luskin.ucla.edu/wp-content/
AM.” Available at: https://covid19.ca.gov/state- uploads/2020/12/RemoteWork_v02.pdf
dashboard/ 9
alifornia Public Utilities Commission (2021).
C
3
ng, P., Mar, D., Larson, T. & J.H. Peoples
O “Coronavirus- COVID-19 Information.”
Jr. (2020). “Inequality and COVID-19 Job https://www.cpuc.ca.gov/covid/
Displacement.” 10
2019 American Housing Survey. U.S. Census
https://knowledge.luskin.ucla.edu/wp-content/ Bureau.
uploads/2020/12/COVID_Job_Displacement_
brief.pdf
11
he American Council for an Energy-Efficient
T
4
Ong, P. (2020). “Systemic Racial Inequality and Economy in “Understanding Energy Affordability”
the COVID-19 Renter Crisis.” explains that this 6% affordability threshold is
https://knowledge.luskin.ucla.edu/wp-content/ derived from Fisher, Sheehan and Colton’s Home
uploads/2020/12/20200807-Systemic-Racial- Energy Affordability Gap Analysis
Inequality-and-the-COVID-19-Renter-Crisis.pdf http://www.homeenergyaffordabilitygap.com/
Wong, K., Ong, P. & S.R. Gonzalez (2020). 12
ead the resolution here:
R
“Systemic Racial Inequality and the COVID-19 https://www.cpuc.ca.gov/uploadedFiles/
Homeowner Crisis.” CPUCWebsite/Content/News_Room/
https://www.anderson.ucla.edu/documents/ NewsUpdates/2020/Final%20Resolution%20
areas/ctr/ziman/Systemic-Racial-Inequality-and- M-4842.pdf
COVID-19-Homeowner-Crisis_Wong_Ong_ 13
G&E (2021). “Financial assistance and support
P
Gonzalez.pdf
for customers.”
5
arson, T., Ong, P., Mar, D., & J.H. Peoples
L https://www.pge.com/en_US/about-pge/
Jr. (2020). “Inequality and COVID-19 Food company-information/protective-protocols/
Insecurity.” financial-support-awareness.page
https://knowledge.luskin.ucla.edu/wp-content/ 14
urkoski, L, Scott, T. (2014). “Plenty at Stake:
M
uploads/2020/12/Inequality-COVID-19-Food-
Indicators of American Energy Security. United
Insecurity.pdf
States. Congress. Senate. Committee on Energy
6
Gonzalez, S. R. (2021). Keeping the Lights and and Natural Resources.”
Water On: COVID-19 and Utility Debt in Los 15
.S. Energy Information Administration (EIA).
U
Angeles’ Communities of Color.”
(2018). “One in three U.S. households faces a
https://escholarship.org/uc/item/3317w1fb
challenge in meeting their energy needs.”
https://www.eia.gov/todayinenergy/detail.
php?id=37072
16
Ibid.
Endnotes | 1317
his 2020 study was conducted by a research
T 21
Congressional Research Service (2021).
team at the O’Neill School of Public and “Unemployment Rates During the COVID-19
Environmental Affairs at Indiana University, led Pandemic.” Report number R46554.
by principal investigators David Konisky and https://fas.org/sgp/crs/misc/R46554.pdf
Sanya Carley. A report with more findings is 22
California’s seasonally adjusted unemployment
available from the O’Neill School at
rate for the second quarter of 2020 was
https://energyjustice.indiana.edu/
tabulated by taking the average of April, May,
doc/09232020_wave_2.pdf?_
and June 2020 rates (16%, 15.6%, and 14.1%,
ga=2.240537539.1126584757.1618976616-
respectively). Data source: U.S. Bureau of Labor
93540550.1618976616
Statistics, Unemployment Rate in California
18
PG&E (2021). “About PG&E.” [CAUR], retrieved from FRED, Federal Reserve
https://www.pge.com/en_US/about-pge/about- Bank of St. Louis;
pge.page https://fred.stlouisfed.org/series/CAUR,
June 14, 2021.
19
acific Gas and Electric Company (2021).
P
“Advice 4414-G/6142-E.” 23
Ong, P., Mar, D., Larson, T. & J.H. Peoples
https://www.cpuc.ca.gov/uploadedFiles/ Jr. (2020). “Inequality and COVID-19 Job
CPUC_Public_Website/Content/Utilities_and_ Displacement.”
Industries/Energy_-_Electricity_and_Natural_ https://knowledge.luskin.ucla.edu/wp-content/
Gas/PGE%20-%20GAS_4414-G.pdf uploads/2020/12/COVID_Job_Displacement_
brief.pdf
20
artichoux, A. (2020). “3 Oakland zip codes
M 24
Governor Gavin Newsom. “May Revision 2021-
have worse COVID-19 case rates than Florida
22.
and Georgia: The hardest hit zip codes span
http://www.ebudget.ca.gov/2021-22/pdf/
Fruitvale and East Oakland”. 20 August.
Revised/BudgetSummary/FullBudgetSummary.
https://abc7news.com/oakland-coronavirus-
pdf
cases-covid-alameda-county-dashboard-
fruitvale/6363967/
14 | COVID-19 UTILITY DEBT IN COMMUNITIES SERVED BY PG&Einnovation.luskin.ucla.edu
knowledge.luskin.ucla.edu
Endnotes | 15You can also read