Ireland's Housing Need & Policy Options: An Overview - Ronan Lyons, Identify Consulting For: Irish Institutional Property August 2020

Page created by Geraldine Cunningham
 
CONTINUE READING
Ireland's Housing Need & Policy Options: An Overview - Ronan Lyons, Identify Consulting For: Irish Institutional Property August 2020
Ireland’s Housing Need & Policy Options:
An Overview

• Ronan Lyons, Identify Consulting
• For: Irish Institutional Property
• August 2020
Structure

    • Medium-term Need

    • Current Context

    • Policy Options
There are four principal sources of housing demand in any economy –
some of which are more responsive to external conditions than others

• Four principal sources of housing demand
    1. Natural increase: changes in the native-born population, in particular in household-forming
       cohorts – best measured by comparing the 25-34 year-old female cohort with an older
       counterpart (e.g. 65-74 or 75-84 year-olds) – largely exogenous to economic conditions
    2. Net migration: movement of people into the economy – in Ireland, hugely endogenous to
       economic conditions
    3. Change in household size: determines the number of dwellings given a population – long-run
       trends largely exogenous but short-run trends hugely depending on housing supply
    4. Replacement of obsolescent stock: each year, a small fraction of existing housing falls out of
       use – this will be higher in economies with greater internal migration (e.g. urbanisation)
• These cover all tenure types – owner-occupied, private rental and social
• The spread of housing demand within the Irish economy depends on preferences (e.g. urbanisation)
  but also public policy
The first two sources of demand – natural increase and net migration –
currently translate into at least 30,000 homes needed per year

               Estimated housing demand, by source                                                                        • 30,000 homes a year are needed to meet likely
                  (population increase only, 000s)                                                                          population changes alone
60

50
                                                                                                                          • Natural increase peaked in 2010 and will level off
40
                                                                                                                            ~17,000 per year by 2020s

30
                                                                                                                          • Offsetting this is increasingly positive trends in
20
                                                                                                                            migration
10                                                                                                                            • Emigration fell 2010-2014 and each year
                                                                                                                                 since 2015 has seen larger numbers of net
  0
                                                                                                                                 migrants into Ireland
-10                                                                                                                           • Official migration projections are relatively
                                                                                                                                 simplistic, with a baseline case of 30,000 per
-20
                                                                                                                                 year (vs. 34,000 in 2018)
                                                                                                        2020s*

                                                                                                                 2030s*
                                                                                                2019e
       1980s

                1990s

                        2000s

                                2010

                                       2011

                                              2012

                                                     2013

                                                            2014

                                                                   2015

                                                                          2016

                                                                                 2017

                                                                                         2018

                                  Natural increase          Net migration        Total
Source: CSO. Notes: Net natural increase is calculated by the difference between 25-34 and 75-84 female
cohorts; net migration is converted from persons into 2-person households; projections for 2020s and
2030s based on CSO population projections (including average of M1/M2 scenarios for migration)
The natural increase in the population in Ireland is by far the largest
in Europe

                                                    Natural Change, as percentage of 2017 adult population
1.0%
0.8%
0.6%
0.4%
0.2%
0.0%
-0.2%
-0.4%
-0.6%
-0.8%
-1.0%
                             Latvia

                                                                                                 Portugal

                                                                                                                                Spain
                                                            Hungary

                                                                                                                                                  Slovenia

                                                                                                                                                                                                                                                                                      Cyprus
                                                Lithuania
                  Bulgaria

                                                                                                                                                             Poland

                                                                                                                                                                                                                                                       Sweden

                                                                                                                                                                                                                                                                France
                                                                                                                                                                                                                  Netherlands

                                                                                                                                                                                                                                          Malta
                                                                                                                      Estonia
                                                                      Romania

                                                                                         Italy

                                                                                                                                                                      Czech Rep.

                                                                                                                                                                                                                                Denmark

                                                                                                                                                                                                                                                  UK
                                                                                                            Germany

                                                                                                                                        Finland
                                                                                Greece

                                                                                                                                                                                             Slovakia
        Ireland

                                      Croatia

                                                                                                                                                                                                        Belgium
                                                                                                                                                                                   Austria

                                                                                                                                                                                                                                                                         Luxembourg
                                                                                                                                                                                                                                                                                       Source: Eurostat
Net migration has been positive and growing since 2015 – every
extra 10,000 migrants require on average 4,000 new dwellings,
principally in the cities
• Annual gross migration to Ireland between               Immigration (I) and emigration (E), by
  2010 and 2018 more than doubled from
  42,000 to 90,000                                        year and nationality (000s), 2006-2018
                                                  150
    • Emigration fell from 80,000 to 56,000 in
      the same period, resulting in a swing       100
      from net emigration of 27,000 in 2010 to
      net immigration of 34,000 in 2018            50
    • The fall in emigration is driven by fewer
      Irish leaving minus the rise in               0
      immigration by more non-EU nationals
      coming to Ireland                            -50

• Every additional 10,000 migrants require on     -100
  average 4,000 dwellings

                                                         2006

                                                                  2007

                                                                         2008

                                                                                2009

                                                                                       2010

                                                                                              2011

                                                                                                     2012

                                                                                                            2013

                                                                                                                   2014

                                                                                                                          2015

                                                                                                                                  2016

                                                                                                                                           2017

                                                                                                                                                  2018
    • Non-Irish households have a lower
      number of people per HH than the                   Irish (I)                UK (I)                EU15 (I)                 NEU (I)
      average: 2.52 vs. 2.73 in Census 2011              Other (I)                Irish (E)             UK (E)                   EU15 (E)
                                                         NEU (E)                  Other (E)             Net migration

                                                                Source: Census, CSO; “NEU” refers to new (post-2003) EU Member States
Ireland has Western Europe’s largest average household size –
but it has been falling steadily over the last five decades

          Average household size, by country                                                                                                                                                    Average household size in Ireland,
                       (2014)                                                                                                                                                                               by year
3.0                                                                                                                                                                                      4.5

                                                                                                                                                                                         4.0
2.5
                                                                                                                                                                                         3.5
2.0
                                                                                                                                                                                         3.0
1.5
                                                                                                                                                                                         2.5

1.0                                                                                                                                                                                      2.0

0.5                                                                                                                                                                                      1.5

                                                                                                                                                                                         1.0
0.0                                                                                                                                                                  Finland
                                                                                                                               Sweden
                                    Spain
                           Greece

                                                                                                                     Austria
                                                                           UK

                                                                                              France
      Ireland
                Portugal

                                                                                                                                        Norway
                                                                                                       Netherlands
                                                                                Switzerland
                                            Italy

                                                                                                                                                 Denmark
                                                                                                                                                           Germany

                                                                                                                                                                               Average
                                                                 Belgium
                                                    Luxembourg

                                                                                                                                                                                         0.5

                                                                                                                                                                                         0.0
                                                                                                                                                                                               1966 1971 1979 1981 1986 1991 1996 2002 2006 2011

                                                                                                                                                                                                   Source: Hypostat 2016; Census of ireland (various issues)
Two thirds of the growth in Irish households since 1996 has been 1-2
person households, who now form the majority of households in Ireland

                                                         Number of households (000s),
 • The number of Irish households grew by                  by size and Census year
   50% between the 1996 and 2016 Censuses –
                                               1,800
   from 1.1m to 1.7m
                                                                                                    75
                                               1,600
 • Of the 580,000 new households, two thirds
   (390,000) were one or two person            1,400
   households                                  1,200                                               741

     • This represented 80% growth, from       1,000
                                                                120
       0.5m to 0.9m households
                                                800
     • 1-2 person households have increased                     505
       from 44% to 52% of all households in     600
       Ireland                                  400                                                886
                                                                499
 • A further 40,000 new households were         200
   ‘crammer’ households                           0
                                                               1996                               2016
                                                       1-2 persons        3-5 persons          6+ persons

                                                          Source: Census of Ireland (various editions)
Average household size rose between the 2011 and 2016 Censuses – but
this was driven by scarcity rather than demographics

• In the 2016 Census, the average household               Irish households, by type, 2011-2016
  size in Ireland was 2.75, up from 2.73 in 2011   100%

• This was not driven by a baby boom               90%
    • Households with children made up 63%         80%
      of the population in 2011 but just 48%
      of the population growth 2011-2016           70%

    • ‘Crammers’ (households with unrelated        60%                                                  "Crammers"
      parties) made up 15% of the 2011
                                                   50%                                                  With others
      population, but 35% of the 2011-2016
                                                                                                        With children
      growth                                       40%
                                                                                                        No children
• In order to fall to 2.6 – in line with recent    30%
  trends – Ireland would have required an
                                                   20%
  extra 120,000 dwellings
                                                   10%

                                                    0%
                                                           2011 population   2011-2016 growth

                                                                                    Source: Census of Ireland (various editions)
Household growth 2011-2016 was driven by three groups: older
no-children households in rural locations, families in towns, and
‘crammers’ in Dublin
         Change in number of households, by broad type and size, 2011-2016
25,000

20,000

15,000
                                                                                  "Crammers"
10,000
                                                                                  Families
 5,000                                                                            No kids

    0

-5,000
            Dublin        Other Cities     Towns           Rural

                                                              Source: Census of Ireland (various editions)
‘Crammer’ households keep household size high – demographics
imply a true household size in 2016 closer to 2.4, requiring an
additional 217,000 households
                Household size, actual and calculated from demographics, by region
                                 (and implied housing need), 2016
3.00                                                      2.91                       90,000        Average household size,
              2.69                                 2.67                 2.75
                              2.60          2.59                                                   implied by demographics
                                     2.45                        2.44
2.50   2.26            2.22
                                                                                     75,000

2.00                                                                                 60,000        Actual average household
                                                                                                   size (2016 Census)
1.50                                                                                 45,000

1.00                                                                                 30,000
                                                                                                   Estimated dwellings
0.50                                                                                 15,000        required to achieve
                                                                                                   demographic household
0.00                                                                                 0             size (RHS)
       Dublin        Other Cities    Towns         Rural          State

                                                                               Source: Calculations, based on Census of Ireland (various editions)
If Ireland’s average household size converges to the European average, it
will create major demand, especially for homes for smaller households

          Number of extra dwellings required (000s) for a       • Even with a fixed population, a
        population of 4.8m, for different average household       rise in the fraction of 1-2 person
                        sizes (relative to 2.7)                   households creates demand for
                                                                  a significant number of new
 350
                                                                  dwellings
 300
                                                                • Relative to a 2.7 average
 250                                                              household size, a population of
 200                                                              4.8m with an average household
                                                                  size of 2.5 requires 142,000 extra
 150
                                                                  dwellings
 100                                                                 • This is the equivalent of 11
  50                                                                   years construction output at
                                                                       2015 rates
   0
         2.9      2.8     2.7     2.6     2.5     2.4     2.3        • Convergence to EU average
  -50
                                                                       of 2.3 would require an
 -100                                                                  additional 300,000 dwellings
 -150

                                                                                          Source: Author calculations
On demographics, the overall picture is clear: Dublin has a relatively
homogenous housing stock that is ill-suited to meeting the diverse
needs of its residents

 • In total, Dublin is missing roughly 125,000              Households by number of persons and related
   multifamily apartment dwellings                                  dwelling stock (000s), 2016
                                                          1000
     • The Greater Dublin Area is home to ~360k           900
        households of 1-2 persons but has just
                                                          800
        ~230k dwellings of for 1-2 person-                                                                                  418          Other
        households                                        700
                                                          600
     • In contrast, it has a surplus of ~100k family                                                   674
                                                                                    323
        homes, given its population structure             500
                                                                 422
                                                                                                                                         3-5 persons
                                                          400                                                                            /
     • The mismatch is even larger outside GDA:                                                                                          5-9 rooms
        between 250k and 300k units                       300
                                                                                                                            529
                                                          200                                                                            1-2 persons
 • Within multifamily, there is a need at all lifecycle          232
                                                                                    358
                                                                                                       233
                                                                                                                                         /
                                                          100
   stages – from student accommodation to                                                                                                1-4 rooms
   assisted living                                          0

                                                                  Dwellings

                                                                                                       Dwellings
                                                                                    Households

                                                                                                                            Households
     • The largest gap likely relates to housing
       workers, including those moving to Ireland
       from overseas, both long- and short-stay
                                                                              GDA                                  Ex-GDA

                                                                                                 Source: Calculations, based on Census of Ireland
Ireland is a laggard in urbanisation – but as it continues to urbanise,
this will concentrate housing demand in and around its largest cities

• Urbanisation is at the heart of economic growth                              Urbanisation rates, 1960-2016 by
    • Cities allow specialisation (more productive                                        country
      labour) and agglomeration (more productive                              1960-2016 change
                                                        100
      capital and land)                                                       1960 urbanization
                                                        90
    • Density also allows cheaper utilities and a
                                                        80
      wider variety of public/private services
                                                        70
• Since 1960, the fraction of people in high-income     60
  countries living in cities has risen from ~60% to     50
  ~80%                                                  40
    • Ireland is only now at 64%, having been at 46%    30
      in 1960                                           20
    • Over the coming half-century, this is likely to   10
      increase to at least 80%, creating significant     0
      demand for urban housing

                                                                                                                                               Canada
                                                                                                                       Spain
                                                                                                                               OECD

                                                                                                                                                                   Finland
                                                                                                                                                              UK

                                                                                                                                                                                                                                        Japan
                                                                                                     Greece
                                                                                                              France

                                                                                                                                                                                                                              Iceland
                                                              Ireland

                                                                                                                                      Norway
                                                                                   Italy
                                                                        Portugal

                                                                                                                                                                                                                Netherlands
                                                                                                                                                        USA

                                                                                                                                                                                                                                                Belgium
                                                                                                                                                                                                   Luxembourg
                                                                                                                                                                             Denmark
                                                                                                                                                                                       Australia
                                                                                           Germany
                                                                                                                                           Source: World urbanisation Prospects, 2016
Ireland’s labour market is as urbanised as other high-income
   countries – meaning its under-urbanisation reflects inadequate
   housing close to cities

                                       Inequality curves of place of residence and work, Ireland
                    100%
                                                                 (2016)
                        90%            Top 20% of Census districts account for:
       Cumulative total of

                        80%            •   83% of work – in line with
                                           urbanisation rates elsewhere in the
                        70%                high-income world
          population

                                       •   65% of residents – Ireland’s low
                        60%                urbanisation rate
                        50%
                                                                                                                                         Equality
                        40%
                        30%                                                                                                              Residence
                        20%                                                                                                              Work/School
                        10%
                             0%
                                  0%       10%        20%          30%      40%   50%   60%   70%      80%          90%           100%

How to read this chart:                                     Cumulative total of census districts        Most densely populated 20% of
On the horizontal axis, going from 0% up gives the total                                                Census districts (i.e. Irish cities)
fraction of workers or residents in the bottom x% of Census
districts. For example, going to 40% on the horizontal axis, the
bottom 40% of Census districts account for less than 5% of
workers – but almost 10% of residents.
                                                                                                    Source: Calculations, based on Census of Ireland POWSCAR 2016
Related to urbanisation, obsolescence also creates housing need –
with Ireland’s dwellings skewed to older/rural stock, over 10,000
homes are needed each year to keep stock constant

• Almost two thirds of Ireland’s stock of                     Ireland’s Dwelling Stock, by Age
  dwellings is in rural locations                  70%

    • Ireland is experiencing delayed              60%
      urbanisation – one that is being spatially
      skewed by land-use restrictions              50%

• 150,000 households (9%) live in dwellings
                                                   40%
  that are 100+ years old
    • 6.3% of Ireland’s dwellings are buildings    30%
      100+ years old in rural locations
                                                   20%
• If 5% of old urban stock and 10% of old rural
  stock falls obsolete annually, ~13,000 to        10%
  “stand still”
                                                   0%
                                                                     Urban                             Rural

                                                         Pre-1919     1919-1945   1946-1960   1961-1970   1971-1980
                                                         1981-1990    1991-2000   2001-2005   2006+       NS

                                                                                              Source: Census; “NS” = Not Stated
For 2020-2025, demand for housing nationwide is likely to be
47,000 per year – compared to a target of 25,000 per year in
Ireland 2040
                                                                                   • Available evidence suggests underlying
Source                                State                  GDA                     housing demand of 47,000 homes per year
                                                                                       • This covers all elements of demand,
Obsolescence                          8,000                 2,500                        including owner-occupied, rental and
                                                                                         social housing
Headship                             12,500                 5,000                  • While 25%+ social is common in many
                                                                                     countries, it seems unlikely that more than
Natural Increase                     18,500                 7,400                    10% of new construction will be social
                                                                                       • Major policy reforms, e.g. implementing
Net Migration                         8,000                 3,200                        cost-rental, could change this
                                                                                   • Of the remainder, current trends suggest
Total                                47,000                18,100                    that ~60% (28,000) are needed for owner-
                                                                                     occupancy, with the other 30% (14,000) for
                                                                                     rental
 Rounded estimates of new units required in Ireland and
      in Greater Dublin area, per year, 2020-2025
Assumptions: 0.4% obsolescence, a fall in household size to 2.5 by 2035, and
natural increase (as defined by 25/34-75/84 cohort difference) of 18,000 and net
migration averaging 20,000 per year (in 2.5 person households due to dwelling
mix)
Structure

   • Medium-term Need

   • Current Context

   • Policy Options
After roughly six years of strong inflation, sale prices in Ireland have now
stabilised, having risen by >50% but remaining ~30% below 2007 peak levels

           Average sale price, by market                                                National sale price inflation
€500,000                                                        8%                                                                                                                                           20%
                                                                                                  Quarterly
€450,000
                                                                6%                                                                                                                                           15%
                                                                                                  Annual
€400,000
                                                                4%                                                                                                                                           10%
€350,000

€300,000                                                        2%                                                                                                                                           5%
€250,000
                                                                0%                                                                                                                                           0%
€200,000

€150,000                                                        -2%                                                                                                                                          -5%

€100,000                                                        -4%                                                                                                                                          -10%
 €50,000
                                                                -6%                                                                                                                                          -15%
     €0
      2006q1 2008q1 2010q1 2012q1 2014q1 2016q1 2018q1 2020q1
                                                                -8%                                                                                                                                          -20%

                                                                      2006q2
                                                                               2007q2
                                                                                        2008q2
                                                                                                 2009q2
                                                                                                          2010q2
                                                                                                                   2011q2
                                                                                                                            2012q2
                                                                                                                                     2013q2
                                                                                                                                              2014q2
                                                                                                                                                       2015q2
                                                                                                                                                                2016q2
                                                                                                                                                                         2017q2
                                                                                                                                                                                  2018q2
                                                                                                                                                                                           2019q2
                                                                                                                                                                                                    2020q2
     National            Dublin              Other cities
     Leinster            Munster             Connacht-Ulster

                                                                                                                                                                  Source: Analysis of Daft.ie Report
The ending of sale price inflation comes as the stock and flow of
properties available has increased significantly in recent quarters

                                                                                                                                  Flow of sale listings during quarter,
                       Stock available to sell, by region
                                                                                                                                         by market, since 2007
20000                                                                                                     8000   35,000
18000                                                                                                                                                                                       Rest of Country
                                                                                                          7000
                                                                                                                 30,000
16000
                                                                                                          6000                                                                              Rest of Leinster
14000                                                                                                            25,000
                                                                                                          5000                                                                              Dublin
12000
10000                                                                                                     4000
                                                                                                                 20,000

 8000                                                                                                     3000   15,000
 6000
                                                                                                          2000   10,000
 4000
 2000                                                                                                     1000
                                                                                                                  5,000
    0                                                                                                     0
                                                                                                                     0
        2007

               2008

                      2009

                             2010

                                    2011

                                           2012

                                                  2013

                                                         2014

                                                                2015

                                                                       2016

                                                                              2017

                                                                                     2018

                                                                                            2019

                                                                                                   2020

                                                                                                                          2007
                                                                                                                                 2008
                                                                                                                                        2009
                                                                                                                                               2010
                                                                                                                                                      2011
                                                                                                                                                             2012
                                                                                                                                                                    2013
                                                                                                                                                                           2014
                                                                                                                                                                                  2015
                                                                                                                                                                                         2016
                                                                                                                                                                                                2017
                                                                                                                                                                                                       2018
                                                                                                                                                                                                              2019
                                                                                                                                                                                                                     2020
                      Leinster                    Munster                 Conn-U
                      Dublin (RHS)                Other (RHS)

                                                                                                                                                                             Source: Analysis of Daft.ie Report
Rent inflation has slowed in 2019, but rents have risen for 29 consecutive
quarters, nearly doubling in total and 35% higher than the previous peak

           Average monthly rental price, by
                      market                                                    National rental price inflation
                                                              8%                                                                                                                                           20%
€2,500
                                                                                                Quarterly
                                                              6%                                                                                                                                           15%
                                                                                                Annual
€2,000
                                                              4%                                                                                                                                           10%

€1,500                                                        2%                                                                                                                                           5%

€1,000                                                        0%                                                                                                                                           0%

                                                              -2%                                                                                                                                          -5%
 €500
                                                              -4%                                                                                                                                          -10%

   €0
                                                              -6%                                                                                                                                          -15%
    2006q1 2008q1 2010q1 2012q1 2014q1 2016q1 2018q1 2020q1

         National       Dublin              Other cities      -8%                                                                                                                                          -20%

                                                                    2006q2
                                                                             2007q2
                                                                                      2008q2
                                                                                               2009q2
                                                                                                        2010q2
                                                                                                                 2011q2
                                                                                                                          2012q2
                                                                                                                                   2013q2
                                                                                                                                            2014q2
                                                                                                                                                     2015q2
                                                                                                                                                              2016q2
                                                                                                                                                                       2017q2
                                                                                                                                                                                2018q2
                                                                                                                                                                                         2019q2
                                                                                                                                                                                                  2020q2
         Leinster       Munster             Connacht-Ulster

                                                                                                                                                     Source: Analysis of Daft.ie Report
In the private rental market, availability remains at extremely
low levels

                                                                                                                                Flow of rental listings during quarter,
                     Stock available to rent, by region
                                                                                                                                        by market, since 2007
4500                                                                                                     9000   50,000
                                                                                                                                                                                           Rest of Country
4000                                                                                                     8000   45,000
                                                                                                                                                                                           Rest of Leinster
3500                                                                                                     7000   40,000
                                                                                                                                                                                           Dublin
3000                                                                                                     6000   35,000

2500                                                                                                     5000   30,000

2000                                                                                                     4000   25,000

                                                                                                                20,000
1500                                                                                                     3000
                                                                                                                15,000
1000                                                                                                     2000
                                                                                                                10,000
500                                                                                                      1000
                                                                                                                 5,000
  0                                                                                                      0
                                                                                                                    0
       2007

              2008

                     2009

                            2010

                                   2011

                                          2012

                                                 2013

                                                        2014

                                                               2015

                                                                      2016

                                                                             2017

                                                                                    2018

                                                                                           2019

                                                                                                  2020

                                                                                                                         2007

                                                                                                                                2008

                                                                                                                                       2009

                                                                                                                                              2010

                                                                                                                                                     2011

                                                                                                                                                            2012

                                                                                                                                                                   2013

                                                                                                                                                                          2014

                                                                                                                                                                                 2015

                                                                                                                                                                                        2016

                                                                                                                                                                                               2017

                                                                                                                                                                                                      2018

                                                                                                                                                                                                             2019

                                                                                                                                                                                                                    2020
          Munster                           Conn-U                            Dublin (RHS)
          Other                             Leinster (RHS)

                                                                                                                                                                                  Source: Analysis of Daft.ie Report
The overwhelming evidence from both sale and rental markets
                                 in Dublin is that availability is the key determinant of subsequent
                                 price changes: supply matters

                                               Scatterplot of Dublin sale listings                                                              Scatterplot of Dublin rental listings
                                                 and quarterly changes in sale                                                                    and quarterly changes in rents,
                                                       prices, 2006-2019 y = -0%x + 11%                                                                      2006-2019       y = -0%x + 7%
                                                                                         R² = 76%
                                         10%                                                                                                   10%                                          R² = 59%
Quarterly change in Dublin sale prices

                                                                                                            Quarterly change in Dublin rents
                                         8%                                                                                                    8%
                                         6%                                                                                                    6%
                                         4%                                                                                                    4%
                                         2%                                                                                                    2%
                                         0%                                                                                                    0%
                                         -2%                                                                                                   -2%
                                         -4%                                                                                                   -4%
                                         -6%                                                                                                   -6%
                                         -8%                                                                                                   -8%
                                            1500          3000          4500         6000            7500                                         1500       3000          4500         6000             7500
                                                   Stock on Dublin sale market, 1st day of quarter                                                   Stock on Dublin rental market, 1st day of quarter

                                                                                                                                                                          Source: Analysis of Daft.ie Report
But since the crash, supply (of all forms) has been inadequate – and recent
improvements still fall short of underlying demand (47,000 per year)

                                              New dwellings commenced, by local authority and month
5000                                                                                                                                                                                       5000
4500                                                                                                                                                                                       4500   Estimated
4000                                                                                                                                                                                       4000    monthly
3500                                                                                                                                                                                       3500
                                                                                                                                                                                                   demand
3000                                                                                                                                                                                       3000
                                                                                                                                                                                                     Ex-GDA
2500                                                                                                                                                                                       2500
                                                                                                                                                                                                     GDA
2000                                                                                                                                                                                       2000
                                                                                                                                                                                                     Demand (40k)
1500                                                                                                                                                                                       1500      Demand (50k)
1000                                                                                                                                                                                       1000
 500                                                                                                                                                                                       500
   0                                                                                                                                                                                       0
                        2015III

                                                            2016III

                                                                                                2017III

                                                                                                                                    2018III

                                                                                                                                                                        2019III
                                  2015IV

                                                                      2016IV

                                                                                                          2017IV

                                                                                                                                              2018IV

                                                                                                                                                                                  2019IV
       2015I

                                           2016I

                                                                               2017I

                                                                                                                   2018I

                                                                                                                                                       2019I
               2015II

                                                   2016II

                                                                                       2017II

                                                                                                                           2018II

                                                                                                                                                               2019II
                                                                                                                                                 Source: Analysis of Census, CSO and Department of Housing figures
Ireland’s housing is out of line not only with its own demographics, but
also compared to all other European countries, where typically 50% of
dwellings are apartments

                           Fraction of dwellings in apartments
        Italy
       Spain
Switzerland
     Iceland
    Finland
  Germany
     Austria
    Sweden
          UK
     Greece
      France
   Portugal
  Denmark
    Norway
   Belgium
Netherlands
     Ireland

                0%   10%     20%         30%        40%          50%   60%   70%
Significantly higher gross yields on homes for smaller households
highlight the concentration of future demand in 1 or 2 bedroom homes

              Average gross yield for residential real estate, mid-2019, by property size and location
14%

12%

10%

8%

6%                                                                                                                                   1-bed
                                                                                                                                     2-bed
4%
                                                                                                                                     3-bed
2%                                                                                                                                   4-bed
0%
          Tipperary

            Wicklow
           Donegal

           Dublin 5
           Dublin 9

           Dublin 7
           Dublin 8

           Dublin 1

           Dublin 3

         Dublin 6W
           Dublin 2

           Dublin 6
           Dublin 4
         Monaghan

      Waterford City

         North Dub

         South Dub
              Offaly

          Dublin 17

          Dublin 22
          Dublin 10
          Dublin 24

          Dublin 11

          Dublin 15
          Dublin 12
          Dublin 20

          Dublin 13

          Dublin 16

          Dublin 18

          Dublin 14
            Cork Co
          Longford

         Galway Co

               Clare
               Kerry

       Limerick City

             Kildare

          West Dub
        Westmeath
             Leitrim

           Wexford
               Laois

           Kilkenny

        Galway City
              Louth
       Waterford Co

              Meath
             Carlow
       Roscommon

              Cavan
                Sligo

           Cork City
              Mayo

        Limerick Co

  Source: Analysis of Daft.ie Report; Markets are sorted from left to right by the 2019Q2 price of a 3-bed semi-detached property
  Note: gross yield calculated as the annual rent divided by the capital value, for particular property type-location combinations
Little evidence that Dublin’s population share is too big –
smaller populations mean bigger share in largest city

                Share of population in largest city, European countries (n=42)
    100%                                                                             y = -144%ln(x) + 423%
                  Malta                                                                     R² = 60%
                                              Norway
     80%
                                                       Denmark
                     Luxembourg        Ireland (Rep)
     60%                                                    Finland
                                                                 Ireland (Island)
     40%                                                                                 Germany,
                                                                                         Turkey

     20%

     0%
           12       13            14       15               16              17      18              19        20
                  13 = 0.4m                     Population in logs                        19 =178m

                                         Source: Author calculations, based on jakubmarian.com, Wikipedia/CIA World Factbook
In fact, Dublin has gone from largest importer to largest exporter
  of people within Ireland – with consequences for commuting and
  quality of life

       Net difference between population by county                              Fraction of commuters with a ‘long
          of birth and county of residence (000s)                                   commute’ by distance/time
                                                                      50%
250
                                                                      45%
200
                                                                      40%
150

100                                                                   35%                                                     % travelling
                                                                                                                              16km or more
 50                                                                   30%

                                                                      25%                                                     % travelling 30
  0
                                                                                                                              minutes or
 -50                                                                  20%                                                     more

-100                                                                  15%

-150                                                                  10%
                     1996      2002     2006    2011     2016
-200                                                                   5%
         Dublin   Kildare, Meath    Rest of    Munster    Connacht-
                                                                       0%
                     & Wicklow     Leinster                 Ulster
                                                                             1981 1986 1991 1996 2002 2006 2011 2016

                                                                      Source: Author calculations, based on various issues of the Irish census
The location of new housing supply has been inadequate, with the
emergence of a 100% Dublin housing price premium in recent decades

                      Dublin/Rural Ireland housing price premium
120%

100%

80%

60%

40%

20%

 0%
       1970
       1971
       1972
       1973
       1974
       1975
       1976
       1977
       1978
       1979
       1980
       1981
       1982
       1983
       1984
       1985
       1986
       1987
       1988
       1989
       1990
       1991
       1992
       1993
       1994
       1995
       1996
       1997
       1998
       1999
       2000
       2001
       2002
       2003
       2004
       2005
       2006
       2007
       2008
       2009
       2010
       2011
       2012
       2013
       2014
       2015
       2016
       2017
       2018
       2019
       2020
               Unweighted average       New to 2nd hand          Listings (adjusted)       Rents (adjusted)

                              Source: Author calculations, based on Department of Housing statistics (1970-2005) and Daft.ie Report (2006-2019)
And the mix of new housing supply has been inadequate, with the new
homes built increasingly out of sync with Ireland’s household structure

         Number of households (000s),                                New dwellings completed in
           by size and Census year                                 Ireland, 1996-2015 (thousands)
2,000
                                          63
1,800
1,600                       75                                                               125                 675k smaller
                                          680                                   228                             homes needed,
1,400
                           741
                                                                                                                175k delivered
1,200
            120                                                                                     215               vs.
1,000                                                                                                             175k larger
  800       505                                                                                                 homes needed,
                                                                                 237
  600                                    1171                                                 53                675k delivered
  400                      886
  200       499
    0                                                              Urban/GDA apts             Urban/GDA houses
            1996          2016          2016*                      Rural apts                 Rural one-offs

        1-2 persons   3-5 persons   6+ persons                     Other rural

                                                 Source: Author calculations, based on CSO Census and Dept of Environment/Housing statistics
In recent years, affordability has deteriorated, with rent and sale prices
 rising faster than incomes.

                                          Average rent to average income                                                                                                                                                  Average FTB house price to average income
40%                                                                                                                                                                                                                  10
                                                                                                                                                                                                                      9
35%
                                                                                                                                                                                                                      8
30%
                                                                                                                                                                                                                      7
25%
                                                                                                                                                                                                                      6
20%                                                                                                                                                                                                                   5

15%                                                                                                                                                                                                                   4
                                                                                                                                                                                                                      3
10%
                                                                                                                                        3-bedroom house in West Dublin, two                                           2
5%                                                                                                                                      incomes
                                                                                                                                                                                                                      1
                                                                                                                                        Double-room in Dublin, one income
0%                                                                                                                                                                                                                    0
      1997Q1
               1998Q1
                        1999Q1
                                 2000Q1
                                          2001Q1
                                                   2002Q1
                                                            2003Q1
                                                                     2004Q1
                                                                              2005Q1
                                                                                       2006Q1
                                                                                                2007Q1
                                                                                                         2008Q1
                                                                                                                  2009Q1
                                                                                                                           2010Q1
                                                                                                                                    2011Q1
                                                                                                                                             2012Q1
                                                                                                                                                      2013Q1
                                                                                                                                                               2014Q1
                                                                                                                                                                        2015Q1
                                                                                                                                                                                 2016Q1
                                                                                                                                                                                          2017Q1
                                                                                                                                                                                                   2018Q1
                                                                                                                                                                                                            2019Q1

                                                                                                                                                                                                                          1997Q1
                                                                                                                                                                                                                          1997Q4
                                                                                                                                                                                                                          1998Q3
                                                                                                                                                                                                                          1999Q2
                                                                                                                                                                                                                          2000Q1
                                                                                                                                                                                                                          2000Q4
                                                                                                                                                                                                                          2001Q3
                                                                                                                                                                                                                          2002Q2
                                                                                                                                                                                                                          2003Q1
                                                                                                                                                                                                                          2003Q4
                                                                                                                                                                                                                          2004Q3
                                                                                                                                                                                                                          2005Q2
                                                                                                                                                                                                                          2006Q1
                                                                                                                                                                                                                          2006Q4
                                                                                                                                                                                                                          2007Q3
                                                                                                                                                                                                                          2008Q2
                                                                                                                                                                                                                          2009Q1
                                                                                                                                                                                                                          2009Q4
                                                                                                                                                                                                                          2010Q3
                                                                                                                                                                                                                          2011Q2
                                                                                                                                                                                                                          2012Q1
                                                                                                                                                                                                                          2012Q4
                                                                                                                                                                                                                          2013Q3
                                                                                                                                                                                                                          2014Q2
                                                                                                                                                                                                                          2015Q1
                                                                                                                                                                                                                          2015Q4
                                                                                                                                                                                                                          2016Q3
                                                                                                                                                                                                                          2017Q2
                                                                                                                                                                                                                          2018Q1
                                                                                                                                                                                                                          2018Q4
                                                                                                                                                                                                                          2019Q3
                                                                                                                                                                                                                                     Source: Analysis of CSO, OECD, PTSB and Daft.ie figures
However, supply is determined by viability, not affordability – and
viability is extremely challenging for apartments in Ireland

  • For apartments in Dublin, construction costs are

    €225,000 per unit excluding site costs and land

  • Costs rise to over €300,000 when legal, planning

    and finance costs are included (details are shown

    on the graphic)

  • The addition of land, VAT, levies and equity sees the

    final cost rise to over €460,000

                             Source: Dublin Residential Cost Benchmark (2020) by Linesight construction consultants for IIP   32
One of the main reasons supply of new apartments has been so weak is
that total construction costs in Ireland are high by international
standards
            Listed cost, per m2 of internal space, of building mid-rise, medium-spec
                                  apartments, by city and year
€3,000

€2,500

€2,000

€1,500

€1,000

 €500

   €0
         2015             2016           2017               2018                2019                     2020e               2021f

                Toronto     Munich   Dublin     Amsterdam          Warsaw       Madrid         Belfast           Edinburgh

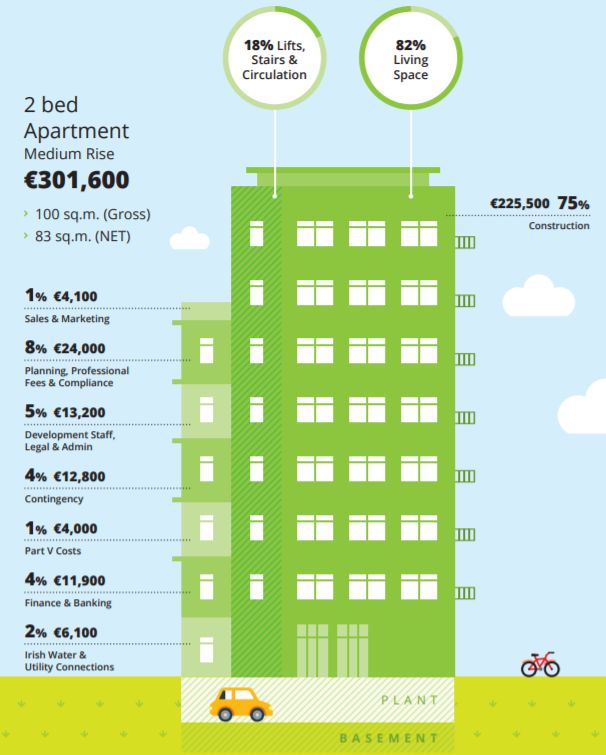
                                                        Source: Analysis of Turner & Townsend International Construction Market Survey, various issues
Build costs for suburban homes (excluding land, government tax and
developer’s profit) are between €2,100 and €3,000 approx. per square
metre. Apartments are more expensive to build than houses.

                                         Build cost per m2 of suburban housing, by type in 2020 Q1
                                                                                                                                                                   Construction

                                                                                                                                                                   Sales and marketing

Suburban apartment                                                                                                                                                 Planning, professional fees,
                                                                                                                                                                   compliance
                                                                                                                                                                   Development staff, legal
                                                                                                                                                                   and administration
                                                                                                                                                                   Contingency

                                                                                                                                                                   Part V costs
Suburban townhouse
                                                                                                                                                                   Finance and banking

                                                                                                                                                                   Irish Water and utility
                                                                                                                                                                   connections
                            €0             €500           €1,000          €1,500          €2,000          €2,500          €3,000           €3,500

Source and notes: Figures based on analysis provided by Linesight to IIP for dwellings with 100m2 gross floor area (83m2 nett floor area for apartment dwelling types).
Figures exclude site acquisition costs, cost of equity capital/profit, and tax, as well as costs relating to any abnormal ground conditions or contamination.
For City Centre / Complex Build cost may be up to 20-40% higher depending on site conditions, height, specification and the like. Other assumptions available on request.
Looking ahead, permissions data suggest that new estate houses will
continue to come on to the market in 2020 and 2021 and, from 2021,
apartments too. But level of supply far behind projected demand.
        Dwellings completed and units granted                                                                                Pipeline of new apartments (as of
      permission (lagged), by quarter and type of                                                                                         mid-2019)
5,000                  housing
                                                                                                                    14,000

4,000                                                                                                               12,000

3,000                                                                                                               10,000

2,000                                                                                                                8,000

                                                                                                                     6,000
1,000
                                                                                                                     4,000
   0
                                                                                                                     2,000
        2011Q1

                 2012Q1

                          2013Q1

                                   2014Q1

                                            2015Q1

                                                     2016Q1

                                                              2017Q1

                                                                       2018Q1

                                                                                2019Q1

                                                                                         2020Q1

                                                                                                  2021Q1

                                                                                                           2022Q1
                                                                                                                         0
        Completions - one-off                                   Completions - estate                                          Dublin City    South Dublin     North Dublin       Cork

        Completions - apartments                                Planning - one-off (+2Q)                                            Under construction      Planning consented

        Planning - estate (+6Q)                                 Planning - apartments (10-12Q)                                      Planning submitted      Pre-planning

    Level of supply far behind projected demand                                                                       Source: Analysis of CSO and Department of Housing figures; LIV Consulting
Structure

• Medium-term Need

• Current Context

• Policy Options
Ireland has a persistent underlying medium-term need for significant
additional housing – 47,000 units per year, concentrated in smaller
urban homes
• To recap, there are four main sources of housing demand
    • Two relate to a growing population - natural increase and net migration
    • The other two are household size and obsolescence
    • The four sources combine to create a new for 47,000 new housing units per year
    • The bulk of new homes needed are:
        (1) for smaller households and
        (2) are concentrated in and near the main cities

• There are three main segments in the housing system: owner-occupied, private rental and social
  housing
    • The owner-occupied sector looks largely in balance, with a significant increase in construction since
      2015 meaning that supply appears to be meeting demand
    • The other sectors, however, still look chronically under-supplied and account for the majority of the
      ~25,000-unit shortfall between completions and underlying need
Higher up-front costs for smaller homes in or near cities mean there
is a tension between viability (sale/rental prices exceeding costs) and
affordability (prices being in line with incomes)

• Construction costs in Ireland are very high, compared both to average local incomes and to costs in
  other jurisdictions
    • The latest evidence is that, for a 2-bed apartment in Dublin’s outer city / suburbs, all-in build
      costs are approximately €300,000 for a 83m2 home
    • If it is a city centre / complex build, the same 2-bed apartment could cost up to 20-40% higher
      depending on site conditions, height, specification and the like
• Without public subsidy, these costs are borne by the ultimate occupants in the sale or rental price
• In other words, high construction costs present a challenge between viability and affordability
    • The higher costs are, the less affordable new homes will be
    • The higher costs are, the higher the break-even rent denoting viability
• Very high construction costs require urgent addressing by policymakers – but, even with political
  will, it is unlikely to be fixed within 3-5 years
    • ‘Soft costs’ of construction – including taxes – may be easier to change quickly than ‘hard costs’,
        such as labour and materials
The importance of financial and environmental sustainability places
significant constraints on government policies to boost housing supply

• The Celtic Tiger bubble/crash episode provides a stark warning about the potential consequences of
  getting around high construction costs through increasing leverage
    • The typical deposit paid by a first-time buyer fell from 25% in 2000 to less than 5% by 2006 –
       with a dramatic increase in the ratio of mortgage credit to household income
    • The subsequent dramatic rise and fall in property prices has led to the adoption of Central Bank
       rules that limit the leverage individual households can take on for property purchase
• At the same time, the move towards energy self-sufficiency to address the climate challenge affects
  the potential to reduce build costs
    • Nearly Zero Energy Building (NZEB) standards impose up-front costs for significant future
       benefits
    • This creates a capital market policy puzzle: if the amount of debt an individual household can
       taken on is capped, how will investment take place in assets with high social returns, such as
       NZEB?
In the context of high costs, rent controls would have serious negative
consequences for new supply – a cost-rental approach is
recommended instead for alleviating this burden

 • Ireland’s housing context over coming decades will be defined by the climate challenge, demographic
   change, and the drive towards greener, denser living
 • Private rental and social rental will be central modes of tenure in meeting Ireland’s substantial housing
   needs over coming decades
     • Those housing needs will also be increasingly differentiated over the life-cycle, from purpose-built
       student and co-living accommodation for younger households to independent and assisted living
       complexes for older households
 • Given high costs, controls on rent levels for newly built homes will significantly exacerbate the shortage
   of non-owner-occupier housing
 • Policy should instead focus on cost-rental schemes. (Cost rental is a mechanism whereby rent covers
   the cost of construction and long-term maintenance only. Building on state land can further reduce the
   cost).
 • If home ownership remains a policy priority, then Shared Equity and Shared Ownership housing
   schemes are also open to policymakers
Where home-ownership is a policy priority, two further policy options
are Shared Equity Housing and Shared Ownership Housing
Ireland’s Housing Need & Policy Options: Conclusion

• This report has examined Ireland’s housing need and the policy options available to meet that need
• The composition of housing need in the medium-term will likely be driven by three factors:
  (i) falling household size (ii) urbanisation and (iii) environment sustainability
• All three factors imply a need for much greater diversity of housing options, especially for smaller
  households in and close to Ireland’s major cities
• The current context is one of strong demand and, with the exception of owner-occupied housing for
  larger households, continuing weak supply
• The lack of responsiveness of new supply is ultimately a product of high construction costs, with
  viability (the price-cost ratio) well above normal levels of affordability (the price-income ratio) for most
  households and areas
• In addition to reducing costs, policy options include cost-rental, shared ownership and shared equity
  schemes
You can also read