COVID-19 Vaccination Mandates and Vaccine Uptake - Research Square
←
→
Page content transcription
If your browser does not render page correctly, please read the page content below
COVID-19 Vaccination Mandates and Vaccine Uptake Alexander Karaivanov ( akaraiva@sfu.ca ) Simon Fraser University https://orcid.org/0000-0002-5184-3126 Dongwoo Kim Simon Fraser University Shih En Lu Simon Fraser University Hitoshi Shigeoka University of Tokyo https://orcid.org/0000-0002-7007-1619 Article Keywords: COVID-19, vaccine mandates, proof of vaccination, vaccine uptake, vaccine hesitancy, difference-in-differences, time-series analysis, counterfactuals Posted Date: January 28th, 2022 DOI: https://doi.org/10.21203/rs.3.rs-1146923/v3 License: This work is licensed under a Creative Commons Attribution 4.0 International License. Read Full License Version of Record: A version of this preprint was published at Nature Human Behaviour on June 2nd, 2022. See the published version at https://doi.org/10.1038/s41562-022-01363-1.
COVID-19 Vaccination Mandates and Vaccine Uptake
Alexander Karaivanov§∗ , Dongwoo Kim§ , Shih En Lu§ , Hitoshi Shigeoka§†∗
                       §
                        Department of Economics, Simon Fraser University
           †
               Graduate School of Public Policy, University of Tokyo, IZA, and NBER

                                         January 10, 2022

                                               Abstract

           We evaluate the impact of government-mandated proof of vaccination requirements
       for access to public venues and non-essential businesses on COVID-19 vaccine uptake.
       We find that the announcement of a mandate is associated with a rapid and significant
       surge in new vaccinations (more than 60% increase in weekly first doses), using the
       variation in the timing of these measures across Canadian provinces in a difference-in-
       differences approach. Time-series analysis for each province and for France, Italy and
       Germany corroborates this finding. Counterfactual simulations using our estimates
       suggest the following cumulative gains in the vaccination rate among the eligible pop-
       ulation (age 12 and over) as of October 31, 2021: up to 5 percentage points (p.p.)
       (90% CI 3.9–5.8) for Canadian provinces, adding up to 979,000 (425,000-1,266,000)
       first doses in total for Canada (5 to 13 weeks after the provincial mandate announce-
       ments), 8 p.p. (4.3–11) for France (16 weeks post-announcement), 12 p.p. (5–15) for
       Italy (14 weeks post-announcement) and 4.7 p.p. (4.1–5.1) for Germany (11 weeks
       post-announcement).

       Keywords: COVID-19, vaccine mandates, proof of vaccination, vaccine uptake,
       vaccine hesitancy, difference-in-differences, time-series analysis, counterfactuals

       JEL codes: I18, I12, C23

  ∗
      Corresponding authors: H. Shigeoka, hitoshi shigeoka@sfu.ca; A. Karaivanov, akaraiva@sfu.ca.

                                                    1
1 Introduction
Immunization with mRNA or adenoviral vaccines has proven very effective for reducing the
spread and severity of COVID-19, with vaccinated people benefiting from a large reduction
in the risk of severe outcomes.1 Yet, following a quick-paced uptake in early 2021, COVID-19
immunization rates in many countries slowed down significantly, at about 60% of the popu-
lation, during the summer despite the vaccines’ proven benefits (see Fig. B1). In addition,
most countries or regions, even those with high vaccination rates, experienced increased vi-
ral transmission or had to maintain or re-introduce non-pharmaceutical interventions such
as mask-wearing mandates or indoor capacity limits in fall 2021 because of the elevated
reproduction rate of the Delta variant.2
A further increase in vaccination rates therefore remains essential for reducing the health
and economic impacts of COVID-19 and allowing the eventual lifting of restrictions. More-
over, the administration of booster doses or vaccines with updated formulations may be
necessary in the face of new variants. Public health authorities all over the world have ac-
tively sought the most effective strategies to increase vaccine uptake and provide incentives
for hesitant, procrastinating or other people who have had the opportunity to be immunized
for a prolonged time but have not taken it up.
In response to this challenge, many local or national governments have recently introduced
proof of vaccination mandates, which allow only vaccinated persons to attend non-essential
sports or social activities, events and settings such as concerts, stadiums, museums, restau-
rants, bars, etc.3 Some mandates accept a recent negative COVID test or past positive
test as a substitute of vaccination or allow businesses to opt out if they abide by additional
restrictions.4 The goal of these policies is twofold: to provide incentives for immunization
and to reduce viral transmission in risky indoor or crowded settings.5
We evaluate and quantify the effect of proof of vaccination mandates on first-dose vaccine
uptake in the ten Canadian provinces and three European countries (France, Italy and
1
Scobie et al. (2021), Grannis et al. (2021), Andrews et al. (2021) and Gupta et al. (2021).
2
For example, by early August, all four of Canada’s Western provinces had removed their mask-wearing
mandates for public indoor spaces. By mid-September, all re-imposed a mask mandate, either preemptively
or after a COVID surge. The largest provinces Ontario and Quebec did not remove their mask mandates.
3
While the mandates are sometimes colloquially called “vaccine passports”, we deliberately avoid this
politicized term.
4
Among the jurisdictions considered in this study, the mandates in France, Italy, Germany, Alberta and
Saskatchewan allowed such options during the analyzed period – see the notes to Table C5 for details.
5
Several countries have also planned or implemented vaccination mandates for employees (USA for all
firms with more than 100 employees, Italy for all employees, Canada for all federal employees), and a broader
mandate is under consideration in Austria. We do not analyze these alternative mandates.
2Germany) that announced and implemented such mandates in the period July–October,
2021. This is a period without binding vaccine supply or access constraints and with a
high base first-dose vaccination rate (above 60% of those eligible in the three countries and
above 80% in Canada, at the time of the mandate announcements). Hence, we evaluate the
mandates’ impact on people, such as the vaccine hesitant, that have remained unvaccinated
for weeks or months after immunization became available to them.
While requiring proof of vaccination is expected to raise vaccine uptake, the magnitude
and speed of the increase are hard to predict: they depend on the relative importance of the
factors leading to delay or hesitancy, e.g., lack of social or economic incentives, misinforma-
tion, or entrenched political or religious beliefs. We use first doses as the main outcome in
our statistical analysis because they most directly reflect the decision to be immunized.6
The Canadian provincial data is key for our identification strategy as it allows us to
use the time variation in mandate announcement dates (from August 5, 2021 in Quebec to
September 21, 2021 in Prince Edward Island) across different geographic units in the same
country, via a difference-in-differences (DID) approach.7 In contrast, the French, Italian
or German mandates, or the announced U.S. vaccine mandate for employees, apply at the
national level, which makes it more challenging to separate the effect of the mandate from
that of time trends or other concurrent events or policies.
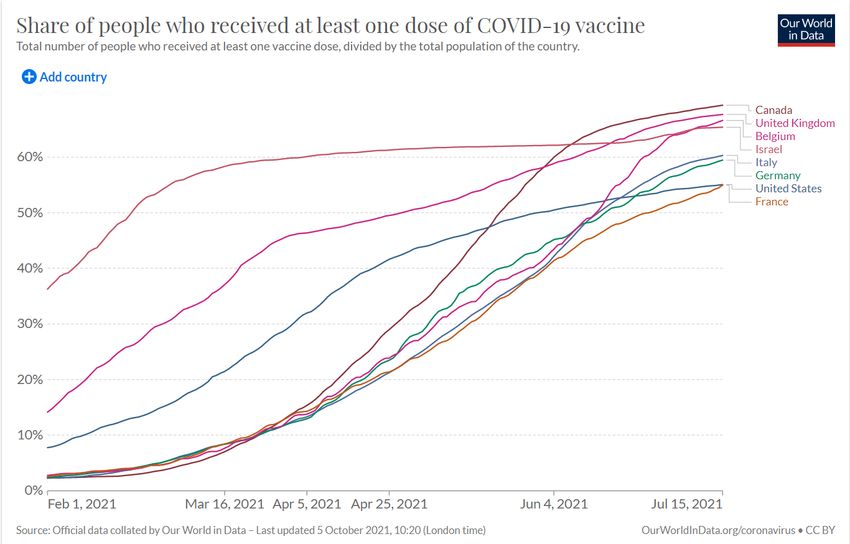
Fig. 1 plots the weekly vaccine first doses administered in the four most populous Cana-
dian provinces and four European countries. All except Spain had introduced a province-wide
or country-wide proof of vaccination mandate in the studied period. We observe a sizable
boost in vaccine uptake within two weeks after the mandate announcement date (the dashed
vertical line) in all four provinces and in France, Italy and Germany, often following a sharp
decline in the pre-announcement weeks. In France, daily first-dose appointments data also
shows a striking surge on the day after the mandate announcement (see Fig. B2). In contrast,
Spain exhibits a steady decrease in weekly first doses over the displayed period.
Motivated by this evidence, we aim to answer two important policy-relevant questions.
First, what is the magnitude of the increase in the pace of first dose vaccinations after a
proof of vaccination mandate announcement? Second, how long do these gains persist and
6
To avoid potential bias from constrained vaccine supply affecting the pre- or post-mandate pace of
vaccination, we use only data after June 15, 2021, when it is safe to assume that any age-eligible person (12
or older in Canada) was able to receive a first dose of COVID-19 vaccine with minimal delay; see Table C2.
7
In Canada, the provinces are separate public health jurisdictions with extensive powers over health policy
while the vaccines are procured by the federal government and allocated to the provinces in proportion to
their population. All COVID-19 vaccines used in Canada during the study period, namely BNT162b2 (Pfizer
/BioNTech Comirnaty), mRNA-1273 (Moderna SpikeVax) and AZD1222 (Oxford–AstraZeneca Vaxzevria),
were originally considered two-dose vaccines.
3Figure 1: Vaccination mandates and first dose uptake
Selected Canadian provinces
Quebec British Columbia Ontario Alberta
60
60
150
weekly first doses, '000
80
weekly first doses, '000
weekly first doses, '000
weekly first doses, '000
50
50
100 60
40
40
30 30 40
50
20 20 20
15 ul
31 ul
15 Jul
31 ug
15 ug
30 ep
15 ep
31 ct
ct
15 ul
31 ul
15 Jul
31 ug
15 ug
30 ep
15 ep
15 ul
31 ul
15 Jul
31 ug
15 ug
30 ep
15 ep
31 ct
ct
31 ct
ct
15 ul
31 ul
15 Jul
31 ug
15 ug
30 ep
15 ep
31 ct
ct
-J
-J
-O
-O
-J
-J
-J
-J
-O
-O
-O
-O
-A
-A
-S
-S
-J
-J
-O
-O
-
-A
-A
-S
-S
-A
-A
-S
-S
-
-
-A
-A
-S
-S
01
-
01
01
01
week ending week ending week ending week ending
Countries
France Italy Germany Spain (no mandate)
2.5
2 1.5
weekly first doses, mln
weekly first doses, mln
weekly first doses, mln
1.5
weekly first doses, mln
2
1.5
1.5 1 1
1
1
0.5 0.5
0.5 0.5
0 0 0 0
15 ul
31 ul
15 Jul
31 ug
15 ug
30 ep
15 ep
15 ul
31 ul
15 Jul
31 ug
15 ug
30 ep
15 ep
31 ct
ct
31 ct
ct
15 ul
31 ul
15 Jul
31 ug
15 ug
30 ep
15 ep
31 ct
ct
15 ul
31 ul
15 Jul
31 ug
15 ug
30 ep
15 ep
31 ct
ct
-J
-J
-J
-J
-O
-O
-O
-O
-J
-J
-O
-O
-J
-J
-O
-O
-A
-A
-S
-S
-A
-A
-S
-S
-A
-A
-S
-S
-
-
-A
-A
-S
-S
-
-
01
01
01
01
week ending week ending week ending week ending
Notes: The figure plots the weekly first doses of COVID-19 vaccines administered for dates t − 6 to t,
where t is the date on the horizontal axis. The dashed red lines denote the proof of vaccination mandate
announcement dates (for countries, this is the date of a national mandate). Spain had not announced a
national proof of vaccination mandate as of October 31, 2021. We show the four most populated Canadian
provinces totalling about 87% of Canada’s population (see Fig. B4 for all ten provinces). Alberta also had
a $100 debit card incentive for doses received between Sep. 3 and Oct. 14, 2021.
what is the cumulative effect of the mandates on vaccine uptake?
Using Canadian province-level data in a difference-in-differences (DID) statistical anal-
ysis, we find a quick and significant increase in vaccine uptake, measured by new weekly
first doses, following the announcement of a proof of vaccination mandate. In our baseline
DID specification, using the period June 15 to Sep. 14, 2021 and splitting the data into five
‘treated’ provinces (those with the earliest announcements) and five ‘control’ provinces (not
yet announced), we estimate a 66% (50.6 log points, 95% CI 24.5–76.7)8 average increase in
weekly first doses following the mandate announcement, relative to in absence of mandate.
8
Throughout the paper, we report 95% confidence intervals for parameter estimates and 90% confidence
intervals for counterfactual simulation results.
4The increased uptake is sustained over the post-announcement period with available data.
We obtain similar results, more than 60% increase in weekly first doses on average over the
post-announcement weeks, also when using alternative dates and treatment groups varying
from the first three to the first nine provinces to announce a mandate.
We complement and extend the DID panel-data results with structural-break and time-
series analysis, which allows us to study the mandates’ longer-term impact on vaccine uptake
using our full dataset up to October 31, 2021 and to obtain individual policy effect estimates
for each province and country. We test for the presence of a structural break at the announce-
ment date and find that we can reject the null hypothesis of no break for each of the ten
provinces and three countries. The time-series results confirm the rapid and large increase in
first-dose uptake after a mandate announcement relative to the no-mandate trend found in
the DID analysis. The estimated effect varies across the provinces, e.g., a 34% (29 log points,
8.2–50.5) initial increase in Ontario vs. 326% (145 log points, 110–181) in Alberta. We note
that several factors may contribute to the heterogeneity of the estimates, including the time
between the mandate announcement and implementation and the fraction of the population
that is already vaccinated at the time of announcement (both are negatively correlated with
the size of the estimated initial effect). We find similar results for the countries – an average
estimated initial increase in weekly first doses of 17% (15.4 log points, 5.0–25.8) for France,
179% (103 log points, 53–152) for Italy and 55% for Germany (43.8 log points, 31.4–56.1),
relative to the respective pre-mandate trends.9
Using our time-series estimates for each province in counterfactual simulations, we find
large cumulative increases in the first-dose vaccination rate for all provinces, relative to in
the absence of mandate: from 1.9 p.p. (90% CI: -0.3–3.0) in Ontario to 5 p.p. (4.0–5.6) in
Saskatchewan and 5 p.p. (3.9–5.8) in New Brunswick, with all other provinces in between, as
of October 31, 2021. These estimated total gains in uptake add up to 2.9 p.p. (1.3–3.8) of the
eligible population, or 979,000 new first doses (425,000–1,266,000), for Canada as a whole.
This is a significant increase in vaccine uptake considering the relatively short time in which
it was achieved and the very high pre-mandate first dose vaccination rate in Canada (over
80% on average at the time of the mandate announcements). We also estimate large increases
in first-dose vaccinations relative to the no-mandate counterfactual in the three countries: 8
p.p. (4.3–10.8) or 4.59 mln (2.47–6.25) doses in France, 12 p.p. (5.0–15.1) or 6.48 mln (2.67–
8.14) additional first doses in Italy, and 4.7 p.p. (4.1–5.1) or 3.47 mln (3.06–3.81) doses in
Germany as of October 31, 2021, in our baseline specification. These estimated gains are
9
A comparison of Fig. 1 and Fig. B2 suggests that the relatively low French estimate for the initial policy
effect may reflect a lag between appointment booking and vaccine administration.
5larger than that for Canada, possibly because of the earlier mandates in these countries or
the lower starting vaccination rates, and they may partly reflect expanding the scope of the
initial mandates, e.g., in Italy.
Vaccination mandates have been controversial, as some people perceive them as restric-
tions on personal freedom. This can affect compliance and increase both the direct imple-
mentation and enforcement costs, as well as the political costs of introducing a mandate.
We do not address ethical considerations in this paper. Our goal is to assess the mandates’
effectiveness purely in terms of raising vaccine uptake, which can then be weighed against
various costs and compared to other policies including financial incentives (cash, gift cards,
lotteries) or behavioral nudges (e.g., messages from experts, appointment reminders).
In related work, Mills and Rüttenauer (2021) use a synthetic control approach to evaluate
the impact of COVID-19 certification mandates on vaccine uptake, overall and by age group,
in six countries. The authors find significant increases in daily total vaccinations in France,
Israel and Italy between 20 days prior to 40 days after the mandate implementation.10 While
the main takeaway is similar, our paper differs in several important ways. First, we provide
robust difference-in-differences evidence using the variation in mandate timing within the
same country, Canada, in addition to evidence using time-series methods for France, Italy
and Germany. Second, instead of total vaccinations, we focus on first doses, as most directly
reflecting the decision to become immunized and avoiding potential issues related to second
dose scheduling or availability in spring/summer 2021. This is one possible reason why, unlike
Mills and Rüttenauer, we find a statistically significant increase in vaccine uptake in Germany
around the mandate.11 Third, instead of using a fixed 20-day cutoff before implementation,
we use the actual mandate announcement date12 as the intervention indicator and show a
strong impact on vaccine uptake thereafter.
There is little evidence that financial or behavioural nudges increase the vaccination rate
among hesitant people. Chang et al. (2021) report results from a mid-2021 randomized
controlled trial (RCT) with unvaccinated members of a large Medicare health plan in a Cal-
ifornia county with 77% vaccination rate at the time of the study. The authors examine the
effect of $10 or $50 financial incentives, different public health messages and an appointment
scheduler, on vaccination intentions and uptake within 30 days of the intervention. They
10
Mills and Rüttenauer estimate about 4 mln additional vaccinations in Italy and about 8.6 mln in France
for the period 20 days before to 40 days after mandate implementation.
11
When using total vaccinations instead of first doses, we also do not find a statistically significant effect
for Germany.
12
The interval between mandate announcement and implementation in the ten Canadian provinces and
three countries in our sample varies from 5 to 41 days.
6find that none of the financial or behavioural treatments increased the vaccination rate
among the treated. The proof-of-vaccination mandates we analyze target a similar group
of unvaccinated people that have had the opportunity to be vaccinated for a long time.
The population-weighted average first-dose vaccination rate on the dates of the provincial
mandate announcements is 83.3%, even higher than in Chang et al. (2021), suggesting that
financial or behavioural incentives are even less likely to be effective in our setting.13 On
behavioral nudges, see also Dai et al. (2021), Alsan and Eichmeyer (2021) and Kluver et
al. (2021). On financial incentives, see Barber and West (2021), Brehm et al. (2021), Sehgal
(2021), and Walkey et al. (2021) on Ohio’s vaccine lottery, with mixed results.
2 Data
2.1 Data sources and definitions
We use data on COVID-19 vaccination numbers, cases and deaths for all ten Canadian
provinces, as well as for France, Italy, Germany and Spain.14 Announcement and imple-
mentation dates of the proof of vaccination mandates were collected from the respective
government websites and major newspapers (see Table C1).
The main variables in our statistical analysis are defined below. Everywhere, i denotes
province or country and t denotes time measured in days (date). We aggregate the data on
vaccinations, cases and deaths on a weekly basis (totals for the week ending on date t, i.e.,
dates t − 6 to t) to reduce the influence of day-of-the-week effects and reporting artifacts.15
Outcome, Vit . Our main outcome variable is the logarithm of administered vaccine first
doses per 100,000 people, Vit , for the week ending at t (dates t − 6 to t). We use first doses
as they most directly reflect the impact of proof of vaccination mandates on the intent to be
immunized.16 Using the logarithm of weekly first doses allows us to interpret the regression
coefficients as percentage changes in the outcome; moreover, the estimates are invariant
13
In an RCT study in Sweden, Campos-Mercade et al. (2021) find that a modest payment of SEK 200
(USD 24) is associated with a 4.2 p.p. increase in vaccinations, relative to a baseline rate of 71.6% in the
control group, while none of three behavioral nudges had impact. However, the RCT subjects were yet to
become eligible to be vaccinated, and hence the setting is not comparable to ours in which weeks have elapsed
after widespread vaccine availability.
14
See Table C4 for the data sources and details. We collected the Canadian data from the official provincial
dashboards or equivalent sources. We use the Our World In Data dataset for the country data.
15
Some locations, e.g., British Columbia and Nova Scotia, do not report vaccination data on weekends
and then report the total for several days at once (e.g., Monday’s number contains 3 days of data). In these
cases, we distribute the reported total equally over the affected days.
16
In Table A4, we also report results using second doses as the outcome. We find no statistically significant
effect on second-dose uptake following the announcement of mandate.
7to normalization, e.g., by population, as its effect is subsumed in the regression constant
or fixed effects. We thus use “log weekly first doses” for simplicity throughout the paper,
except where the actual scale is important.
Policy, Pit . Let tˆi be the announcement date of the proof of vaccination mandate in
jurisdiction i. We construct a binary policy variable Pit equal to 1 for all post-announcement
dates t ≥ tˆi and equal to 0 for all t < tˆi . Proof of vaccination mandates were announced in
all ten Canadian provinces over the period August 5, 2021 to September 21, 2021 (see Table
C1 and Fig. B3).17 The last six provinces to act were the four Atlantic provinces, which
had the lowest per capita case rates in August 2021, and Alberta and Saskatchewan, which
had the highest per capita case rates in August 2021. Several European countries, including
France, Italy and Germany, also introduced proof of vaccination mandates in summer 2021
(see Table C1).
Information, Iit . We construct variables related to the underlying COVID-19 epidemi-
ological situation, specifically log of weekly cases, Cit , and log of weekly deaths, Dit , for the
week ending at date t (dates t − 6 to t).18 We refer to these variables jointly as informa-
tion, Iit , (see Chernozhukov et al., 2021 or Karaivanov et al., 2021) since they can inform a
person’s COVID-19 exposure risk assessment and/or decision to be vaccinated.19
Controls, Wit . We include province fixed effects and date fixed effects in our panel data
analysis. The province fixed effects account for any time-invariant province characteristics
such as sentiment towards vaccination, age distribution, etc. The date fixed effects control
for nation-wide trends or events, e.g., public messaging, vaccine-related international travel
regulations, or political campaigning for the September 2021 federal election. In the time-
series analysis, we control for time trends.
Time period. We use the period June 15, 2021 to October 31, 2021. The start date is
chosen to ensure that possible constraints to obtain a first dose related to eligibility or vaccine
supply are minimal or non-existent.20 We explore different sample start dates in robustness
17
We use Sep. 17, 2021 as the mandate announcement date for Newfoundland and Labrador, the date on
which the premier (provincial head of government) announced the upcoming mandate. The mandate details
were officially unveiled on Oct. 7 after consultations with the business and other sectors. However, using
the latter date would be problematic because of a potentially strong anticipation effect following the first
announcement. Our main results in Table 1 and Fig. 3 are not affected by this choice. Throughout the
paper, “Newfoundland” refers to the province of Newfoundland and Labrador.
18
Another possible information variable is hospitalizations. However, it is very strongly correlated with
the COVID-19 cases and deaths. To avoid multicollinearity, we do not include it in our baseline specification.
See Table A2 for results using deaths and hospitalizations as information instead of deaths and cases.
19
To tackle zero weekly values, which sometimes occur in the smaller provinces for deaths or cases (4.4% of
all observations for cases and 10.7% for deaths), we replace log(0) with -1 as in Chernozhukov et al. (2021).
20
In Canada, the provinces opened registration for first-dose vaccination for any person of age 12+ between
May 10, 2021 in Alberta and May 27, 2021 in Nova Scotia, see Table C2. First-dose availability in France,
8checks. The sample end date is based on data availability at the time of statistical analysis
and writing. First doses for the 5–11 age group were not approved in this period.
Figure 2: First doses after mandate announcement
Canadian provinces Countries
500 250
Quebec France
450
weekly first doses relative to pre-announcement week
weekly first doses relative to pre-announcement week
British Columbia Italy
Manitoba Germany
400 Ontario 200
Nova Scotia
350 Alberta
New Brunswick
300 Saskatchewan 150
Newfoundland
Prince Edward Island
250
200 100
150
100 50
50
0 0
0 1 2 3 4 5 6 7 8 9 10 11 12 0 1 2 3 4 5 6 7 8 9 10 11 12 13 14 15 16
weeks since mandate announcement weeks since mandate announcement
Notes: The figure plots the weekly administered first doses of COVID-19 vaccine for all dates after the
mandate announcement against the number of weeks since the respective announcement date (denoted by
0 on the horizontal axis), as of Oct. 31, 2021. The weekly first doses for the week just prior to the mandate
announcement are normalized to 100 for each respective province (on the left) or country (on the right).
2.2 Descriptive analysis
Fig. 2 plots the time profile of weekly first doses after a mandate announcement, with first
doses in the week ending on the mandate announcement date normalized to 100. The figure
only provides a raw-data illustration of the magnitude of the increase in weekly first doses
following a mandate announcement. We follow up with formal analysis, controlling for
information, fixed effects, pre-trends and other factors, in Sections 3–5.
Fig. 2 shows that weekly first doses in the Canadian provinces and in France, Italy
and Germany grow quickly after the proof of vaccination mandate announcement, reach a
peak at about 1 to 3 weeks after the announcement date and then decrease, as in the pre-
announcement trend in most locations (see Fig. B4).21 Several provinces, notably New
Brunswick, Newfoundland, Alberta, Nova Scotia and Saskatchewan, as well as France,
registered large increases in first-dose vaccine uptake of over 100% relative to the pre-
Italy and Germany was similar by mid-June, at least for the 18+ age group.
21
British Columbia, Ontario, Nova Scotia, Saskatchewan and Newfoundland exhibit a second peak later.
9announcement week. In other locations, e.g., Quebec, Ontario, Manitoba and Germany
the observed increase is more moderate (less than 50%).
3 Panel data results – Canadian provinces
3.1 Estimation
We estimate a behavioral model in which the decision to receive a COVID-19 vaccine (mea-
sured by new weekly first doses) is affected by the policy setting, Pit (whether a proof of
vaccination mandate has been announced) and the current COVID-19 epidemiological and
public health conditions, Iit , proxied by weekly cases and deaths. Based on the raw data
patterns in Fig. 1 and Fig. B4 and the absence of vaccine supply constraints in the studied
period, we assume no lag between the mandate announcement and a person’s ability to re-
ceive a first vaccine dose.22 Finally, we assume that individuals take into account the weekly
public health indicators, Iit , for the week ending at date t, with no lag.
We use a difference-in-differences (DID) method to study the average effect of proof
of vaccination mandates in Canada. In addition to information Iit , we control for other
potential confounding variables or unobserved heterogeneity by including time and location
fixed effects. We estimate the following equation:
Vit = αPit + βIit + γt + δi + εit (1)
where Vit is log weekly first doses for location i and date t, Iit is information, γt are date
fixed effects, δi are province fixed effects, and εit is the error term. The coefficient α on
the policy variable Pit captures the average effect of the mandate announcement on weekly
first doses over all post-announcement dates. To capture dynamic effects of the mandates,
we also estimate a version of equation (1) with Pit broken into separate indicator variables,
one for each week after the mandate announcement date. To correct for the small number
of clusters in the estimation due to there being only ten provinces, we compute and report
“wild bootstrap” p-values (Cameron et al., 2008).23
The recent methodological literature has argued that the standard OLS two-way fixed
effects (TWFE) estimator can be invalid in panel-data settings with staggered adoption like
ours if there is heterogeneity in the treatment effect across groups/cohorts (provinces in this
22
For our main model (difference-in-differences), we perform sensitivity analysis using alternative lags of
up to 7 days (see Section 3.3 and Fig. B5); the results affirm our baseline choice of zero lag.
23
We use the Stata function boottest (see Roodman et al., 2019) clustered by province with 4,999 repeti-
tions. Alternative ways of computing the standard errors are displayed in Table A3.
10paper) and/or over time. The reason is that the TWFE estimate is a weighted average of
many 2-by-2 DID treatment effects, where some of the weights can be negative or incorrect
because of contamination from other periods (Goodman-Bacon, 2021).24 In particular, Sun
and Abraham (2021) develop an ‘interaction-weighted’ difference-in-differences estimator
that is valid under these conditions and which we use to estimate (1). The Sun and Abraham
estimator uses never-treated or last-treated units as the control group and is constructed as
an appropriately weighted average of treatment effects for each cohort (by date of mandate
announcement) and each relative time after or before the announcement.25
The Sun-Abraham estimator requires excluding from the estimation all time periods in
which units in the control group are treated. Since the last province to announce a mandate
is Prince Edward Island, on September 21, 2021, this means that we can use only data until
September 20, at the latest (see Table C1). We present results for different control groups
and corresponding sample periods in Table A1. We also compare our baseline results with
the OLS TWFE estimates in Table A2. In addition, in Section 4 we report results from
time-series analysis using all available data until October 31.
3.2 Results
Fig. 3 displays an event study analysis of weekly first doses administered in the ten Canadian
provinces, from six weeks before to five or more weeks after the announcement of a proof
of vaccination mandate. T = 0 denotes the week starting at the announcement date. The
reference point is one week before the mandate announcement (T = –1). We use the Sun and
Abraham (2021) treatment effect heterogeneity robust estimator and use as the control group
(latest treated) the last five provinces to announce a mandate (Alberta, New Brunswick,
Saskatchewan, Newfoundland and Prince Edward Island). We chose this control group as the
latest-in-time representative set of provinces containing a mix of smaller and larger provinces
by population. The control group implies September 14, 2021 (the day before mandate
announcement in Alberta and New Brunswick, see Table C1) as the (latest possible) sample
end date in our baseline specification. We present results with different control groups,
corresponding to both earlier and later end dates, in Table A1.
We make several observations on Fig. 3. First, there is no mandate-associated pre-trend
– the Sun-Abraham DID estimates before the mandate announcement are statistically in-
distinguishable from zero. This addresses the potential endogeneity concern that provinces
24
See also Athey and Imbens (2018), de Chaisemartin and D’Haultfoeuille (2018), Callaway and Sant’Anna
(2021) and Sun and Abraham (2021).
25
We use the Stata function eventstudyinteract provided by the authors.
11Figure 3: Canadian provinces – event study
Outcome: weekly first doses per 100,000
1
Estimate and 95% confidence interval
0.5
0
-0.5
-6 -5 -4 -3 -2 -1 0 1 2 3 4 5+
weeks from vaccine mandate announcement
Notes: Sun and Abraham (2021) treatment effect heterogeneity robust estimates. Sample period: June 15
to September 14, 2021 using Alberta, New Brunswick, Saskatchewan, Prince Edward Island and
Newfoundland as the control group (latest treated). The outcome variable, Vit is log weekly first doses per
100,000 people administered for dates t − 6 to t inclusive. The figure plots the estimates from a variant of
equation (1) where the mandate announcement variable Pit is replaced by the interaction of being in the
‘treatment’ group (announced mandate) with a series of dummies for each week ranging from 6 weeks
before (T = −6) to 5 or more weeks after the announcement (T = 5), where T = 0 is the week of the
announcement. The reference point is one week before the announcement (T = –1). The dotted lines
correspond to 95% confidence intervals.
that announced a mandate may have had a different trend in first-dose vaccinations than
provinces that did not announce a mandate. Second, the impact of the mandate announce-
ment on first-dose vaccine uptake is realized relatively quickly. Third, the mandate effect
on the pace of first-dose vaccinations is large in magnitude — an increase of 42% (35 log
points, CI 9–62) in weekly first doses in the first post-announcement week and 71% (54 log
points, 21–86) in the second week, each relative to one week before the announcement.26
The observed quick increase in uptake mitigates possible concerns that vaccine supply or
scheduling constraints may be affecting our results (see also Fig. 2 for a raw data plot of
the post-announcement increase in first-dose vaccinations by province). Fourth, the average
policy effect persists over time over the 6-week post-announcement period we analyze (T = 0
to T = 5). Unfortunately, the limitations of the data (the timing of the announcements) and
the need for a not-yet-treated control group do not allow us to investigate longer horizons.
A coefficient estimate x is equivalent to 100x log points or a 100(ex − 1) percent increase in weekly doses.
26
The smaller T = 0 estimate reflects the fact that the outcome variable is a backward-looking weekly sum.
12We return to this in Section 4 using time-series analysis of all the data until October 31.
Table 1: Canadian provinces – difference-in-differences results
Outcome: log weekly vaccine first doses, Vit
p-values in [ ] (1) (2) (3)
mandate announced, Pit 0.504 *** 0.506 ***
[0.002] [0.001]
week 0 0.359 ***
[0.005]
week 1 0.543 ***
[0.001]
week 2 0.498 **
[0.010]
week 3 0.705 ***
[0.001]
week 4 0.713 **
[0.018]
week 5+ 0.651 *
[0.056]
log weekly cases, Cit 0.002 0.002
[0.967] [0.958]
log weekly deaths, Dit 0.048 0.046
[0.365] [0.415]
R-squared 0.817 0.820 0.821
sample size, N 920 920 920
province fixed effects X X X
date fixed effects X X X
Notes: Sun and Abraham (2021) treatment effect heterogeneity robust estimates. Sample period: June 15
to September 14, 2021 using Alberta, New Brunswick, Saskatchewan, Prince Edward Island and
Newfoundland as control group (latest treated). “week n”, where n = 0, 1, 2, ..., is a binary variable that
takes value 1 for the days in the n-th week immediately after the announcement date (week 0 is the week
starting at the announcement date) and value 0 otherwise. The Cit and Dit variables are log weekly totals
for dates t − 6 to t. P-values from wild bootstrap (boottest) standard errors clustered by province with
4,999 repetitions are reported in the square brackets. *, ** and *** denote 10%, 5% and 1% significance
respectively. The results in column (3) are not directly comparable to those in Fig. 3 because in Table 1
the reference point is the entire pre-announcement period.
Table 1 shows the Sun-Abraham DID estimates of equation (1) along with p-values from
wild bootstrap standard errors clustered by province in the square brackets.27 Columns (1)
27
In Table A3 we also report alternative standard error specifications: regular clustering at the province
level (Stata command “cluster”), wild bootstrap standard errors clustered at the province level (Stata com-
mand “boottest”) and wild bootstrap standard errors two-way clustered by province and date.
13and (2) (without and with controlling for weekly cases and deaths) show that the mandate
announcement is associated with an average increase of about 66 percent (50.6 log points,
CI 25-77 in column 2) in weekly first doses. In column (3) of Table 1, we report estimates
from a variant of equation (1) where the policy variable Pit is decomposed into six binary
variables (one for each week after the announcement date) to account for dynamic effects.
The results indicate a sharp increase in weekly first doses of 43 percent (36 log points, CI
14–58, p < 0.01) in the week beginning at the announcement date (week 0). The increase
is sustained until the sample end date as all estimates in column (3) are positive (p < 0.02,
except for “week 5+”, p < 0.06) and larger than in week 0. We note that the later estimates
are based primarily (week 3) or only (week 4) on post-mandate vaccinations in Quebec, the
province with the earliest announcement. Thus, the DID analysis yields no evidence that
short-term net intertemporal substitution (which would be manifested as a negative policy
estimate for the later weeks) is the mechanism behind the observed boost in vaccinations in
the studied period.
In Table A1, reporting policy estimates by week after announcement and the upper left
panel of Fig. B5, reporting the average estimate for the post-announcement period, we use
different sets of provinces as control group, from only Prince Edward Island (PEI) (using
data up to Sep. 20), to all provinces except Quebec, British Columbia and Manitoba (using
data up to Aug. 31). We find that our main results from Table 1 remain robust to using
alternative control groups.
3.3 Robustness analysis
Alternative initial dates. In Fig. B5, upper right panel, we show that our estimates
of the effect of a mandate announcement on first dose vaccine uptake are not very sensitive
to the choice of initial sample date between May 1 and Jul. 15, 2021. This provides further
reassurance that vaccine supply constraints are not a major concern for our results.
Lags. In equation (1), we assume no lag between the mandate announcement Pit and a
person’s ability to receive the first dose (the outcome Vit ). In practice, a small delay may
occur (e.g., from making an appointment to receiving the vaccine) even in the absence of
supply constraints. The lower left panel of Fig. B5 displays the coefficient estimates α̂ of the
policy effect when assuming a lag of zero (our baseline) to seven days. The mandate effect
estimates remain large and statistically significant when varying the lag length, with a slight
decrease for the longer lags. The lower right panel of Fig. B5 displays the policy estimates
α̂ when assuming a lag of zero (our baseline) to 14 days in the information variables Ii t
14(log weekly cases and deaths). The mandate effect estimates remains large and statistically
significant when varying the lag length.28
Other robustness checks. We perform additional robustness checks in Table A2. For
easier comparison, column (1) replicates our baseline estimates from columns (2) and (3)
of Table 1. Column (2) of Table A2 omits cases and deaths, the coefficients for which are
not significant in the baseline specification. In column (3), we control for log weekly deaths
and log average weekly hospitalizations as information. Column (4) reports the estimates
of a weighted specification using the provincial populations as weights and the baseline
information variables (cases and deaths). The estimates are smaller than in the unweighted
baseline (column 1), suggesting that smaller provinces contribute more to the the estimated
effect of mandate announcements on vaccine uptake. In column (5), we re-estimate equation
(1) using the standard OLS two-way fixed effects (TWFE) estimator which, as discussed in
Section 3.1, can be biased in the presence of heterogeneous treatment effects over cohorts
and/or time. In our setting, we find that these estimates differ relatively little from our
baseline Sun-Abraham treatment effect heterogeneity robust estimates.
In Table A2 column (6), we use log of daily (instead of weekly) first doses as the outcome
and log of daily cases and deaths as information and find similar estimates to those in our
baseline specification, although larger in week 0 since the outcome is not a moving sum.
In column (7), we use the level of weekly first doses per 100,000 people as the outcome.
The estimates are noisier than in the baseline and indicate that a mandate announcement
increases weekly first dose uptake by roughly 482 per 100,000 people on average (CI -11–
975, p < 0.06) after the announcement. Overall, all these alternative specifications confirm
the robustness of our main finding of statistically significant and large impact of mandate
announcements on vaccine uptake.
Randomization inference. Difference-in-differences inference from the model in equa-
tion (1) relies on asymptotic approximations requiring a sufficiently large number of provinces.
While we do account for the fact that there are only 10 provinces in our sample by using
wild bootstrap to compute the estimates’ p-values, as an additional robustness check, we
implement a variant of Fisher’s randomization test (Fisher, 1935). Specifically, we estimate
equation (1) 5,000 times by randomly assigning the mandate announcement date for each
of the ‘treated’ provinces in our baseline specification. Fig. B6 plots the histogram of the
randomized inference (placebo) mandate effect estimates, along with the 95% confidence
band. Only 2.88% of the 5,000 placebo estimates are larger than our baseline estimate 0.506
28
We also checked a specification in which we lag the information variables Iit (log weekly cases and
deaths) with the same lag as the policy Pit , and the results are nearly identical.
15from column (2) of Table 1 (the solid vertical line on Fig. B6), offering assurance that our
main result does not hinge on asymptotic inference.
3.4 Second doses
In Table A4, we estimate the specifications in Table 1 using log of weekly second doses
as the outcome. There are two potential mechanisms through which proof of vaccination
mandates may have an impact on second dose uptake: (i) people that already had a first
dose decide to receive their second dose soon after the announcement or implementation
(e.g., because most mandates require full vaccination) and (ii) people that took a first dose
because of the mandate take their second dose roughly 4 weeks after the first. We do not
find a statistically significant effect of mandate announcements on second dose uptake in
our sample period. This is consistent with second doses being more spread out after the
announcement. We also plot weekly second doses over time on Fig. B7 and, unlike the sharp
increases for first doses, we only see relatively small and gradual second-dose increases after
the mandate announcements in some of the (smaller) provinces.
3.5 Mandate implementation
Our main results use the regional variation in the timing of announcement of proof of vacci-
nation mandates to examine their effect on vaccine uptake. In addition, there is variation in
the interval between the mandates’ announcement and implementation (coming into force),
as well as in the implementation dates themselves – see Table C1 and Fig. B4.29 We checked
whether we can detect additional effects on first-dose uptake, associated with the mandates’
implementation, by adding to equation (1) an indicator variable that equals to 1 post-
implementation and 0 otherwise. The estimate on this indicator variable is positive but not
statistically significantly different from zero (not displayed). However, we cannot conclude
that there do not exist implementation effects, since even the latest feasible sample end date
(Sep. 20, 2021) necessitated by the requirement to have a not yet treated control group is
only soon after the mandate implementation date in 3 of the 10 provinces (see Table C1).
29
The mandates were implemented in all provinces between Sep. 3 and Oct. 22, 2021.
164 Time series analysis
4.1 Estimation method
We complement and extend our panel data analysis for Canada by time-series analysis for
each of the ten Canadian provinces, as well as for France, Italy and Germany. While the
Sun and Abraham (2021) difference-in-differences approach in Section 3 allows us to reliably
estimate the impact of mandate announcements on new first doses in Canada by exploiting
the variation in the timing of the mandates across provinces, it can only be used with data
from before the last treatment date and hence it does not allow us to evaluate the effect of
the mandates beyond the short term. In contrast, under stronger identification assumptions,
the time-series approach allows us to use all our data until October 31, 2021 to estimate the
mandates’ effect on vaccine uptake and the cumulative additional vaccinations compared to
the counterfactual of no mandate separately for each province and country.
We use the ‘interrupted time-series analysis’ (ITSA) framework (e.g., Linden, 2015) and
estimate the following equation for each country or province30
Vt = c + λ1 Vt−7 + λ2 Vt−14 + πPt + τ1 Tt + τ2 Tta + µIt + ηt , (2)
where Vt are log weekly first doses for the week ending at date t, c is a constant, It is proxy
for information analogous to its counterpart in equation (1), and ηt is the error term. In our
baseline time-series specification, we construct the policy variable Pt as the weekly average
from date t − 6 to t of the ‘mandate announced’ indicator Pit defined in Section 2.1.31 We
include 7-day and 14-day lagged values of Vt (instead of t − 1 or t − 2 autoregressive terms)
since the outcome variable Vt is a weekly total.
We include two time trends in equation (2): Tt is a linear daily time trend initialized at
the sample start date t = 0 and Tta is an ‘interaction’ time trend which takes value 0 at all
dates until the announcement date (inclusive) and increases by 1 for each day afterwards.
The coefficients τ1 (slope) and τ2 (change in slope at the announcement date) characterize
respectively the baseline (pre-announcement) time trend and the post-announcement time
trend (with slope τ1 + τ2 ) in weekly first doses.
The time-series estimation requires stronger identifying assumptions than the DID ap-
proach since there is no control group. Specifically, we need to assume that the time-series
30
We omit the subscripts i for simplicity since all variables refer to the same location.
31
Using a weekly average of the mandate indicator is consistent with the weekly vaccination and informa-
tion variables Vt and It and improves the fit in the time-series regressions. We also present results without
weekly averaging in Tables A6 and A7.
17process of weekly first doses changed after the mandate announcement only because of the
policy, i.e., that it would have followed the same pre-trend if no mandate had been announced.
Another needed assumption is exogeneity of the announcement date. We also cannot con-
trol for fixed effects in a flexible way beyond including a constant and time trends. Under
these assumptions, the coefficient on the policy variable Pt captures the average level shift
in first-dose uptake attributed to the mandate announcement. Similarly, the coefficient on
the interaction time trend Tta measures the slope change in the time trend of first doses after
the mandate announcement, relative to the pre-announcement trend.
4.2 Structural break at the mandate announcement date
We first show the impact of the proof of vaccination mandate announcements on first dose
uptake in Table A5, where we perform a structural break test (Chow (1960) test for a
known break point) for the log weekly first doses, Vt . The presence of a break point in
Vt at the mandate announcement date indicates an abrupt change (shift) in the first-dose
time series process. We use a bandwidth of 50 days before and 35 days after the mandate
announcement date.32 The before-after bandwidth was chosen to reduce the size distortion
of the test since the outcome variable is a weekly sum and the error terms are serially
correlated.33 Columns (1) and (2) in Table A5 use the log of weekly first doses, Vt . For all
ten Canadian provinces and all three countries, we strongly reject the null hypothesis that
the mandate announcement date is not a structural break (p < 0.01).
We also perform the structural break test using first-differenced weekly first doses in
Table A5 column (3). The differenced series is stationary, and the error terms are not
serially correlated, which alleviates concerns about size distortion in the Chow test. The
null hypothesis of no structural break at the announcement date is rejected with p < 0.05 in
most locations except Saskatchewan and three Atlantic provinces.34 Overall, the structural
break test results suggest that a mandate announcement is strongly associated with a trend
break in first-dose vaccine uptake in all or most locations depending on the specification.
32
The results are also robust to picking June 15, 2021 as the initial date for the test.
33
As shown in Giles and Scott (1992), the size of the Chow test is distorted upward (over-rejection of the
null) in the presence of positive serial correlation in the error terms. The size distortion is mitigated if the
sample split is unequal before vs. after the break point.
34
The power of the Chow test is weaker in this specification since the first-differenced Vt series is a growth
rate being used to test for a level shift. The differenced series is also noisier as it captures daily fluctuations.
184.3 Results
In Table 2, we report the results from estimating the time-series model (2) for each country
and province in our data.35 We include log weekly cases and deaths as information, It . In
columns (1)-(3), we report the estimated coefficients on the mandate announcement variable,
Pt , the time trend, Tt , and the interaction time trend, Tta , in equation (2). Since the outcome
and information variables are level variables that can introduce non-stationarity, we use the
augmented Dickey-Fuller (ADF) unit root test to test whether the residuals ηt are stationary,
to avoid a spurious regression.36 We reject the null hypothesis that the residual contains a
unit root at the 95% confidence level for all locations except Newfoundland, where we can
reject the null at the 90% level.
The coefficient estimates π̂ on the mandate announcement variable Pt in Table 2 are large
and statistically significantly positive (p < 0.01) for all three countries. Italy’s estimated ini-
tial rise in weekly first doses after the mandate announcement is the largest (102.5 log points,
CI 53-152), i.e., 179% average increase relative to the pre-announcement trend, followed by
Germany (43.8 log points, CI 31–56 or 55% increase) and France (15.4 log points, CI 5–26 or
17% increase).37 The baseline time trend is downward sloping (τ̂1 < 0) in all countries and
indicates a steep decrease in vaccinations of 1.7% to 2.9% per day. The post-announcement
trend in first doses turns less steep in all three countries (the post-announcement slope change
estimate τˆ2 is positive, although only statistically significant for Germany), which suggests
a lack of net intertemporal substitution as of October 31.
Turning to the Canadian provinces in Table 2 we obtain statistically significantly positive
and large estimates of the increase in weekly first doses after mandate announcement, π̂ for
all provinces except Quebec.38 The statistically significant policy estimates range from 0.293
(0.082–0.505) in Ontario, equivalent to a 34% average increase in first doses relative to the
pre-announcement trend, to 1.455 (1.102–1.808) in Alberta (a 328% increase). The range
of estimates is consistent with our DID estimate in Table 1 for the average policy effect for
Canada, although the two estimation methods are not directly comparable.
35
The estimates’ p-values are calculated using the Newey-West heteroskedasticity and autocorrelation
(HAC) robust estimator (Newey and West, 1987) with 3 lags. The lag length was chosen as the closest
integer to T 1/4 , where T is the sample size.
36
The ADF test results in column (4) use 13 lags, chosen as the integer part of 12(T /100)1/4 , see Schwert
(1989). For fewer lags the test tends to yield smaller p-values.
37
France’s estimate is sensitive to including log weekly cases. We obtain a larger estimate, π̂ = 0.468
(0.326–0.610), or 60% increase, using deaths and hospitalizations as information variables, see Table A6.
38
The estimate for Quebec is 0.389 (0.265–0.514) and statistically significantly different from zero when
we use deaths and hospitalizations as information It ; see Table A6.
19Table 2: Time series estimates
Outcome: log weekly vaccine first doses
time trend
policy π̂ trend τˆ1 change τˆ2 ADF test
p-values in [ ] (1) (2) (3) (4)
Countries
France 0.154 *** -0.018 *** 0.003 -3.970
[0.004] [0.000] [0.229] [0.002]
Italy 1.025 *** -0.029 *** 0.005 -3.365
[0.000] [0.001] [0.556] [0.012]
Germany 0.438 *** -0.017 *** 0.006 ** -3.235
[0.000] [0.000] [0.012] [0.018]
Canadian provinces
Quebec 0.064 -0.029 ** 0.017 * -5.192
[0.647] [0.010] [0.079] [0.000]
British Columbia 0.734 *** -0.013 *** -0.004 -4.587
[0.000] [0.008] [0.400] [0.000]
Manitoba 0.757 *** -0.034 *** 0.012 ** -4.735
[0.000] [0.000] [0.014] [0.000]
Ontario 0.293 *** -0.011 ** 0.002 -4.166
[0.007] [0.033] [0.739] [0.001]
Nova Scotia 0.595 *** -0.025 *** 0.021 ** -4.698
[0.002] [0.000] [0.021] [0.000]
Alberta 1.455 *** -0.015 *** -0.024 *** -3.372
[0.000] [0.000] [0.000] [0.012]
New Brunswick 1.313 *** -0.011 ** -0.017 *** -4.416
[0.000] [0.019] [0.004] [0.000]
Saskatchewan 0.898 *** -0.008 *** -0.013 ** -3.800
[0.000] [0.001] [0.013] [0.003]
Newfoundland 0.410 * -0.007 0.005 -2.689
[0.075] [0.241] [0.742] [0.076]
Prince Edward Island 0.378 ** -0.002 -0.014 ** -2.904
[0.010] [0.565] [0.019] [0.045]
sample size for each row 139 139 139 139
Notes: Time period – June 15 to October 31, 2021. Each row is a separate time-series regression as
specified in (2). All rows include 7-day and 14-day lags of the outcome variable and log weekly deaths Dt
and log weekly cases Cit as information, It . Column (1) reports the estimate π̂ on the mandate
announcement policy variable Pt in equation (2). Column (2) reports the estimate τˆ1 on the linear time
trend Tt . Column (3) reports the estimate τˆ2 of the post-announcement trend slope change. P-values
computed using Newey-West heteroskedasticity and autocorrelation robust (HAC) standard errors with 3
lags are in the square brackets. *, ** and *** denote 10%, 5% and 1% significance respectively. Column
(4) reports augmented Dickey-Fuller (ADF) test statistics and p-values using 13 lags (Schwert, 1989).
20The estimated effect of the mandate announcement tends to be larger for provinces
experiencing a surge in cases at the same time (for which we control in It ), namely Alberta,
Saskatchewan and New Brunswick. These provinces also announced their mandates relatively
late (mid-September) and set a relatively short time interval between mandate announcement
and implementation (see Table C1). A larger fraction of eligible unvaccinated people at
the time of mandate announcement is also positively associated with a larger policy effect
estimate. We illustrate these associations in Fig. B8.
As in the results for the countries, the estimates of the base time trend in first doses,
τ1 , are negative for all ten provinces (although not statistically significant in the two small-
est provinces, Newfoundland and Prince Edward Island). The estimates τ̂2 of the post-
announcement change in slope of the time trend are large and statistically significantly
negative for Alberta, New Brunswick, Saskatchewan, and PEI (British Columbia’s estimate
is also negative but not statistically significant). This result is consistent with the mandate
effect on new first doses diminishing over time in these provinces.39
In Table A6, we also present results from two alternative specifications of equation (2):
using log weekly deaths and log average weekly hospitalizations as information, in columns
(1) and (2), and using a binary (instead of weekly-averaged) policy variable Pt . The re-
sults are very similar to our baseline findings in Table 2 and confirm the positive and large
estimated effect of mandate announcements on first dose vaccine uptake.40
5 Counterfactual analysis
We use our estimates of the mandate effect on vaccine uptake from Table 2 to compute
the total increase in new vaccinations for each province and for France, Italy and Germany,
relative to in the counterfactual scenario of absence of mandate. Calling t̂ the mandate
announcement date, we compute the counterfactual log weekly doses per 100,000 people,
Ṽtts iteratively as
Ṽtts = Vt , for all t < t̂ and
(3)
Ṽtts ts
= Vt − π̂Pt − τ̂2 Tta + λ̂1 Ṽt−7 − Vt−7 + λ̂2 Ṽt−14 ts
− Vt−14 , for all t ≥ t̂,
39
We note that with hospitalizations replacing cases as control variable (see column (2) of Table A6),
τ̂2 is negative, albeit sometimes without statistical significance, for all provinces but Manitoba and Nova
Scotia. Estimates for the latter two provinces show very negative τ̂1 , possibly due to the abrupt decrease in
vaccinations about four weeks before their mandate announcements (see Fig. B4). Thus, we cannot rule out
that a negative change in trend may be quite general for Canadian provinces.
40
The policy effect estimates are positive but not statistically significantly different from zero in one
specification in column (1) and 3 specifications in column (3) of Table A6, out of 26 total specifications.
21You can also read