Exploring the causal effect of maternal pregnancy adiposity on offspring adiposity: Mendelian randomisation using polygenic risk scores - BMC Medicine
←
→
Page content transcription
If your browser does not render page correctly, please read the page content below

Bond et al. BMC Medicine      (2022) 20:34
https://doi.org/10.1186/s12916-021-02216-w

 RESEARCH ARTICLE                                                                                                                                    Open Access

Exploring the causal effect of maternal
pregnancy adiposity on offspring adiposity:
Mendelian randomisation using polygenic
risk scores
Tom A. Bond1,2,3,4,5* , Rebecca C. Richmond4,5, Ville Karhunen1,6,7, Gabriel Cuellar-Partida3,8,
Maria Carolina Borges4,5, Verena Zuber1,9, Alexessander Couto Alves1,10, Dan Mason11, Tiffany C. Yang11,
Marc J. Gunter12, Abbas Dehghan1,2, Ioanna Tzoulaki1,2,13, Sylvain Sebert6, David M. Evans3,4,14, Alex M. Lewin1,15,
Paul F. O’Reilly16, Deborah A. Lawlor4,5† and Marjo-Riitta Järvelin1,2,6,17,18†

  Abstract
  Background: Greater maternal adiposity before or during pregnancy is associated with greater offspring adiposity
  throughout childhood, but the extent to which this is due to causal intrauterine or periconceptional mechanisms
  remains unclear. Here, we use Mendelian randomisation (MR) with polygenic risk scores (PRS) to investigate
  whether associations between maternal pre-/early pregnancy body mass index (BMI) and offspring adiposity from
  birth to adolescence are causal.
  Methods: We undertook confounder adjusted multivariable (MV) regression and MR using mother-offspring pairs
  from two UK cohorts: Avon Longitudinal Study of Parents and Children (ALSPAC) and Born in Bradford (BiB). In
  ALSPAC and BiB, the outcomes were birthweight (BW; N = 9339) and BMI at age 1 and 4 years (N = 8659 to 7575).
  In ALSPAC only we investigated BMI at 10 and 15 years (N = 4476 to 4112) and dual-energy X-ray absorptiometry
  (DXA) determined fat mass index (FMI) from age 10–18 years (N = 2659 to 3855). We compared MR results from
  several PRS, calculated from maternal non-transmitted alleles at between 29 and 80,939 single nucleotide
  polymorphisms (SNPs).

* Correspondence: tom.bond@bristol.ac.uk
†
 Deborah A. Lawlor and Marjo-Riitta Järvelin contributed equally to this work.
1
 Department of Epidemiology and Biostatistics, Imperial College London,
London, UK
2
 MRC-PHE Centre for Environment and Health, School of Public Health,
Imperial College London, London, UK
Full list of author information is available at the end of the article

                                         © The Author(s). 2022 Open Access This article is licensed under a Creative Commons Attribution 4.0 International License,
                                         which permits use, sharing, adaptation, distribution and reproduction in any medium or format, as long as you give
                                         appropriate credit to the original author(s) and the source, provide a link to the Creative Commons licence, and indicate if
                                         changes were made. The images or other third party material in this article are included in the article's Creative Commons
                                         licence, unless indicated otherwise in a credit line to the material. If material is not included in the article's Creative Commons
                                         licence and your intended use is not permitted by statutory regulation or exceeds the permitted use, you will need to obtain
                                         permission directly from the copyright holder. To view a copy of this licence, visit http://creativecommons.org/licenses/by/4.0/.
                                         The Creative Commons Public Domain Dedication waiver (http://creativecommons.org/publicdomain/zero/1.0/) applies to the
                                         data made available in this article, unless otherwise stated in a credit line to the data.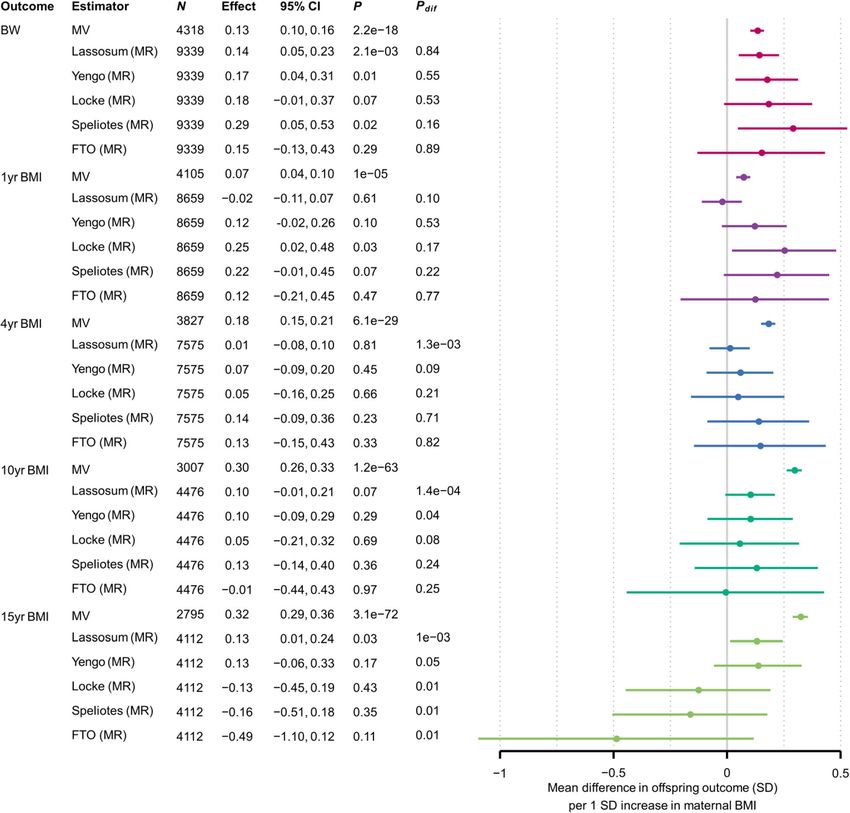
Bond et al. BMC Medicine   (2022) 20:34                                                                           Page 2 of 16

 Results: MV and MR consistently showed a positive association between maternal BMI and BW, supporting a
 moderate causal effect. For adiposity at most older ages, although MV estimates indicated a strong positive
 association, MR estimates did not support a causal effect. For the PRS with few SNPs, MR estimates were statistically
 consistent with the null, but had wide confidence intervals so were often also statistically consistent with the MV
 estimates. In contrast, the largest PRS yielded MR estimates with narrower confidence intervals, providing strong
 evidence that the true causal effect on adolescent adiposity is smaller than the MV estimates (Pdifference = 0.001 for
 15-year BMI). This suggests that the MV estimates are affected by residual confounding, therefore do not provide an
 accurate indication of the causal effect size.
 Conclusions: Our results suggest that higher maternal pre-/early-pregnancy BMI is not a key driver of higher
 adiposity in the next generation. Thus, they support interventions that target the whole population for reducing
 overweight and obesity, rather than a specific focus on women of reproductive age.
 Keywords: Obesity, BMI, Pregnancy, Child, Maternal, Offspring, DOHaD, Mendelian randomisation

Background                                                       previous MR studies were imprecise [14, 23, 24]. For ex-
It has been hypothesised that prenatal exposure to greater       ample, in the largest study (N = 6057), a one standard
maternal adiposity during or prior to pregnancy causes           deviation (SD) higher maternal BMI was associated with
greater adiposity in the offspring throughout life, via intra-   a 0.05 SD increase in mean offspring BMI at age 7, but
uterine effects or periconceptional mechanisms (for ex-          the 95% confidence interval was consistent with a 0.11
ample effects on the oocyte) [1–4]. There are well-              SD reduction or a 0.21 SD increase [23]. If a positive
replicated observational associations between maternal           causal effect is present, this could have important public
body mass index (BMI) before or during pregnancy and             health implications, because it could lead to an acceler-
offspring adiposity and cardiometabolic outcomes in child-       ating intergenerational cycle of obesity that is difficult to
hood, adolescence and adulthood [5–8]. Furthermore, evi-         break [1, 25]. It is therefore important to conduct fur-
dence from animal experiments suggests that such                 ther MR investigations with improved methods, in order
associations are plausibly due to causal biological effects in   to obtain more precise estimates that are not subject to
the intrauterine period [9, 10]. If true, this could have im-    the aforementioned biases.
portant implications for obesity prevention policy, because        We aimed to use maternal non-transmitted allele poly-
interventions to reduce maternal obesity before pregnancy        genic risk scores (PRS) as IVs in a one-sample MR de-
might reduce offspring obesity risk in later life [1, 2, 6].     sign, to explore the causal effect of maternal BMI on
   Triangulated epidemiological evidence from different          offspring adiposity from birth to adolescence, and to
study designs [11] suggests that associations between            compare those results with confounder adjusted multi-
maternal BMI and offspring childhood/adolescent adi-             variable (MV) regression estimates. Because we used
posity may not reflect a causal effect. For example, nega-       only maternal alleles that were not inherited by the off-
tive paternal exposure control studies [12–18] and               spring, we did not need to adjust for offspring or pater-
studies examining associations within sibling groups [19,        nal genotype and thereby avoided biases that may have
20] suggest that confounding by genetic and/or environ-          affected previous studies. We included thousands of gen-
mental factors shared within families may be an import-          etic variants (hereafter referred to as single nucleotide
ant explanation for the associations. In addition, two           polymorphisms [SNPs]) in the PRS, affording increased
Mendelian randomisation (MR) [21, 22] studies, which             precision over previous MR studies which used only
used genetic variants as instrumental variables (IVs) for        genome-wide significant (GWS; P < 5e-8) SNPs [14, 23].
maternal BMI, provided no strong evidence for a causal           Based on previous MR studies [23, 26, 27], we hypothe-
effect [14, 23]. However, in order to avoid bias due to          sised that greater maternal BMI would cause increased
genetic inheritance, the primary analysis in the most re-        offspring birth weight (BW), but that the causal effect
cent MR study [23] was adjusted for an offspring                 would attenuate over childhood and adolescence.
weighted allele score, and simulations suggest that the
use of a weighted allele score may not be the optimal ap-
proach to avoid bias (Personal communication, Wang G,            Methods
Warrington N, Evans DM, 2020). In addition, both pre-            Study design
vious studies [14, 23] were unable to adjust for paternal        We have followed the MR-STROBE reporting guidelines
genetic variants, which may be necessary to avoid col-           in this paper [28]. We conducted one-sample MR and
lider bias [24]. Furthermore, the causal estimates from          compared these results with confounder adjusted
Bond et al. BMC Medicine    (2022) 20:34                                                                     Page 3 of 16

multivariable (MV) regression analyses. We analysed          extracted from the first antenatal clinic records (median
data from two British population based prospective birth     12 weeks’ gestation). Paternal height and weight were re-
cohorts: the Avon Longitudinal Study of Parents and Chil-    ported by the fathers at recruitment, which for the ma-
dren (ALSPAC) and Born in Bradford (BiB). These co-          jority of fathers was at the time of their partner’s
horts are described in Additional file 1: Supplementary      pregnancy.
information S1 [14, 22–24, 29–75] and details of the study
methodology have been reported previously [29–31].           Offspring anthropometric variables
                                                             Offspring outcomes included BW and BMI at age 1 and
Selection of participants                                    4 years (in ALSPAC and BiB), BMI at age 10 and 15
Full details of sample selection for each cohort are given   years (ALSPAC only) and fat mass index (FMI) at age
in Additional file 1: Supplementary information S2, and      10, 12, 14, 16 and 18 years (ALSPAC only). The assess-
selection flow charts are presented in Additional file 1:    ment of these outcomes is described in Additional file 1:
Supplementary information S3. We included live-born          Supplementary information S5 and Additional file 1:
singletons with non-missing data for the variables re-       Supplementary information S6 and included extraction
quired for MR analyses and excluded one offspring from       of measurements from routine data sources (birth re-
any sibling groups present (chosen at random in ALSP         cords/notifications, child health records, primary care re-
AC or to maximise the sample size with data available in     cords and school nurse records), clinical measurement
BiB). As the effects we were exploring may differ by eth-    by research staff or UK Government National Child
nicity [32], we limited analyses to two ethnic groups:       Measurement Programme (NCMP) staff and maternal/
White European and South Asian, which comprised 40%          offspring questionnaire responses. In ALSPAC, we calcu-
and 51% of the sample with offspring genotype data           lated FMI as fat mass (kg) / height (m)2 using fat mass
available respectively. There were very few participants     measured by whole body dual-energy X-ray absorpti-
from other ethnic groups in either cohort. ALSPAC            ometry (DXA) (Additional file 1: Supplementary infor-
(93% White European) contributed only to the analyses        mation S5).
in White Europeans and we meta-analysed these results
with those from models fitted separately for BiB South       Anthropometric variable standardisation
Asians and BiB White Europeans. Derivation of ethnicity      In each of the three samples (ALSPAC, BiB White
variables is described in Additional file 1: Supplementary   Europeans and BiB South Asians) we internally stan-
information S4. The overall sample size for MR analyses      dardised exposure and outcome variables to give
ranged from 2659 to 5085 for ALSPAC, 1566 to 2262            measures in standard deviation (SD) units. We stan-
for BiB South Asians and 1339 to 1992 for BiB White          dardised maternal BMI by maternal age (at delivery),
Europeans. The sample sizes for confounder adjusted          in 1-year age categories. We standardised offspring
MV estimates were somewhat smaller due to missing            BW by sex, and offspring BMI and FMI by sex and
confounder data (1884–3265 for ALSPAC, 325–449 for           age (in one month categories).
BiB South Asians and 442–604 for BiB White Euro-
peans). To enable comparison between the confounder          Confounder adjusted multivariable regression
adjusted MV estimates from models that adjusted for          We considered the following variables to be potential
different covariates, we fitted all the models for each      confounders: maternal age (which was adjusted for in
outcome using an identical sample with non-missing           the standardised exposure by calculating z-scores within
data for all relevant variables.                             maternal age strata), parity, maternal smoking during
                                                             pregnancy, parental occupation, maternal educational at-
Parental anthropometric variables                            tainment, paternal educational attainment and paternal
In ALSPAC, maternal pre-pregnancy weight and height          BMI. Standard protocols for assessing these variables
were retrospectively reported by the women during            were used in each cohort, and full details are provided in
pregnancy (at a mean gestational age of 24.7 weeks [SD       Additional file 1: Supplementary information S7. We fit-
6.3]) or postnatally for 11.2% of mothers (at a mean of      ted three MV regression models: in model one, we ad-
22.0 weeks after birth [SD 6.7]). The reported weights       justed for maternal age, offspring age and offspring sex;
correlated highly with weight recorded at the first ante-    in model two, we additionally adjusted for the potential
natal clinic (Pearson correlation coefficient = 0.96). Pa-   confounders listed above except for paternal BMI; and
ternal height and weight were reported by the fathers        in model three (which was the main multivariable model
during their partner’s pregnancy (or postnatally for a mi-   of interest and is presented in the “Results” section), we
nority of fathers). In BiB, early pregnancy BMI was cal-     additionally adjusted for paternal BMI. We took a
culated from height reported by the mothers at               complete case approach and excluded individuals with
recruitment (26–28 weeks gestation) and weight               any missing data; therefore, models one to three were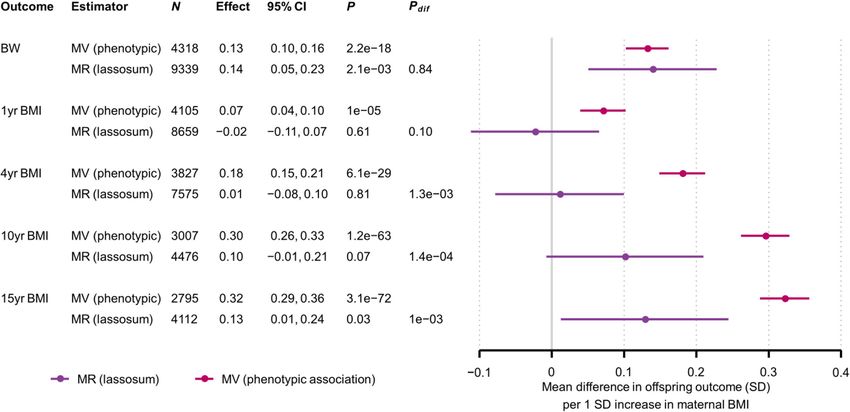
Bond et al. BMC Medicine   (2022) 20:34                                                                        Page 4 of 16

fitted using identical samples. In sensitivity analyses, we   from which we calculated maternal PRS, having first es-
adjusted all models for gestational age at delivery, and      timated SNP weights using maternal genotypes (see
for 20 genetic principal components (PCs) which we cal-       below).
culated from genome-wide SNPs separately for each of
the three samples (Additional file 1: Supplementary in-       Polygenic risk score (PRS) calculation
formation S8), in order to adjust for ancestry. In BiB, we    Previous MR studies followed the widely used practice
had to exclude a large number of individuals from the         of using up to 97 GWS (P < 5e−8) SNPs, but for poly-
main MV models due to missing paternal BMI data. We           genic traits such as BMI, it is known that substantially
therefore refitted models one and two without first ex-       improved phenotypic prediction can be achieved by in-
cluding individuals with missing paternal BMI data (i.e.      cluding many more SNPs in the genetic risk score (i.e.
on larger samples), in order to explore potential selec-      more weakly associated SNPs that individually are not
tion bias.                                                    GWS) [61, 77–79]. In order to maximise statistical
                                                              power, we used thousands of genome-wide SNPs to cal-
Genotyping, quality control and imputation                    culate a BMI PRS, as a weighted sum of BMI-increasing
Mothers, offspring and (in ALSPAC only) fathers were          maternal non-transmitted alleles at SNPs across the gen-
genotyped using genome-wide arrays, followed by stand-        ome. We tested four PRS methods (clumping and
ard quality control (QC) measures (Additional file 1:         thresholding [80], LDPred [52], lassosum [53, 81] and
Supplementary information S9). Array genotypes were           the BOLT-LMM linear predictor [54]) (Additional file 1:
then imputed to the Haplotype Reference Consortium            Supplementary information S11 provides further infor-
(HRC), 1000 Genomes or UK10K reference panels [46–            mation for each of these). Of these four methods, lasso-
48] (Additional file 1: Supplementary information S9). In     sum explained the highest proportion of variance (R2)
order to maximise the sample size, we did not exclude         for maternal BMI in both ALSPAC and BiB (which we
cryptically related individuals for the primary analyses.     refer to as the target datasets); therefore, we used the
As a sensitivity analysis, we removed cryptic relatedness     lassosum PRS for subsequent MR analyses. Lassosum re-
at a level corresponding to first cousins (dropping 6.7%,     quires summary statistics from a genome-wide associ-
13.5% and 9.1% of individuals in ALSPAC, BiB South            ation study (GWAS), which we refer to as the base
Asians and BiB White Europeans respectively) by apply-        dataset. We conducted a GWAS in the UK Biobank
ing a KING [48] kinship coefficient threshold of 0.044 to     (UKB), a prospective cohort of 502,628 volunteers (with
the offspring using the PLINK software package version        5% response rate of those invited), recruited from across
2.00 [49, 50].                                                the UK at age 40–69 years between 2006 and 2010 [58,
                                                              82] (Additional file 1: Supplementary information S11).
Inference of maternal non-transmitted alleles                 In order to avoid overfitting due to overlap between the
Our MR analyses used maternal PRS as IVs for maternal         base and target samples, we excluded attendees of the
pre-pregnancy BMI. MR assumes that the IV is only as-         Bristol (where ALSPAC participants would have
sociated with the outcome via its association with the        attended) or Leeds (where Born in Bradford participants
exposure (Additional file 1: Supplementary information        would have attended) UKB assessment centres. We
S10). For this to be true, the maternal PRS must be inde-     meta-analysed the summary statistics from the UKB
pendent of the offspring’s genotype, but due to genetic       GWAS with a published BMI GWAS from the GIANT
inheritance this is not the case for PRS calculated in the    consortium [60, 83], giving a total base sample size of up
usual way from all maternal alleles. We therefore calcu-      to 756,048. We applied the lassosum algorithm to the
lated maternal PRS from only those maternal alleles that      meta-analysed base dataset; lassosum uses penalised re-
were not inherited by the offspring (maternal non-            gression to carry out shrinkage and selection on the base
transmitted alleles [34]). After conversion of imputed ge-    GWAS SNP effects and accounts for LD information
notypes to hard calls (integer valued allele dosages) and     from a reference panel. We used the ALSPAC or BiB
application of QC filters (Additional file 1: Supplemen-      datasets as the reference panels as per the authors’ rec-
tary information S9), we phased offspring imputed SNPs        ommendations) [53]. PLINK was used to calculate the
(for the sample of genotyped mother-offspring duos)           PRS for ALSPAC and BiB individuals using the lassosum
using the duoHMM method implemented in the SHA-               SNP weights for around 80,000 SNPs (see Table 2 for
PEIT v2 (r904) software package, with a window size of        the exact number of SNPs for each cohort). We also cal-
5 Mb as per the authors recommendations for parent-           culated three PRS from fewer SNPs, to be used in sensi-
offspring duos [76]. This yielded maternal transmitted        tivity analyses to explore potential pleiotropic effects (we
alleles (i.e. maternal alleles that were inherited by the     would expect that the risk of pleiotropic bias might de-
offspring), which we used (along with the maternal ge-        crease as fewer SNPs are included in the IV; see below).
notypes) to infer the maternal non-transmitted alleles,       These PRS used (i) around 30 GWS SNPs identified in a
Bond et al. BMC Medicine (2022) 20:34 Page 5 of 16
2010 BMI GWAS [67], (ii) around 90 GWS SNPs identi- mixed model (LMM). LMMs have been widely used in
fied in a 2015 BMI GWAS [60] and (iii) around 500 GWAS to adjust for population stratification and cryptic re-
GWS SNPs identified as primary signals in a 2018 BMI latedness [71]. We fitted models for the numerator and de-
GWAS [61]. Full details of these analyses, including the nominator of the ratio estimator separately, using the
exact number of SNPs used to calculate each PRS --reml-est-fix command in the GCTA software package
(which varied between samples), are given in Additional (version 1.91.7beta) [43]. Further details of the LMM ap-
file 1: Supplementary information S12. proach are given in Additional file 1: Supplementary infor-
mation S15. Finally, we conducted several analyses to
Mendelian randomisation explore whether the maternal PRS influences offspring adi-
For the primary MR analyses, we used the lassosum posity via mechanisms other than intrauterine or pericon-
non-transmitted allele BMI PRS as an IV for maternal ceptional exposure to increased maternal BMI (horizontal
BMI and fitted models using the two-stage least squares pleiotropy). We first tested for associations of the PRS with
(TSLS) method [22] (i.e. one sample MR). Additional file other potential risk factors for the offspring outcomes [85].
1: Supplementary information S10 shows our MR ana- We would expect that the risk of pleiotropic bias might de-
lyses diagrammatically. We included 20 genetic PCs as crease as fewer SNPs are included in the IV. We therefore
covariates in order to adjust for population stratification. repeated MR analyses with IVs calculated from a single
We tested for a difference between the most extensively BMI-associated SNP (rs9939609 at the FTO locus, the locus
confounder adjusted MV estimates (model three) and at which there is currently the strongest evidence for associ-
MR estimates using a z-test (Additional file 1: Supple- ation with BMI [61]), as well as the three PRS calculated
mentary information S13) and used a bootstrapping pro- from only strongly BMI-associated (GWS) SNPs, as de-
cedure to estimate the covariance between MV and MR scribed above. Furthermore, most of the SNPs included in
estimates in order to calculate the z-statistic. Evidence the lassosum BMI PRS had small effect sizes, and the con-
for a difference between the two could reflect residual sequences of this for the extent of horizontal pleiotropic ef-
confounding in the MV analyses or violation of one or fects are unclear [72], so we explored how MR estimates
more of the MR assumptions. varied with varying SNP effect size distributions. We also
tested for evidence of between-SNP MR estimate hetero-
Meta-analysis
geneity (Cochran’s Q test) and used MR Egger regression
We examined the point estimates, I2 statistics and [74] to investigate horizontal pleiotropy, for the analyses
Cochran’s Q test P-values for the MV and MR associa- based on GWS SNPs. Finally, to investigate collider bias
tions and found little evidence for heterogeneity between and bias due to assortative mating, we examined the associ-
ALSPAC, BiB South Asians and BiB White Europeans ation between the maternal and paternal lassosum BMI
(Additional file 1: Supplementary information S14). We PRS, in the subset of ALSPAC participants with paternal
therefore meta-analysed estimates from the three sam- genotype data available (N = 1325).
ples using a fixed effects model. Results were similar
Other sensitivity analyses
when we instead used a random effects model. For the
meta-analyses, we used the ratio estimator (calculated as We explored departure from linearity of the MV and
the meta-analysed PRS-outcome regression coefficient MR associations by examining augmented partial re-
^ divided by the meta-analysed PRS-exposure regres- sidual plots with overlaid linear regression lines and
β ZY nonparametric loess smoothers [86]. The residuals from
sion coefficient β^ ; in the present study, both coeffi-
ZX several models involving adolescent BMI and FMI vari-
cients were estimated in the same sample) which gives ables were somewhat positively skewed so we repeated
equivalent results to TSLS [84]. We calculated the stand- MV and MR analyses using the natural log of the rele-
ard errors for the pooled MR estimates using a Taylor vant variables. We examined whether results differed for
series approximation [70]. BW, BMI and ponderal index (weight [kg] / length [m]3)
at birth (in ALSPAC only as birth length was not avail-
Checking MR assumptions able in BiB). Finally, we tested for interaction by off-
We checked the assumptions made by MR analyses spring sex for the MV and MR models. We carried out
(Additional file 1: Supplementary information S10); if statistical analyses in R version 3.5.1 [87], and Stata ver-
these assumptions are met, then our MR estimates can sion 13.1 (StataCorp, College Station, TX, USA).
be interpreted as causal effect estimates [22]. We first
assessed whether the PRS were associated with maternal Results
BMI using the R2 and F-statistics. Next, we explored Participant characteristics
whether the PRS-outcome associations were confounded Table 1 shows the participant characteristics. The preva-
by ancestry (population stratification) using a linear lence of maternal obesity (maternal BMI ≥ 30) was 5.5%Bond et al. BMC Medicine (2022) 20:34 Page 6 of 16
Table 1 Characteristics of the mothers and offspring in ALSPAC and BiB
ALSPAC BiB (WE) BiB (SA)
Mean SD N Female Mean SD N Female Mean SD N Female
offspring (%) offspring (%) offspring (%)
Maternal BMI (kg/m2) 23.0 3.8 26.9 6.0 25.8 5.5
Maternal age (years) 29.3 4.5 27.4 6.0 28.8 5.0
Birth weight (z score) 0.10 0.95 5085 50.5 − 0.05 0.97 1992 47.9 − 0.56 0.92 2262 47.9
Gestational age (weeks) 39.6 1.7 39.4 1.6 39.1 1.5
1-year weight for length percentilea 0.64 0.27 4838 50.6 0.61 0.28 1798 47.8 0.48 0.30 2023 48.1
Age at measurement (years) 0.9 0.2 0.8 0.3 0.8 0.3
4-year BMI (z score) 0.46 1.05 4670 50.2 0.50 0.97 1339 48.6 0.10 1.21 1566 48.5
Age at measurement (years) 4.1 0.7 4.5 0.7 4.5 0.7
10-year BMI (z score) 0.26 1.12 4476 51.3
Age at measurement (years) 9.9 0.5
15-year BMI (z score) 0.30 1.11 4112 51.7
Age at measurement (years) 15.0 0.8
SA South Asians, WE White Europeans, SD standard deviation, z score: sex- and gestational age-adjusted standard deviation score (UK-WHO Growth Reference
[88]). aSex-adjusted percentile calculated using the WHO Child Growth Standards [89]. All z scores and percentiles were calculated via the zanthro Stata package
[90]. Data for absolute values (as opposed to z scores) are presented in Additional file 1: Supplementary information S18
(95% confidence interval [CI]: 4.9%, 6.1%) in ALSPAC parity and paternal BMI (results are summarised in
and markedly higher in BiB South Asians (20.5% [95% Table 2, and full regression results including the direc-
CI: 18.9%, 22.2%]) and BiB White Europeans (26.0% tion of associations are given in Additional file 1: Sup-
[95% CI: 24.1%, 28.0%]). The samples for our analyses plementary information S20–S23).
were smaller than those for the full cohorts at birth due
to missing data, particularly for the MV associations. Associations of maternal BMI PRS with confounders/
Despite this there were not large differences in the dis- outcome risk factors
tributions of BW, maternal BMI or offspring sex be- Genetic IVs based on fewer SNPs (i.e. < 100 SNPs) were
tween the baseline samples and those from which we generally not associated with the outcome risk factors.
calculated the MV estimates (Additional file 1: Supple- In ALSPAC however, there was strong evidence for as-
mentary information S16). Furthermore, when we fitted sociation of the lassosum IV (based on 80,939 SNPs)
MV models one and two on a larger sample (retaining with parental occupation, parental educational attain-
individuals with missing paternal BMI), there were not ment, parental age, maternal smoking and paternal BMI.
large differences in the primary MV results (Additional These associations were mostly present for BiB White
file 1: Supplementary information S17). Europeans but absent for BiB South Asians.
Associations of genetic IVs with maternal BMI and Confounder adjusted MV regression
offspring genotype In confounder adjusted MV regression models, maternal
As we included more SNPs in the IV the R2 for maternal BMI was positively associated with all offspring out-
BMI increased markedly, from < 1% for the FTO IV to comes (Fig. 1, Additional file 1: Supplementary informa-
~ 3–7% for the lassosum IV (Table 2). First-stage F-sta- tion S24; meta-analysis heterogeneity statistics are given
tistics were > 75 for all lassosum MR models (Additional in Additional file 1: Supplementary information S14). Es-
file 1: Supplementary information S19). The lassosum timates for the SD scale increase in offspring outcomes
maternal non-transmitted allele BMI PRS was not corre- associated with a 1 SD higher age-adjusted maternal
lated with the offspring’s PRS (results available from the BMI ranged from 0.07 (95% CI: 0.04, 0.10) for 4-year
authors on request). BMI to 0.32 (95% CI: 0.29, 0.36) for 15-year BMI, and
MV estimates for 10–18-year FMI were similar to those
Associations of maternal BMI with confounders/outcome for 15-year BMI. Adjustment for potential confounders
risk factors had a negligible impact on the estimates, aside from a
There was strong evidence in all three samples for asso- small attenuation on adjustment for paternal BMI for
ciations between maternal BMI and several other poten- outcomes after birth. Results were similar when we refit-
tial risk factors for the offspring outcomes, including ted MV models one and two on larger samples without
parental occupation, educational attainment, maternal excluding individuals with missing paternal BMI dataBond et al. BMC Medicine (2022) 20:34 Page 7 of 16
Table 2 Associations of maternal BMI with outcome risk factors, and of the genetic IVs (maternal non-transmitted alleles) with
maternal BMI and outcome risk factors
N SNPs R2maternal Correlation with outcome risk factorsa
BMI
Parental Maternal Paternal Maternal Parity Paternal Maternal Paternal
occupation education education smoking BMI age age
ALSPAC
N 5157 4807 4826 4572 4891 5042 3766 5157 3593
Maternal BMIb 0.11*** − 0.12*** − 0.11*** − 0.01 0.06** 0.16*** 0.00c − 0.01c
Genetic IV
FTO 1 0.36% 0.03* − 0.01 − 0.01 0.00 0.02 − 0.01 − 0.01 0.00
Speliotes 31 0.89% 0.02 0.00 − 0.03* − 0.01 0.02 0.01 0.00 0.01
Locke 87 1.02% 0.03 − 0.01 − 0.04* − 0.01 0.03* 0.01 0.00 0.00
Yengo 497 2.37% 0.04* − 0.04* − 0.05** 0.02 0.03 0.01 − 0.02 − 0.01
Lassosum 80939 6.61% 0.08*** − 0.07*** − 0.08*** 0.07*** 0.02 0.03* − 0.08*** − 0.06**
BiB (SA)
N 2267 1689 2259 2258 2262 2215 475 2267 583
Maternal BMI b
− 0.10** − 0.08** − 0.03 0.01 0.15*** 0.12* − 0.02 c
0.02c
Genetic IV
FTO 1 0.77% − 0.01 − 0.01 0.00 − 0.03 0.00 0.00 0.02 0.06
Speliotes 29 1.71% − 0.01 0.01 0.01 − 0.04 0.00 − 0.01 0.00 − 0.05
Locke 82 1.33% − 0.04 0.02 0.03 − 0.05* − 0.01 − 0.06 0.00 0.02
Yengo 446 1.64% − 0.04 − 0.04* 0.01 0.01 0.01 − 0.03 − 0.02 − 0.03
Lassosum 79101 3.46% − 0.01 − 0.02 − 0.02 0.01 − 0.02 − 0.04 − 0.04 − 0.06
BiB (WE)
N 2000 1587 2000 1999 1999 1951 639 2000 788
Maternal BMIb − 0.09** − 0.07* 0.01 0.01 0.11*** 0.22*** 0.00c 0.04c
Genetic IV
FTO 1 0.56% 0.03 0.02 − 0.01 0.00 0.00 0.03 0.00 − 0.02
Speliotes 31 0.92% 0.05 0.01 0.03 − 0.03 0.00 0.02 0.00 − 0.01
Locke 86 1.16% 0.03 0.00 0.04 − 0.01 − 0.01 0.04 − 0.02 − 0.02
Yengo 453 1.78% − 0.01 0.00 0.05* 0.01 0.00 0.00 − 0.03 0.00
Lassosum 79101 5.21% − 0.08* − 0.05* 0.04 0.07* 0.04 0.03 − 0.07* 0.01
a
Pearson correlation coefficients are presented here to give an indication of the direction and magnitude of associations; full regression results are presented in
Additional file 1: Supplementary information S16–S19, * P < 0.05, ** P < 0.001, *** P < 1e−5. bAge-standardised z-scores for maternal BMI, as per the primary
analyses. cMaternal BMI is not correlated with maternal or paternal age because it was age-standardised. SA South Asians, WE White Europeans, R2 proportion of
maternal BMI variance explained by the IV (maternal non-transmitted allele scores), FTO rs9939609 at the FTO locus, Speliotes, Locke, Yengo PRS calculated from
SNPs that reached genome-wide significance in the BMI GWAS with the indicated first author, Lassosum PRS calculated by the lassosum method
(Additional file 1: Supplementary information S17). Add- for 1-year BMI and 4-year BMI were − 0.02 (− 0.11,
itional adjustment for gestational age at birth or 20 gen- 0.07) and 0.01 (− 0.08, 0.10) respectively, and there was
etic PCs had a negligible effect (Additional file 1: moderate to strong evidence for an MR-MV difference
Supplementary information S25, S26), and there was not (Pdifference = 0.10 and 1.3e−3 respectively). The MR esti-
a large difference when BMI or ponderal index at birth mates for 10- and 15-year BMI in ALSPAC (0.10 [−
was substituted for BW in ALSPAC (Additional file 1: 0.01, 0.21] and 0.13 [0.01, 0.24] respectively) were also
Supplementary information S27). smaller than the MV estimates (Pdifference = 1.4e−4 and
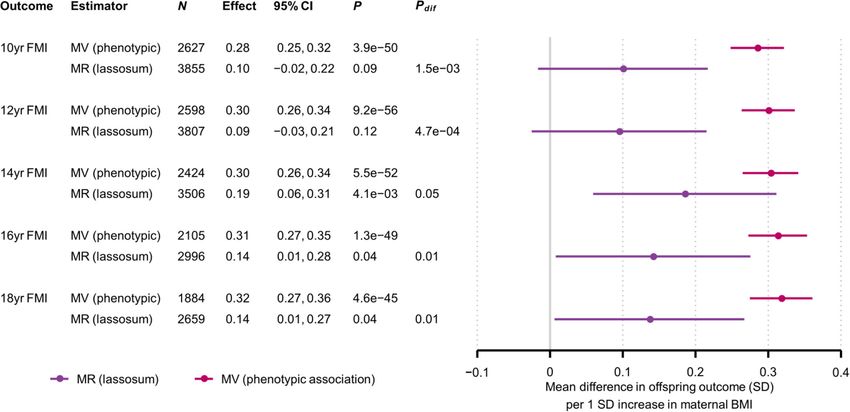
1.0e−3 respectively). Results for adolescent FMI (Fig. 2)
MR results were similar to those for adolescent BMI: MR estimates
For BW the MR estimate for the lassosum PRS for all ranged between 0.09 and 0.19, and there was strong evi-
three samples meta-analysed was 0.14 (0.05, 0.23), which dence that the MR estimates were smaller than the MV
was similar to the MV estimate (Pdifference (MV vs. MR) = estimates, with Pdifference ranging between 0.05 and 4.7e
0.84) (Fig. 1). The corresponding lassosum MR estimates −4). We did not observe strong evidence for non-Bond et al. BMC Medicine (2022) 20:34 Page 8 of 16 Fig. 1 Mean difference in offspring BW and BMI (SD) per 1SD increase in maternal BMI, from MR (lassosum) and confounder adjusted multivariable regression (MV) models. Confounder adjusted multivariable regression (MV) estimates are from model three (see the “Methods” section). N, number of participants. The number of SNPs used for the MR analyses is provided separately by cohort in Table 1. P, P-value for the null hypothesis that the effect equals zero; Pdif, P-value for the null hypothesis that MR effect equals the MV effect Fig. 2 Mean difference in offspring FMI (SD) per 1SD increase in maternal BMI, from MR (lassosum) and confounder adjusted multivariable regression (MV) models. Confounder adjusted multivariable regression (MV) estimates are from model three (see the “Methods” section). N, number of participants. The number of SNPs used for the MR analyses is provided separately by cohort in Table 1. P, P-value for the null hypothesis that the effect equals zero; Pdif, P-value for the null hypothesis that MR effect equals the MV effect
Bond et al. BMC Medicine   (2022) 20:34                                                                       Page 9 of 16

linearity or interaction by sex for either the MV or MR       95% CI: 0.16, 0.28, P = 7.9e−14), but no evidence for
models (results available from the authors), and results      correlation between maternal non-transmitted allele and
were similar when we (i) substituted BMI or ponderal          paternal lassosum BMI PRS (r: 0.02, 95% CI: −0.04, 0.07,
index at birth for BW (Additional file 1: Supplementary       P = 0.55). For comparison, a maternal lassosum BMI
information S28), (ii) natural log transformed skewed         PRS that was calculated from both transmitted and non-
variables (results available from the authors), (iii) re-     transmitted alleles was slightly more strongly correlated
moved cryptic relatedness from the sample (results avail-     with the paternal PRS (r: 0.04, 95% CI: −0.01, 0.10, P =
able from the authors) and (iv) used linear mixed             0.14).
models to adjust for population structure (Additional file
1: Supplementary information S29). In linear regression       Discussion
models (as opposed to two-stage least squares regres-         We applied a Mendelian randomisation (MR) approach
sion), there was strong to moderate evidence that the         using PRS calculated from maternal non-transmitted al-
lassosum maternal non-transmitted allele BMI PRS was          leles, to explore the causality of associations between
associated with offspring BW and adolescent adiposity         maternal pre-/early-pregnancy BMI and offspring birth
(Additional file 1: Supplementary information S30, S31).      weight (BW) and child/adolescent adiposity. For the as-
                                                              sociation between maternal BMI and offspring BW, our
MR estimates for IVs with fewer SNPs                          MR and confounder adjusted multivariable regression
When we replaced the lassosum PRS with alternative            (MV) estimates were similar. In contrast, for offspring
IVs calculated from fewer SNPs, our MR estimates var-         adiposity outcomes beyond 1 year of age (including BMI
ied in a manner that was specific to the offspring out-       and DXA-determined FMI), the MR estimates were
come (Figs. 3 and 4). For BW, including fewer SNPs in         weaker than the MV estimates. These results markedly
the IV did not result in large differences in the MR esti-    strengthen the evidence that confounder adjusted obser-
mates, although the precision reduced markedly as we          vational associations between maternal BMI and off-
used fewer SNPs. For 1- and 4-year BMI, MR estimates          spring adolescent adiposity are subject to residual
increased as we used fewer SNPs, whereas for 10-year          confounding. We found no strong evidence for a causal
BMI they largely remained stable and for 15-year BMI          effect of maternal BMI on offspring adiposity beyond
they decreased. The patterns for adolescent FMI were          birth, although based on the present results we cannot
similar to those for adolescent BMI. For outcomes apart       rule out a small to moderate causal effect.
from BW and 1-year BMI, including more SNPs in the              Our data build on two previous MR studies which in-
IV generally resulted in stronger evidence that MR esti-      vestigated associations between maternal BMI and off-
mates differed from MV estimates (i.e. smaller Pdif).         spring child/adolescent adiposity [14, 23], and a
                                                              methodological paper which presented a limited investi-
MR estimates for SNPs with differing effect size              gation of adiposity outcomes as an empirical example
distributions, between-SNP heterogeneity and MR Egger         [24]. Although the previous studies provided no strong
results                                                       evidence for a causal effect, they were limited by wide
For the majority of outcomes (particularly in adoles-         confidence intervals and/or potential biases (see the
cence), there was moderate to strong statistical evidence     “Strengths and limitations” section). The present study
that SNPs with smaller effect sizes gave larger (more         overcame these limitations by using more powerful PRS
positive) MR estimates (P = 4.0e−3, 2.6e−2, 1.8e−2 and        and a maternal non-transmitted allele score approach.
4.7e−4 for 15-year BMI, 14-year FMI, 16-year FMI and          For the association between maternal BMI and offspring
18-year FMI respectively), and this was not driven by         BW, our MR and MV estimates were highly concordant,
weak instrument bias (Additional file 1: Supplementary        in agreement with previous MR studies that supported a
information S32). When using only large-effect (GWS)          causal effect of greater maternal BMI on greater off-
SNPs, in general (and in light of the 40 statistical tests    spring BW [26, 27]. We have previously shown that gen-
carried out), there was not strong statistical evidence for   etic confounding (i.e. confounding due to direct effects
between-SNP MR estimate heterogeneity (all Cochran’s          of maternal alleles inherited by the offspring) is unlikely
Q test P-values ≥0.017), nor was there strong evidence        to explain the association of maternal BMI with BW, but
that the MR-Egger intercept differed from zero (all MR-       may potentially be important for the association with
Egger intercept P-values ≥0.023) (Additional file 1: Sup-     adolescent BMI [40]. The present results are consistent
plementary information S33).                                  with this, as well as with the balance of evidence from
                                                              negative paternal exposure control studies [12–18] and
Parental phenotypic and PRS correlations                      within sibship analyses [19, 20], which suggests that fa-
In ALSPAC, there was strong evidence for correlation          milial confounding is an important explanation of the
between maternal and paternal BMI (Pearson’s r: 0.22,         maternal BMI-offspring child/adolescent adiposity
Bond et al. BMC Medicine (2022) 20:34 Page 10 of 16 Fig. 3 Mean difference in offspring BW and BMI (SD) per 1SD increase in maternal BMI, from MR models using different SNP sets and confounder adjusted multivariable regression (MV) models. Confounder adjusted multivariable regression (MV) estimates are from model three (see the “Methods” section). N, number of participants. The number of SNPs used for the MR analyses is provided separately by cohort in Table 1. P, P- value for the null hypothesis that the effect equals zero; Pdif, P-value for the null hypothesis that MR effect equals the MV effect; FTO, rs9939609 at the FTO locus; Speliotes, Locke, Yengo, GWS SNPs from the GWAS with the indicated first author; Lassosum, PRS calculated by the lassosum method. Colours denote outcomes association. Studies that examined the effect of extreme were greater than zero for 15-year BMI and 14–18-year maternal obesity using a pre- and post-bariatric surgery FMI. We do not interpret these as unbiased estimates for design [91–94] have small sample sizes and have not the causal effect of maternal BMI, because of the possibility been entirely consistent, therefore do not provide strong of pleiotropic bias (see below). These results do suggest evidence against this conclusion. however that some maternal exposure(s) that are correlated Although we found no strong evidence for a causal effect with the maternal BMI PRS have a causal effect on off- in late childhood/adolescence, we cannot rule out a small spring child/adolescent adiposity, although our analyses are to moderate causal effect, due to the imprecision of our unable to distinguish whether this is a pre or postnatal ef- MR estimates. Indeed, the primary lassosum MR estimates fect. Plausible mechanisms include intrauterine effects such
Bond et al. BMC Medicine        (2022) 20:34                                                                                               Page 11 of 16

 Fig. 4 Mean difference in offspring FMI (SD) per 1SD increase in maternal BMI, from MR models using different SNP sets and confounder
 adjusted multivariable regression (MV) models. Confounder adjusted multivariable regression (MV) estimates are from model three (see the
 “Methods” section). N, number of participants. The number of SNPs used for the MR analyses is provided separately by cohort in Table 1. P, P-
 value for the null hypothesis that the effect equals zero; Pdif, P-value for the null hypothesis that MR effect equals the MV effect; FTO, rs9939609 at
 the FTO locus; Speliotes, Locke, Yengo, GWS SNPs from the GWAS with the indicated first author; Lassosum, PRS calculated by the lassosum
 method. Colours denote outcomes

as fetal overnutrition [1] and postnatal effects such as ma-                  investigation in other datasets, particularly as previous stud-
ternal influence on offspring eating behaviour [95], but                      ies have not found evidence for parental genetic effects on
other mechanisms have been hypothesised, including peri-                      BMI in childhood [96] or adulthood [97].
conceptional effects (such as altered oocyte structure or                        In ALSPAC and BiB White Europeans, we observed
function [3]). In linear regression analyses, we found mod-                   associations between the maternal BMI PRS and poten-
erate to strong evidence for associations between the ma-                     tial confounders, including parental occupation, educa-
ternal non-transmitted allele BMI PRS and offspring                           tion, age and maternal smoking. These results invite
adolescent adiposity (including BMI and DXA-determined                        careful consideration of which of the ever-increasing
FMI). These observed maternal genetic effects merit further                   number of GWS associated BMI SNPs are likely (in
Bond et al. BMC Medicine    (2022) 20:34                                                                        Page 12 of 16

combinations) to be the most valid instruments for MR            the potential pleiotropic bias away from zero, illustrates
studies, having taken account of all IV assumptions.             the benefit of our approach.
                                                                    We also conducted extensive sensitivity analyses to ex-
                                                                 plore other potential biases in our results. When we
Strengths and limitations                                        used a linear mixed model (LMM) to adjust for popula-
Our study has several key strengths. We studied two pro-         tion structure, the results were similar to our primary es-
spective birth cohorts with maternal and offspring genome-       timates. We did not remove cryptic relatedness for our
wide genotype data, maternal BMI measurements and off-           primary analyses, in order to maximise the sample size
spring adiposity outcomes available, allowing us to conduct      and because the LMM controls for bias due to cryptic
mother-offspring MR analyses. We used state-of-the-art           relatedness [71]. However, results were similar when we
methods to calculate a powerful PRS from around 80,000           removed cryptic relatedness at a level corresponding to
SNPs. This yielded a substantial increase in statistical power   first cousins. Finally, we found no strong evidence that
over previous MR studies, which analysed similar ALSPAC          maternal and paternal lassosum BMI PRS were corre-
datasets to ours, but employed either a single SNP in the        lated, suggesting that our results are not importantly
FTO gene [14] or allele scores calculated from up to 97          biased due to assortative mating.
SNPs [23, 24] (similar to the “Speliotes” and “Locke” IVs in        We acknowledge several limitations of our study. First,
the present analysis). Our primary lassosum PRS explained        although the results in BiB and ALSPAC were similar,
3–7% of maternal BMI variance, compared to ~ 1.5% for            replication in other cohorts with suitable data, and in
the strongest IVs used previously (power calculations are        particular with adolescent adiposity measures (which we
given in Additional file 1: Supplementary information S34).      could only examine in ALSPAC) would be valuable. A
   Another strength over previous work is our use of ma-         previous study meta-analysed data from ALSPAC and
ternal non-transmitted allele PRS, thereby avoiding the          the Generation R cohort using 32 maternal SNPs [23],
need to control for genetic inheritance by adjusting for         but we were unable to extend our approach to Gener-
offspring genotype. A previous methodological paper              ation R due to the unavailability of maternal genome-
made use of this approach [24], but conducted a much             wide SNP data. Additional file 1: Supplementary infor-
more limited analysis of a far smaller subset of adiposity       mation S35 compares the present analysis to previous
outcomes than that which we have explored here. Con-             analyses of ALSPAC data. We have only studied UK par-
trolling for offspring genotype may be suboptimal for            ticipants. However, the similarity of findings between
two distinct reasons: (i) it may introduce collider bias if      White European and South Asian BiB participants, and
paternal genotype influences the offspring outcome in-           between BiB (a cohort with high levels of deprivation
dependently of offspring genotype (i.e. if paternal genetic      born during the obesity epidemic) and ALSPAC (more
effects exist) [24, 35] and (ii) if the investigator adjusts     affluent than the UK average) suggest that our findings
for a weighted allele score, this may introduce bias by in-      may be generalisable to other populations. Second, BMI
adequately blocking the genetic inheritance path (Per-           (especially self-reported BMI) is an imperfect proxy
sonal communication, Wang G, Warrington N, Evans                 measure for adiposity. However, it has been shown pre-
DM, 2020). Because these two biases may be in opposite           viously in ALSPAC that self-reported pre-pregnancy
directions, the net direction of any bias affecting the lar-     BMI is strongly correlated with BMI measured in early
gest previous study [23] is uncertain. We acknowledge            pregnancy [23], and that any misreporting does not
that our primary MR estimates may be affected by pleio-          markedly differ by mean weight [98]. There is also evi-
tropic bias due to the large number of SNPs, many of             dence that the correlation with directly measured adi-
which had small effect sizes, that we used to calculate          posity is strong for child and adult BMI [99, 100] and
the PRS. This possibility is also suggested by the associa-      moderate for neonatal weight [101]; furthermore, our re-
tions that we observed between the lassosum BMI PRS              sults were similar for DXA derived FMI. Third, we as-
and several potential confounders of the maternal BMI-           sumed that causal relationships between exposures and
offspring adiposity association. However, sensitivity ana-       outcomes were linear. Although our data provided no
lyses suggested that for most outcomes, pleiotropic bias         evidence for non-linearity, a slight plateauing of the ob-
is likely to be away from zero, which would weaken the           servational association between maternal BMI and off-
apparent evidence for an MR-MV difference (Additional            spring child/adolescent BMI at higher maternal BMI
file 1: Supplementary information S32, S33). Thus, our           levels was previously observed in a large meta-analysis
primary MR results are conservative, in that they may            [6]. MR estimates such as ours, which assume linearity,
overstate the size of the causal effect (which we hypothe-       nevertheless approximate the population-averaged causal
sised to be zero). The fact that for 10-and 15-year BMI,         effect (which is the average effect resulting from a unit
using more SNPs yielded increased precision and stron-           increase in the exposure for all individuals in the popula-
ger evidence for an MR-MV difference (Fig. 2), despite           tion, regardless of their initial exposure level) [102].
Bond et al. BMC Medicine (2022) 20:34 Page 13 of 16
However, given the shape of the observational associ- data. We gratefully acknowledge the GIANT (Genetic Investigation of
ation [6], it is plausible that our MR estimates overstate ANthropometric Traits) Consortium for making GWAS summary statistics
available. This publication is the work of the authors and may not reflect the
the true causal effect for mothers with overweight/obes- views of those acknowledged here. Where authors are identified as
ity. Finally, the samples used for some of our analyses personnel of the International Agency for Research on Cancer / World Health
(particularly for MV models) were smaller than the full Organization, the authors alone are responsible for the views expressed in
this article and they do not necessarily represent the decisions, policy or
samples at baseline due to missing data and loss to views of the International Agency for Research on Cancer / World Health
follow-up, raising the possibility that our results are af- Organization.
fected by selection bias. However, the distributions of We are extremely grateful to all the families who took part in ALSPAC, the
midwives for their help in recruiting them and the whole ALSPAC team,
maternal BMI, BW and offspring sex were similar for which includes interviewers, computer and laboratory technicians, clerical
the samples used for our analyses and the samples at workers, research scientists, volunteers, managers, receptionists and nurses.
baseline, and MV results were similar when we refitted Born in Bradford is only possible because of the enthusiasm and
commitment of the Children and Parents in BiB. We are grateful to all the
models on larger samples without excluding individuals participants, health professionals and researchers who have made Born in
with missing paternal BMI data. It therefore seems un- Bradford happen. We gratefully acknowledge the contribution of TPP and
likely that selection bias would be of sufficient magni- the TPP ResearchOne team in completing study participant matching to GP
primary care records and in providing ongoing informatics support. This
tude to alter our conclusions. research has been conducted using the UK Biobank Resource under
applications 10035, 13436 and 236 granting access to the corresponding UK
Conclusion Biobank genetic and phenotype data. We are extremely grateful to all the
UK Biobank participants, investigators and team members.
We explored the causality of associations between maternal
pre-/early-pregnancy BMI and offspring BW and child/ado- Authors’ contributions
lescent adiposity (measured by BMI and DXA-determined Conceptualisation: TAB, MRJ, DAL. Methodology: DAL, VZ, PFO, MG, AL, SS,
FMI), using an MR approach with PRS calculated from ma- DME, MRJ. Software: TAB, RCR, VK, GCP. Formal analysis: TAB. Data curation:
TAB, IT, AD, ACA, DM, TY, MCB. Writing—original draft preparation: TAB, MRJ,
ternal non-transmitted alleles. This approach yielded nar- DAL, RCR, PFO. Writing—review and editing: TAB, MRJ, DAL, RCR, PFO, VZ,
rower confidence intervals compared with previous studies MG, AL, SS, IT, AD, DM, TY, VK, ACA, GCP, DME, MCB. This publication is the
and avoided sources of bias that may have affected previous work of the authors and TAB, MRJ and DAL will serve as guarantors for the
contents of this paper. All authors read and approved the final manuscript.
work. We found no strong evidence for a causal effect of
maternal BMI on offspring adiposity beyond birth, but Funding
strong evidence that confounder adjusted observational as- The UK Medical Research Council and Wellcome (102215/2/13/2) and the
sociations between maternal BMI and adolescent adiposity University of Bristol provide core support for ALSPAC. Genotyping of the
ALSPAC maternal samples was funded by the Wellcome Trust (WT088806)
are affected by residual confounding. Although we cannot and the offspring samples were genotyped by Sample Logistics and
rule out a small or moderate causal effect on child/adoles- Genotyping Facilities at the Wellcome Trust Sanger Institute and LabCorp
cent adiposity, the present study suggests that higher ma- (Laboratory Corporation of America) using support from 23andMe. A
comprehensive list of grants funding is available on the ALSPAC website
ternal pre-/early-pregnancy BMI is not a key driver of (http://www.bristol.ac.uk/alspac/external/documents/grant-
greater adiposity in the next generation. Thus, our results acknowledgements.pdf). BiB receives core infrastructure funding from the
support interventions that target the whole population for Wellcome Trust (WT101597MA), a joint grant from the UK Medical Research
Council (MRC) and UK Economic and Social Science Research Council (ESRC)
reducing overweight and obesity, rather than a specific (MR/N024397/1), the British Heart Foundation (CS/16/4/32482) and the
focus on women of reproductive age. National Institute for Health Research (NIHR) under its Applied Research
Collaboration Yorkshire and Humber (NIHR200166). Further support for
Abbreviations genome-wide data is from the UK Medical Research Council (G0600705) and
ALSPAC : Avon Longitudinal Study of Parents and Children; BiB: Born in the National Institute of Health Research (NF-SI-0611-10196). The work pre-
Bradford; BMI: Body mass index; DXA: Dual-energy X-ray absorptiometry; sented here was supported by the US National Institute of Health (R01
FMI: Fat mass index; GWAS: Genome-wide association study; GWS: Genome- DK10324), the European Research Council under the European Union’s Sev-
wide significant (P < 5e-8); IV: Instrumental variable; LMM: Linear mixed enth Framework Programme (FP7/2007-2013)/ERC grant agreement (669545)
model; MR: Mendelian randomisation; MV: Multivariable; NCMP: UK and the British Heart Foundation (AA/18/7/34219). TAB is supported by the
Government National Child Measurement Programme; PC: Principal Medical Research Council (MRC) (UK) (MR/K501281/1); TAB and DME are sup-
component; PRS: Polygenic risk score(s); QC: Quality control; SD: Standard ported by the NHMRC (Australia) (GNT1183074 and GNT1157714); DAL, TAB,
deviation; SNP: Single nucleotide polymorphism; TSLS: Two-stage least MCB and RCR work in/are affiliated with a unit that is supported by the UK
squares; UKB: UK Biobank Medical Research Council (MC_UU_00011/1 & MC_UU_00011/6); and DAL is
a British Heart Foundation Chair (CH/F/20/90003) and NIHR Senior Investiga-
tor (NF-0616-10102). DAL, MCB and TAB are supported by the British Heart
Supplementary information Foundation Accelerator Award at the University of Bristol (AA/18/7/34219).
The online version contains supplementary material available at https://doi. MCB’s contribution to this work was supported by a UK MRC Skills Develop-
org/10.1186/s12916-021-02216-w. ment Fellowship (MR/P014054/1). VK is funded by the European Union’s
Horizon 2020 research and innovation programme under the Marie
Additional file 1. Supplementary information S1–S35. Sklodowska-Curie grant (721567). MRJ is funded by EU-H2020 LifeCycle Ac-
tion (733206) which also supports DAL’s research, EU-H2020 EDCMET
(825762), EU-H2020 EUCAN Connect (824989), EU H2020-MSCA-ITN-2016
Acknowledgements CAPICE Marie Sklodowska-Curie grant (721567) and the MRC (UK) (MRC/
We thank Tom Palmer, Eleanor Sanderson and Stephen Burgess for helpful BBSRC MR/S03658X/1 [JPI HDHL]). RCR is a de Pass Vice Chancellor’s Research
discussions; Mark Iles for provision of BiB ethnicity variables; and Amanda Hill Fellow at the University of Bristol. AL and MRJ are supported by the MRC
and David Hughes for support in delivery and management of the ALSPAC (UK) (MR/M013138/1) and the European Union Horizon 2020 programmeBond et al. BMC Medicine (2022) 20:34 Page 14 of 16
(633595). The funders had no role in study design, data collection and ana- Received: 2 August 2021 Accepted: 13 December 2021
lysis, decision to publish or preparation of the manuscript.
Availability of data and materials References
The data that support the findings of this study are available from the ALSP 1. Lawlor DA. The Society for Social Medicine John Pemberton Lecture 2011.
AC, BiB and UK Biobank executives, but restrictions apply to the availability of Developmental overnutrition—an old hypothesis with new importance? Int
these data, which were used under licence for the current study, and so are J Epidemiol. 2013;42(1):7–29. https://doi.org/10.1093/ije/dys209.
not publicly available. The ALSPAC study website (http://www.bristol.ac.uk/ 2. Godfrey KM, Reynolds RM, Prescott SL, Nyirenda M, Jaddoe VWV, Eriksson
alspac/researchers/our-data/) contains details of all the data that are available JG, et al. Influence of maternal obesity on the long-term health of offspring.
through a fully searchable data dictionary and variable search tool. Scientists Lancet Diabetes Endocrinol. 2017;5(1):53–64. https://doi.org/10.1016/S2213-
are encouraged and able to use BiB data. Data requests are made to the BiB 8587(16)30107-3.
executive using the form available from the study website: http://www. 3. Fleming TP, Watkins AJ, Velazquez MA, Mathers JC, Prentice AM,
borninbradford.nhs.uk (please click on ‘Science and Research’ to access the Stephenson J, et al. Origins of lifetime health around the time of
form). Guidance for researchers and collaborators, the study protocol and conception: causes and consequences. Lancet. 2018;391(10132):1842–52.
the data collection schedule are all available via the website. All requests are https://doi.org/10.1016/S0140-6736(18)30312-X.
carefully considered and accepted where possible. UK Biobank data are 4. Larqué E, Labayen I, Flodmark CE. et al. From conception to infancy — early
available from the UK Biobank (http://biobank.ndph.ox.ac.uk/showcase/). risk factors for childhood obesity. Nat Rev Endocrinol. 2019;15:456–78.
GWAS summary statistics are publicly available from the GIANT consortium https://doi.org/10.1038/s41574-019-0219-1.
website: https://portals.broadinstitute.org/collaboration/giant/index.php/ 5. Voerman E, Santos S, Golab BP, et al. Maternal body mass index, gestational
GIANT_consortium_data_files [83]. weight gain, and the risk of overweight and obesity across childhood: an
individual participant data meta-analysis. PLoS Med. 2019;16(2):e1002744.
https://doi.org/10.1371/journal.pmed.1002744.
Declarations 6. Heslehurst N, Vieira R, Akhter Z, Bailey H, Slack E, Ngongalah L, et al. The
association between maternal body mass index and child obesity: a
Ethics approval and consent to participate systematic review and meta-analysis. PLoS Med. 2019;16(6):e1002817.
For ALSPAC, ethical approval was obtained from the ALSPAC Ethics and Law https://doi.org/10.1371/journal.pmed.1002817.
Committee and the Local Research Ethics Committees. For BiB, ethical 7. Reynolds RM, Allan KM, Raja EA, Bhattacharya S, McNeill G, Hannaford PC,
approval was obtained from Bradford National Health Service Ethics et al. Maternal obesity during pregnancy and premature mortality from
Committee (ref 06/Q1202/48). UK Biobank received ethical approval from the cardiovascular event in adult offspring: follow-up of 1 323 275 person years.
North West Multi-centre Research Ethics Committee (MREC) (ref 11/NW/ BMJ. 2013;347(aug13 1):f4539. https://doi.org/10.1136/bmj.f4539.
0382). Informed consent was obtained from participants of all studies. 8. Lahti-Pulkkinen M, Bhattacharya S, Wild S.H, et al. Consequences of being
overweight or obese during pregnancy on diabetes in the offspring: a
record linkage study in Aberdeen, Scotland. Diabetologia. 2019;62:1412–19.
Consent for publication https://doi.org/10.1007/s00125-019-4891-4.
This manuscript does not include details, images or videos relating to an 9. Friedman JE. Developmental programming of obesity and diabetes in
individual person; therefore, consent for publication is not required, beyond mouse, monkey, and man in 2018: where are we headed? Diabetes. 2018;
the informed consent provided by all study participants as described above. 67(11):2137–51. https://doi.org/10.2337/dbi17-0011.
10. Poston L. Maternal obesity, gestational weight gain and diet as
determinants of offspring long term health. Best Pract Res Clin Endocrinol
Competing interests Metab. 2012;26(5):627–39. https://doi.org/10.1016/j.beem.2012.03.010.
DAL has received support from numerous national and international 11. Lawlor DA, Tilling K, Davey SG. Triangulation in aetiological epidemiology.
government and charity funders and from Medtronic LTD and Roche Int J Epidemiol. 2016;45(6):1866–86. https://doi.org/10.1093/ije/dyw314.
Diagnostics for research unconnected with that presented in this study. DAL 12. Fleten C, Nystad W, Stigum H, Skjaerven R, Lawlor DA, Davey Smith G, et al.
is an associate editor for BMC Medicine. GCP is an employee of 23andMe Inc Parent-offspring body mass index associations in the Norwegian Mother
and may hold stock or stock options. All other authors report no conflict of and Child Cohort Study: a family-based approach to studying the role of
interest. the intrauterine environment in childhood adiposity. Am J Epidemiol. 2012;
176(2):83–92. https://doi.org/10.1093/aje/kws134.
Author details 13. Patro B, Liber A, Zalewski B, Poston L, Szajewska H, Koletzko B. Maternal and
1 paternal body mass index and offspring obesity: a systematic review. Ann
Department of Epidemiology and Biostatistics, Imperial College London,
London, UK. 2MRC-PHE Centre for Environment and Health, School of Public Nutr Metab. 2013;63(1-2):32–41. https://doi.org/10.1159/000350313.
Health, Imperial College London, London, UK. 3The University of Queensland 14. Lawlor DA, Timpson NJ, Harbord RM, Leary S, Ness A, McCarthy MI, et al.
Diamantina Institute, The University of Queensland, Brisbane, Australia. 4MRC Exploring the developmental overnutrition hypothesis using parental–
Integrative Epidemiology Unit, University of Bristol, Bristol, UK. 5Population offspring associations and FTO as an instrumental variable. PLoS Med. 2008;
Health Sciences, Bristol Medical School, University of Bristol, Bristol, UK. 5(3):e33. https://doi.org/10.1371/journal.pmed.0050033.
6
Center for Life-course Health Research, Faculty of Medicine, University of 15. Gaillard R, Steegers EA, Duijts L, et al. Childhood cardiometabolic outcomes
Oulu, Oulu, Finland. 7Research Unit of Mathematical Sciences, University of of maternal obesity during pregnancy: The Generation R Study.
Oulu, Oulu, Finland. 823andMe, Inc., Sunnyvale, CA, USA. 9MRC Biostatistics Hypertension. 2014;63(4):683–91. https://doi.org/10.1161/HYPERTENSIONA
Unit, School of Clinical Medicine, University of Cambridge, Cambridge, UK. HA.113.02671.
10
School of Biosciences and Medicine, Faculty of Health and Medical 16. Santos Ferreira DL, Williams DM, Kangas AJ, Soininen P, Ala-Korpela M,
Sciences, University of Surrey, Guildford, UK. 11Born in Bradford, Bradford Smith GD, et al. Association of pre-pregnancy body mass index with
Institute for Health Research, Bradford Teaching Hospitals NHS Foundation offspring metabolic profile: Analyses of 3 European prospective birth
Trust, Bradford, UK. 12Section of Nutrition and Metabolism, IARC, Lyon, cohorts. PLoS Med. 2017;14(8):e1002376. https://doi.org/10.1371/journal.
France. 13Department of Hygiene and Epidemiology, University of Ioannina pmed.1002376.
Medical School, Ioannina, Greece. 14Institute for Molecular Bioscience, 17. Zalbahar N, Najman J, McIntrye HD, Mamun A. Parental pre-pregnancy
University of Queensland, Brisbane, Australia. 15Department of Medical BMI influences on offspring BMI and waist circumference at 21 years.
Statistics, London School of Hygiene and Tropical Medicine, London, UK. Aust N Z J Public Health. 2016;40(6):572–8. https://doi.org/10.1111/1753-
16
Genetics and Genomic Sciences, Icahn School of Medicine at Mount Sinai, 6405.12574.
New York, USA. 17Unit of Primary Care, Oulu University Hospital, Oulu, 18. Sørensen TI, Ajslev TA, Ängquist L, Morgen CS, Ciuchi IG, Smith GD.
Finland. 18Department of Life Sciences, College of Health and Life Sciences, Comparison of associations of maternal peri-pregnancy and paternal
Brunel University London, London, UK. anthropometrics with child anthropometrics from birth through age 7 yYou can also read


