Effect of Potential Climate Tipping Points on UK Impacts
←
→
Page content transcription
If your browser does not render page correctly, please read the page content below
Effect of Potential
Climate Tipping
Points on UK
Impacts
Dr Helen Hanlon, Dr Matthew Palmer and Prof Richard
Betts

Acknowledgements: We wish to express our appreciation for scientific advice
provided by Dr Laura Jackson, Dr Eleanor Burke, Rosie Eade, Dr Paul Ritchie and
Prof Julia Slingo.

© Crown copyright 2021, Met Office
 www.metoffice.gov.uk © Crown Copyright 2021, Met Office
Contents

Executive Summary .............................................................................................................. 3
1 Introduction .................................................................................................................... 4
2 Carbon cycle and biogeochemical feedbacks .............................................................. 14
 2.1 Permafrost Thaw .................................................................................................. 14
 2.1.1 Possible Impacts............................................................................................ 16
 2.2 Dieback of the Amazon rainforest ......................................................................... 16
 2.2.1 Possible impacts ............................................................................................ 18
 2.3 Boreal forests dieback .......................................................................................... 19
 2.3.1 Possible impacts ............................................................................................ 20
3 Implications for sea level .............................................................................................. 21
 3.1 Ice Mass Loss and Global mean sea level rise ..................................................... 21
 3.2 Estimating regional sea level change from global sea level rise. ........................... 23
 3.2.1 Greenland ice sheet ....................................................................................... 24
 3.2.2 What does Greenland ice melt mean for the UK? .......................................... 25
 3.2.3 West Antarctic ice sheet ................................................................................ 26
 3.2.4 What Antarctic melting means for the UK? ..................................................... 29
 3.3 Possible Impacts ................................................................................................... 31
4 Regional climate changes ............................................................................................ 33
 4.1 Atlantic thermohaline circulation (THC)/AMOC ..................................................... 33
 4.1.1 Possible impacts ............................................................................................ 35
 4.2 Arctic sea ice and snow cover reduction ............................................................... 37
 4.2.1 Possible Impacts............................................................................................ 38
 4.3 Change in North Atlantic Jet Stream ..................................................................... 38
5 Discussion ................................................................................................................... 40
References ......................................................................................................................... 42

 Page 2 of 52
© Crown copyright 2021, Met Office
Executive Summary
The purpose of this report is to review current knowledge of climate tipping points and
related processes and their potential impact on the UK were they to be passed, as input
to the Technical Report of the UK’s 3rd Climate Change Risk Assessment (CCRA3).
This will inform judgements of the urgency of adaptation for managing the risks and
opportunities considered in the CCRA3 Technical Report.
The CCRA3 is concerned mainly with outlining government action required in the next
5 years to protect the UK against potential impacts of climate change that could occur
in the future. So included in this report is consideration of the timescale of adaptation
plans required within the next 5 years.
The physical mechanisms by which the UK could be affected, should certain tipping
point thresholds be passed, is discussed. For example:

 • AMOC weakening leading to widespread cooling and drying in Europe, or a
 stronger North Atlantic storm track which would cause an increase in winter
 storms in the UK. AMOC weakening could be exacerbated by Greenland ice
 melt.
 • Accelerating Antarctic melting would lead to faster sea level rise around the
 UK, sea levels predicted for 2100 and beyond could be realised earlier with up
 to 2m by 2100.
 • Accelerated Antarctic melting could also be further exacerbated by AMOC
 weakening leading to enhanced warming in the Southern Ocean and changes
 in ENSO leading to enhanced warming in Ross and Amundsen seas.
 • The North Atlantic jet stream is closely linked to the UK weather patterns,
 tipping points, such as AMOC weakening or Artic sea ice loss could possibly
 change its strength or position. For example, a southward shift in the jet
 stream would lead to weaker mid-latitude westerlies leading to colder winters
 in Europe.
 • Permafrost thaw, Amazon and Boreal forest dieback involve carbon-cycle or
 biogeochemical feedbacks that result in additional global warming thereby
 amplifying UK impacts.
There is however huge uncertainty in the probability of abrupt changes such as these
tipping points which presents a considerable challenge to adaptation planning.

 Page 3 of 52
© Crown copyright 2021, Met Office
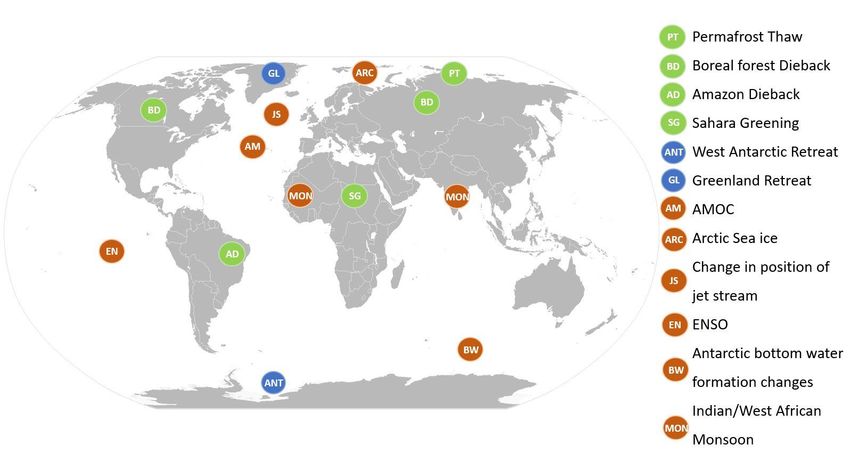
1 Introduction
A tipping point is generally defined as the critical threshold beyond which a qualitative change
occurs in a system. In terms of the climate tipping points these are processes that are critical
to the climate system on a subcontinental scale which if reached would have long-term
consequences. Specific examples of climate tipping points are given in Table 1 and Figure 1
and are mainly related to processes such as:

 • Carbon cycle and biogeochemical feedbacks
 • Changes in the cryosphere, some of which have implications for sea level
 • Large-scale shifts in climate patterns causing regional climate changes.

The tipping points we discuss here fit into those 3 main broad categorisations, although not all
fit into a single category, eg: Amazon dieback is considered as a biogeochemical feedback
that has an effect globally but it also has effects on local rainfall and its regional climate. Where
a tipping point falls into multiple categories, we have categorised it by the dominant effect.
There are many potential climate tipping points spread across the Globe which could link
together (Lenton et al 2019). Something that is currently not well understood is what different
tipping points in combination might result in or whether we should expect different outcomes
if one precedes another. Kriegler et al. 2009 and Lenton et al. 2008 both note that the
probability of some tipping points can vary depending on whether another has already
occurred. These are described as a “cascading effects” where the occurrence of one tipping
point triggers a change in the climate system which accelerates another. For example, East
Antarctic ice loss is not expected to reach a tipping threshold until there is > 5°C global
warming but melting elsewhere and changes to the Atlantic meridional overturning circulation
(AMOC) could lead to sea level rise and Southern Ocean warming, which would in turn
accelerate East Antarctic melting (Steffen et al. 2018).
This report discusses the potential impacts that passing a tipping point, or cascade of tipping
points, could have on the UK specifically. Included is some discussion on how tipping points
could link together if that link ultimately impacts the UK. Here we focus on direct meteorological
impacts but there could also be indirect impacts such as supply chain issues due to a tipping
point affecting a critical location on the supply chain.
The discussion of tipping points in this report is ordered by the scale of the subsequent impact.
Firstly, Carbon cycle and biogeochemical feedbacks which could accelerate global warming
through climate feedbacks that have implications globally. Then changes in the cryosphere,
which have implications for sea level. Followed by those which cause large-scale shifts in
climate patterns causing regional climate changes.

 Page 4 of 52
© Crown copyright 2021, Met Office
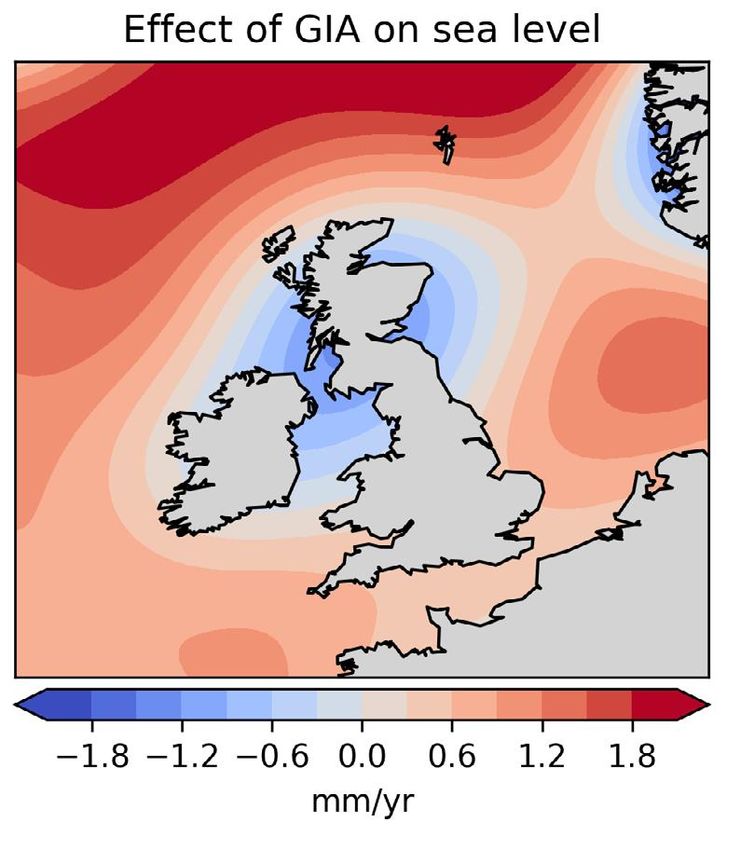
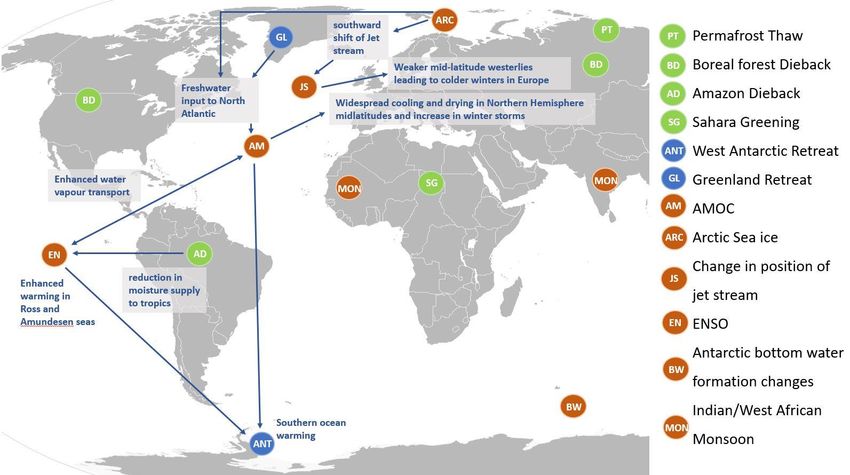
Figure 1: Map of tipping points that could be important for UK impacts. Those represented by red circles are large-scale shifts in climate patterns causing
regional climate changes. Blue circles are cryosphere changes that increase global sea level rise and subsequently UK sea levels. Green circles are tipping
points that involve carbon-cycle or biogeochemical feedbacks that result in additional global warming thereby amplifying UK impacts due to global warming.

 Page 5 of 52
© Crown copyright 2021, Met Office
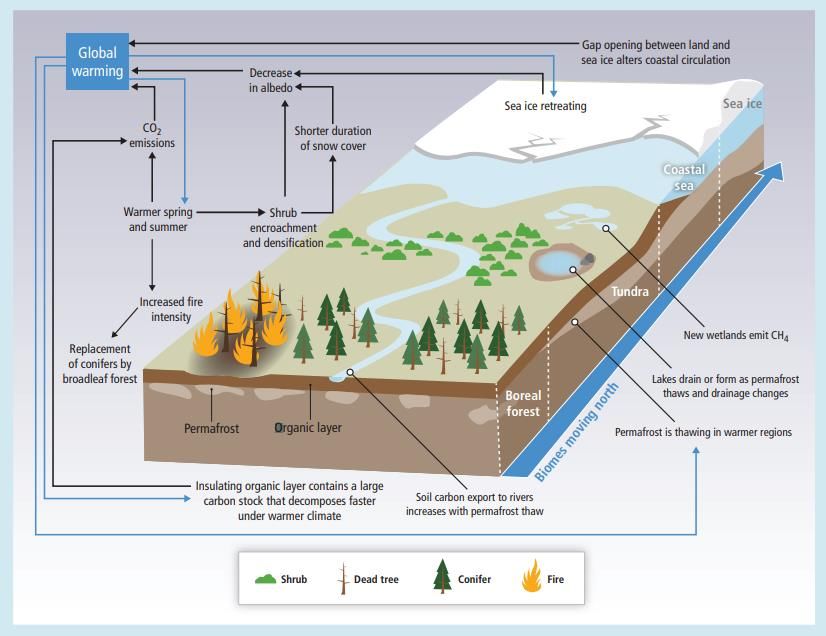
Table 1: Summary of each tipping point’s impact and implications for the UK

 Tipping Point Unprecedented or Global impacts Mechanisms to UK Implications for Implications for UK
 magnification of impact time scale of UK adaptation decisions
 existing impact impacts?
 Permafrost Arctic Permafrost Abrupt thaw would and Additional increases in Impacts of global Current projections of
 Thaw extent is already in amplify global mean global mean warming could Global atmospheric
 Section 2.1 decline and there is temperatures further temperatures would in occur earlier if carbon dioxide
 high confidence in though additional carbon turn enhance further abrupt permafrost concentrations and
 total disappearance dioxide emission into the the impacts UK is thaw provides therefore global
 by 2100 under high atmosphere leading to already experiencing or additional temperature rise could
 emission scenario further significant increase expecting due to global atmospheric be exceeded, or
 RCP8.5 which of global temperatures. warming. greenhouse gas higher warming levels
 projects a reduction concentrations. reached sooner.
 in extent of 30-99% Release of methane Increase in global mean Therefore, UK
 by 2100 (IPCC leading to additional sea level also impacts associated
 SROCC, 2019) greenhouse gas warming translates into an with higher warming
 Which could amplify (only short-term ~10years) increase for UK levels would also
 global mean regional sea levels. occur earlier than
 Global mean sea level rise
 temperatures by through destabilisation of expected.
 0.13–0.27 °C mountain glaciers which is
 (Schuur et al. 2015) significant up to (0.32 ±
 or by up to an 0.08m, IPCC SROCC,
 additional 12% of 2019) but small compared
 global temperature to other contributions.
 increase (Burke et
 al. 2017) by 2100. Contribution to global sea
 level from ground ice
 Abrupt permafrost alone (~0.027 to 0.088m
 thaw would be sea level rise, Zhang et al.
 unprecedented (2000))

 Page 6 of 52
© Crown copyright 2021, Met Office
Dieback of Unprecedented loss Reduced Carbon capture Amplified global Impacts of global Current projections of
 the Amazon enhances global warming warming warming could Global atmospheric
 rainforest by an estimated additional occur earlier if carbon dioxide
 0.3°C (Cox et al 2000, Possible effect of loss of Amazon concentrations and
 Section 2.2 Betts et al 2004, Betts et tropical rainfall pattern forest, a large therefore global
 al. 2008) changes through carbon sink, temperature rise
 teleconnection but it is leads to projections could be
 Increasing CO2 drives not clear how and no significant exceeded, or higher
 Plant stomata evidence for it. increase of warming levels
 conductance feedback ~0.3°C reached sooner with
 which can lead to changes atmospheric the addition of 0.3°C.
 in tropical precipitation greenhouse gas Therefore, UK
 pattern concentrations. impacts associated
 with higher warming
 So, adaptation levels would occur
 would need to earlier than expected.
 factor that
 additional
 warming by
 looking at what
 the impacts would
 be at a warming
 level 0.3°C higher
 than currently
 projected.

 Page 7 of 52
© Crown copyright 2021, Met Office
Boreal forests Unprecedented loss Reduced Carbon capture The mechanism to UK Impacts of global Impacts of boreal
 dieback increasing global could be through warming could forest loss, a large
 atmospheric carbon amplified global occur earlier if carbon sink but also
 Section 2.3 dioxide concentrations warming but as the net- loss of Boreal low albedo area is
 could contribute to global effect is currently forest, a large hard to predict due to
 warming unknown it is not carbon sink, complex combination
 possible to draw any leads to of multiple uncertain
 Global cooling due to conclusions on this. significant processes
 albedo increase in higher increase in
 latitudes. atmospheric
 Net effect is currently greenhouse gas
 unknown due to concentrations.
 complexity of the multiple
 processes involved (IPCC
 AR5d)

 Page 8 of 52
© Crown copyright 2021, Met Office
Tipping Point Unprecedented or Global impacts Mechanisms to UK Implications for Implications for UK
 magnification of impact time scale of UK adaptation decisions
 existing impact impacts?
 Dynamic Antarctica is already Accelerated global mean Accelerated global sea- Current climate Coastal defences may
 instability of melting and having sea-level rise level rise leads to projections require increased
 the West an effect on sea regional sea-level rise estimate of UK adaptation beyond
 Antarctic ice level. So, it would be in the UK. sea level rise of ~ current predicted
 sheet magnification of the up to 1m by 2100. limits. For example,
 melt rate to Acceleration of the Thames Estuary
 Sections 3.2.3 unprecedented Antarctic melting 2100 project (Ranger
 and 3.2.4 rates, causing ice could add up to et al. 2013)
 loss due to marine another 1m by
 ice sheet and ice cliff 2100 so the high
 instability end-scenario for Especially if upper
 exacerbated by UK sea level rise limit of RCP8.5 is
 higher ocean is 2m by 2100. considered as a
 temperatures. (IPCC SROCC, worst-case scenario.
 2019, UKCP09
 H++ Lowe et al.
 2009 and
 combined
 estimates detailed
 below)

 Page 9 of 52
© Crown copyright 2021, Met Office
Retreat of the Magnification of Freshwater influx to Enhanced AMOC It would take Greenland ice melt
 Greenland ice current ice mass subpolar North Atlantic weakening -> increase 1000s of years for will contribute small
 sheet loss and increase could further weaken in severe cold weather Greenland ice changes to UK sea
 risk of AMOC AMOC impacts melt alone to lead levels which vary
 Sections shutdown described to significant regionally around UK
 3.2.1 and 3.2.2 in section 4.1. Greenland ice melt Greenland ice melt increase in UK but these will be small
 contribution to Global does add ~10s cm to sea levels an relative to other
 mean sea-level rise of 10s global mean sea level effect which is sources such as
 centimetres by 2100 rise and therefore to UK minimised by our thermal expansion
 (IPCC SROC 2019) sea level rise. proximity to and Antarctic mass
 Accelerated ice mass loss However, this effect is Greenland. loss see sections
 is possible through offset by our proximity 3.2.2, 3.2.3 and 3.2.4
 Surface mass balance- to Greenland and Increased risk of
 elevation feedbacks that gravitational effects of AMOC shutdown
 could increase Greenland Greenland ice loss which would lead to
 contribution to global sea means the UK sea an increase in very
 level rise by an additional levels do not increase cold severe winters.
 15% above current as they do on average This is very unlikely
 projections (Church et al globally, up until a but remains plausible
 2013) certain level the this century and would
 Greenland contribution call for an alternative
 Even with additional mass is actually a reduction
 loss through self- decision as most
 to UK sea levels projections of UK
 reinforcing feedbacks slightly offsetting
 Greenland ice melt does temperatures are
 contributions from other showing increases
 not pose the same sources (eg: Antarctica,
 imminent threat as and a reduction in
 glaciers, etc…) cold winter impacts.
 Antarctica in terms of sea-
 level change which is of
 the order metres, see
 sections 3.2.3 and 3.2.4.

 Page 10 of 52
© Crown copyright 2021, Met Office
Tipping Point Unprecedented or Global impacts Mechanisms to UK Implications for Implications for UK
 magnification of impact time scale of UK adaptation decisions
 existing impact impacts?
 Atlantic Shutdown is very Widespread cooling in the Weakening would bring Further Widespread drying
 thermohaline unlikely but still a northern hemisphere, less less warm water/ air weakening is could mean up to 50%
 circulation plausible scenario precipitation in the into Northern Europe so likely by 2050 and reduction in net
 shutdown over the next northern hemisphere increased severe cold- very likely by primary production
 (AMOC) century. midlatitudes and a weather impacts. 2100. (Jackson et al. 2015)
 stronger North Atlantic and 10% reduction in
 Section 4.1 storm track and Reduction in Latest projections total income from
 southwards shift in the precipitation could from analysis of arable land. Impacts
 ITCZ (Jackson et al. 2015) exacerbate droughts, multiple climate on agriculture an
 particularly in Summer, models estimate order of magnitude
 which would be a 34-45% greater with AMOC
 somewhat offset by reduction in shutdown compared
 reduced temperatures strength by 2100 to steadier climate
 but impact on (Weijer et al change (Ritchie et al
 agriculture would be 2020). 2020)
 expected.
 Collapse is very Increase in severe
 Increased snowfall, unlikely by 2100 cold weather and
 especially over high drought impacts
 ground
 More winter storms
 Increased winter storms
 bring more precipitation Sea level rise of tens
 to westerly coasts of cms (see Figure 13,
 Vellinga & Wood
 Additional local sea- (2008))
 level change of tens of
 cm (see Figure 13,
 Vellinga & Wood
 (2008))

 Page 11 of 52
© Crown copyright 2021, Met Office
Arctic sea ice Arctic sea ice thaw Reduction in Albedo Southward shift of polar The physical Arctic sea-ice loss
 reduction is already being leading to increase in jet stream mechanisms could lead to colder
 observed. Arctic sea arctic ocean temps and responsible for winters, increase in
 Section 4.2 ice extent has been accelerates global Acceleration of global the modelling frequency of extreme
 declining during all temperature rise. warming due to impacts are also weather including
 months of the year, reduction in Polar not fully severe winters and
 with the strongest Changes in primary albedo understood. So increased summer
 reductions seen in production of marine currently it is not rainfall in Europe.
 ecosystems impacting Weaker mid-latitude
 September at a rate westerlies leading to possible to Which for the UK,
 of -12.8 ±2.3% per polar fisheries
 increase in frequency of hypothesise the could mean more
 decade (1979-2018) Change in position of jet extreme weather effect a tipping frequent or severe
 (IPCC SROCC, streams and storm tracks events in Europe (eg: point leading to cold -weather impacts
 2019). eg: polar jet stream, ITCZ, severe cold winters, rapid Arctic sea- in winter and
 tropical storms flooding, drought and ice loss may have increased summer
 heatwaves) globally or on the flooding. However,
 UK. This is being due to disparity in the
 investigated in results of the different
 the PAMIP modelling studies this
 experiments is a highly speculative
 (Smith et al. hypothesis.
 2019)

 Acceleration of global
 temperature rise
 leading to reaching
 warming levels earlier
 and hence impacts
 associated with higher
 warming levels.

 Page 12 of 52
© Crown copyright 2021, Met Office
Change in Unprecedented Weakening or changes in A weaker jet stream The uncertainty in Current projections
 North Atlantic change in the position due to reduction across the North how the jet and analysis of future
 Jet streams position or strength of Arctic Sea ice in warmer Atlantic could change stream may UK weather patterns
 of Jet stream. climates position more and as it change means it suggest a tendency to
 Section 4.3 does would influence is currently not more mild/unsettled
 the weather patterns possible to say weather in future
 seen in UK. what effect the winters and more drier
 Specifically, a UK would face. and settled weather in
 weakening would lead future summers
 to more frequent The main (McSweeny &
 occurrence of blocking mechanism by Thornton 2020).
 patterns which are which the UK
 linked to high impact could be affected Changes to the jet
 weather in UK and would be if Artic stream would affect
 increased probability of sea ice loss the frequency of those
 extremes such as resulted in, for weather patterns
 drought, flooding, cold example, a potentially having the
 spells, and heat waves. change in the opposite effect and
 (Francis and Vavrus position of the jet requiring a different
 2012) stream. However, policy response to
 the likelihood of that based on current
 A Southward shift of this occurring and projections.
 the jet stream could its subsequent
 lead to increased impacts are
 northern European subject to the
 precipitation in Summer same caveats as
 (Screen 2013) stated above for
 arctic sea ice
 loss. There is
 also a lack of
 consensus across
 studies on how
 the jet stream
 may change.

 Page 13 of 52
© Crown copyright 2021, Met Office
2 Carbon cycle and biogeochemical feedbacks

2.1 Permafrost Thaw

There is high confidence that a large area of Arctic near-surface permafrost will disappear this
century as a result of the warming climate. Projections show an estimated reduction of 2-66%
under RCP2.6 and 30-99% under RCP8.5 by 2100 (IPCC SROCC, 2019). CMIP6 projections
of loss of permafrost extent due to sensitivity to increasing global mean surface temperature
between 1.8 and 3.0 106 km2/°C (25-75% range) (Burke et al. 2020, Table 5).
Permafrost is a mixture of soil, rocks and ice which remains permanently frozen throughout
the year. In the warm season the top of the permafrost thaws to a depth denoted the ‘maximum
summer thaw depth’ and then re-freezes in autumn. Carbon stored in the permafrost is
relatively inert as temperatures are too cold for much microbial activity to occur. In permafrost
regions global warming is causing rising temperatures, between 2007-2016 ground
temperature in the continuous permafrost zone increased by 0.39 ± 0.15°C and discontinuous
by 0.20 ± 0.10°C (Biskaborn et al. 2019). Arctic permafrost is affected more due to polar
amplification (Smith et al. 2018), which is when external radiative forcing leads to greater
change in surface temperatures at high latitude (ie: polar regions) than the change in the global
average surface temperature.
Permafrost thaw which could lead to a large amount of carbon/methane being released into
the atmosphere as warmer temperatures allow for more microbial activity. This addition of
greenhouse gases to the atmosphere would increase global warming and lead to further thaw,
this is a feedback term referred to as the “permafrost carbon feedback”. Currently, there is
some evidence for northern permafrost regions releasing additional methane and carbon
dioxide due to thaw but there is low agreement on this (IPCC, SROCC, 2019).
Methane is a greenhouse gas which is more effective at trapping heat than carbon dioxide, so
this could have an additive effect on global warming. However, this effect would be short lived
as methane breaks down in the atmosphere much quicker (~10 years) than carbon dioxide
(~hundreds of years) (IPCC AR5c, 2013).

 “Arctic and boreal permafrost regions contain 1460–1600 Gt organic carbon, almost twice
 the carbon in the atmosphere (medium confidence)” IPCC SROCC, 2019

Should all the permafrost thaw, this carbon would not necessarily all end up released into the
atmosphere immediately. The timescales of soil carbon decomposition are much slower than
the projected rate of permafrost thaw. In addition, there is likely to be enhanced vegetation

 Page 14 of 52
© Crown copyright 2021, Met Office
growth caused by warmer temperatures and increased atmospheric CO2 concentrations.
Permafrost thaw can occur gradually – by a year on year deepening of the maximum summer
thaw depth or abruptly with the landscape suddenly collapsing.

Current models typically assume a gradual deepening of the maximum summer thaw depth.
Schuur et al. 2015 collate estimates of potential carbon release from the permafrost zone from
multiple modelling experiments based on this assumption. Under high emission RCP8.5 or
SRES A2 scenarios, projections estimate carbon release from permafrost to be in the range
37–174 Pg carbon by 2100, with an average across models of 92 ± 17 Pg carbon. This gives
a possible range of additional global warming of 0.13–0.27 °C by 2100 and up to 0.42 °C by
2300(Schuur et al. 2015). More recently Burke et al (2017) used an intermediate complexity
climate model with more complex land surface models and showed the additional warming
from the permafrost carbon feedback is between 0.2% and 12% of the change in the global
mean temperature by the year 2100 and 0.5% and 17 % of global mean temperature by 2300,
where these ranges reflect differences in land surface models, climate models and emissions
pathways.
Abrupt thaw is associated with landscape changes and happens when increasing
temperatures melt ground ice, causing land surface to collapse into the space previously
occupied by ice and alters the hydrology of the surface. This process is called “thermokarst”
(see Olefeldt et al. 2016 and Turetsky et al. 2019 more detailed description) and only occurs
at point locations not widespread areas. It is thought that around 20% of the northern
permafrost region is susceptible to future thermokarst development, (Olefeldt et al. 2016). This
process of rapid thawing is typically not included in large scale models (eg: CMIP6) which only
include limited detail on permafrost dynamics. So, there is a possibility that abrupt thaw would
provide an additional carbon source to the atmosphere that is not currently accounted for in
latest projections (Walter Anthony et al. 2018). This poses a threat as a possible tipping point
if there were many thermokarst landscape collapses potentially releasing more carbon dioxide
and methane into the atmosphere. Simulations of carbon release through abrupt permafrost
thaw by Turetsky et al. (2020) show a change from net carbon uptake to net release with
cumulative emissions up to 80 ± 19 PgC by 2300, which would be a significant contribution to
overall global warming.
IPCC SROCC 2019 also states, with high confidence, that permafrost thaw along with glacial
retreat has reduced the stability of high mountain slopes which would lead to faster melting
and increased contribution to global sea level and consequently regional sea level. It has
already been noted in the Cryosphere section above though that the total contribution to sea
level possible from glaciers alone is relatively small (32 ± 8cm) compared to other contributing
factors (ie: thermal expansion and large ice sheet melting). Permafrost thaw contribution to
sea level rise alone is even smaller, Zhang et al. (2000) estimate the global volume of ground
ice to be equivalent to ~2.7–8.8 cm sea level rise.

 Page 15 of 52
© Crown copyright 2021, Met Office
2.1.1 Possible Impacts

Permafrost thaw is considered a possible carbon source to the atmosphere (Schuur et al.
2015), that would be larger if thaw is abrupt (Turetsky et al. 2020). The impact to the UK would
be an indirect one with permafrost thaw affecting overall global temperatures through release
of additional greenhouse gases resulting in reaching global warming levels earlier. As such
this also means it could indirectly affect other tipping points which are sensitive to global
temperature rise. Global temperature rise caused by the release of permafrost carbon is
between 0.2 and 12% (by 2100) and 0.5 and 17 % (by 2300) of the global mean temperature
change (Burke et al. 2017). Where the permafrost feedback has a greater impact on the low-
emissions scenario (RCP2.6) than on the higher-emissions scenarios (Burke et al. 2017).
Also, if permafrost thaw contributes significant additional greenhouse gases to the atmosphere
this will reduce the budget of anthropogenic CO2 emissions to keep below a certain level of
global warming (Burke et al. 2018). Gasser et al. (2018) compare the carbon budgets and
targets of the Paris Climate Change agreement with carbon emissions from permafrost model
and conclude permafrost could use up 10-100% of emissions budget to reach 1.5° C and up
to 25% of budget to reach 2° C. Once emitted these additional carbon emissions would be
irreversible for centuries.

2.2 Dieback of the Amazon rainforest

The Amazon is a tropical forest which has high rates of evapotranspiration, stable high
humidity climates and store larger mass of Carbon than temperate or boreal forests (Bonan,
2008). Increasing greenhouse gas concentrations are causing the changes to each of those
facets of Amazon climate. Changes in precipitation and increasing temperatures could limit
growth in the Amazon leading to reduction in forest cover reducing its effectiveness as a
carbon sink. This is an example of a self-reinforcing “carbon cycle feedback” because as
global warming induces a reduction of carbon uptake by the forest, that further enhances the
atmospheric growth rate of CO2. Carbon-cycle feedbacks such as these are expected to
significantly accelerate climate change over the 21st century (Cox et al 2000). Cox et al 2000
performed experiments comparing simulations of a fully coupled carbon-climate model (where
the Amazon experiences significant dieback) to that with fixed vegetation and found a 1.5°C
difference in Global mean temperature response. The Amazon contributes ~20% to this total
land carbon cycle feedback on atmospheric CO2 (Betts et al 2004). So, by assuming a linear
relationship between global mean temperature and atmospheric CO2 concentration, Betts et
al 2008 find the effect of Amazon dieback on global mean temperature to be an increase of
0.3°C. Although it must be noted, the effects of anthropogenic deforestation on landcover have

 Page 16 of 52
© Crown copyright 2021, Met Office
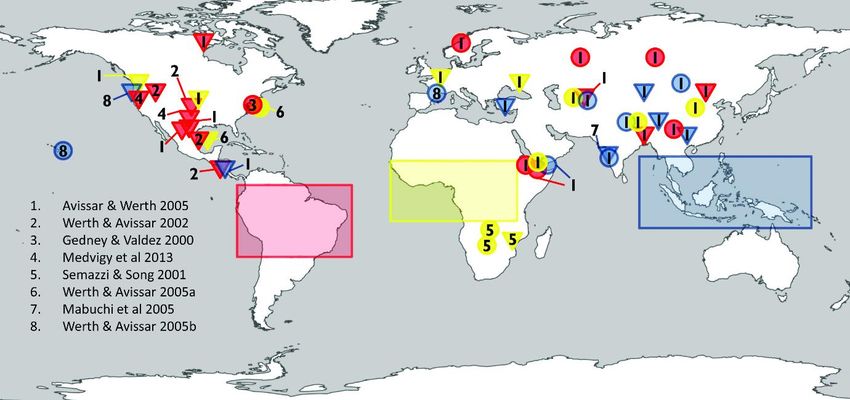
not been included in these models.
Specifically, when dieback starts to occur due to warmer temperatures there is also a reduction
in evaporative cooling, which in turn amplifies the local temperature leading to further dieback.
This is another self-reinforcing feedback that could lead to a tipping point beyond which the
Amazon may not recover.
Climate change and changes in rainfall patterns from loss of the Amazon rainforest would
primarily impact the global carbon and water cycles through biogeophysical and carbon cycle
feedbacks. Under higher atmospheric CO2 concentrations plant stomata could open less
reducing the amount of evaporation of water into the atmosphere (Cao et al. 2010, Swann et
al. 2016, Leipprand and Gerten, 2006). This disrupts the water cycle as there is less water
vapour in the atmosphere available to form into precipitation thereby reducing the region’s
precipitation further. This is called the “plant stomatal conductance feedback”. Using Earth
system model experiments, Kooperman et al. 2018 show that reductions in plant stomatal
conductance and transpiration are the primary cause of the changes to tropical precipitation
in South American forests. However, these changes are complex and depend on the scale
and pattern of the deforestation (Lawrence and Vandecar, 2015).
There are also suggestions that Amazon precipitation would be sensitive to AMOC shutdown
(Good et al. 2018) but studies looking at this do not agree on whether that change would lead
to an increase or decrease of vegetation (Bozbivik et al. 2011 and Parsons et al. 2014).
Reduced precipitation due to global warming could lead to Amazon forest dieback and
increase in the frequency and intensity of drought is already increase in Amazonia, especially
so in the Southern Amazon which was already drought prone (IPCC SRCCL, In press).
Increased drought conditions would also present an even higher risk of wildfires which are
already considered a significant risk to the region due to climate change and methods of
deforestation (Golding and Betts, 2008). There are other possible regional effects such as
changes in hydrological extremes in the region, eg. river streamflows (Fowler et al. 2019).
In the event of forest dieback, additional carbon would be released into the atmosphere as it
is no longer being captured by the vegetation which would accelerate global warming and in
turn magnify the associated pattern of precipitation change. Betts RA, et al. (2004) estimate
the additional precipitation reduction due to the biogeophysical and carbon cycle feedbacks
along with soil respiration change to be 25%.
There have been studies looking at how precipitation would change elsewhere in the world if
large tropical forests were completely removed. IPCC SRCCL shows a map produced by
Lawrence and Vandecar (2015) collating results from these in Figure 2. Although, none of
these found a teleconnection between any of the tropical forests and UK precipitation.

 Page 17 of 52
© Crown copyright 2021, Met Office
Figure 2: “Extra-tropical effects on precipitation due to deforestation in each of the three major tropical
regions. Increasing (circles) and decreasing (triangles) precipitation result from complete deforestation
of either Amazonia (red), Africa (yellow) or Southeast Asia (blue) as reviewed by Lawrence and
Vandecar (2015). Boxes indicate the area where tropical forest was removed in each region” Taken
from IPCC SRCCL (in press) and Lawrence and Vandecar (2015).

It is possible the Amazon could prove to be a climate tipping point as there are fire-vegetation
and climate-vegetation feedbacks (Hirota et al (2011), Staver et al (2011) and Hoffmann et al
(2012)) which could lead to an abrupt reduction in forest cover in the Amazon. Good et al
(2018) consider that these could be realised with a relatively small change in external forcing
and be irreversible but the processes behind this are poorly characterised.

2.2.1 Possible impacts

Through self-reinforcing feedbacks between the climate and vegetation there are proposed
ways in which abrupt tipping point could be reached leading to unprecedented loss of the
Amazon rainforest and disruption to the carbon and water cycles of the region. There are
already changes in tropical precipitation being seen, reductions in the Amazon, that are
expected to worsen with climate change.
There is little evidence to support the idea that there is a teleconnection that would lead to
impact in UK. Amazon dieback could impact the UK if the suggestion presented in the Kriegler
et al (2009) and Cai et al (2016) expert elicitations, and also Steffen et al (2018) that
hypothesises amazon dieback could cause changes in tropical moisture supply led to an
ENSO Shift to a more persistent El Nino phase Cai et al (2016). A change in ENSO could
affect UK as El Nino conditions are linked to colder than average winters in the UK (Ineson
and Scaife (2009), Toniazzo and Scaife (2006)). This could also influence AMOC by

 Page 18 of 52
© Crown copyright 2021, Met Office
enhanced water vapour export from the Atlantic to the pacific and link back to UK via AMOC
weakening (See AMOC section).
So, with regards to UK impacts, as with other tipping points discussed, it could be the UK is
impacted indirectly through dieback leading to reduced carbon capture that amplifies global
warming. If loss of Amazon forest, a large carbon sink, leads to significant increase in
atmospheric greenhouse gas concentrations this could prompt exceedance of global
temperature rise projections or higher warming levels reached sooner. Therefore, UK impacts
associated with higher warming levels would also occur earlier than expected.

2.3 Boreal forests dieback

High latitude warming is projected to increase dieback and disturbance in boreal forests by
drought, fire, pests and disease which could alter its structure, composition and functioning as
it will experience greater temperature and rainfall extremes than they are currently adapted to
(IPCC SRCCL, in press).
All types of forests have a cooling effect on global climate as they capture carbon from the
atmosphere. Dieback would reduce this effect and more CO2 would remain in atmosphere
increasing the overall net amount present. This is true of both the Boreal forests at high
latitudes (45°-70°N) and tropical forests but the uptake of CO2 by boreal forests is moderate
when compared with tropical forests (Bonan et al. 2008). However, there are other impacts
which are not the same for boreal forests to tropical Amazon rainforests. Boreal forests have
a very different climate and effect on surrounding climates. For example, the rate of
evapotranspiration in Boreal forests is much lower than tropical forests, like the Amazon, so it
is not so humid and so changes are not expected to impact large scale precipitation patterns.
The main method for Boreal forests to impact the surrounding climates is through snow-ice-
albedo feedbacks. Land covered in forests have a low albedo and therefore absorb more
incoming solar radiation which then warms surrounding areas as heat is transported as
sensible heat flux. As global climate warms snow and ice-covered regions in high northern
latitudes are thawing so the existence of the boreal forests adds to this warming and supports
additional snow/ice loss though a self-reinforcing cycle (Meissner et al. 2003, Snyder et al.
2004). In this case, Boreal forest dieback could mitigate the effect of snow melt/ permafrost
thaw/ice loss in surrounding areas. Also, models suggest that lower surface albedo of boreal
forests contributes to climate warming relative to unforested land (Thomas and Rowntree
(1992), Bonan et al.(1992), Bonan et al. (1995), Douville and Royer (1997)) which may be
greater than warming that could be offset through the carbon the vegetation could capture
(Betts, 2000). So Boreal forest dieback would, at least to some extent have a cooling effect.

 Page 19 of 52
© Crown copyright 2021, Met Office
Figure 3: Diagram of processes influencing a Tundra-boreal biome shift (taken from IPCC AR5d). As
the climate warms, Earth system models predict a northward shift of Arctic vegetation as the boreal
biome migrates into the current tundra region, facilitated by intensification of the fire regime. Resulting
in modifications to the surface energy budget, net ecosystem carbon balance, permafrost thawing and
methane emissions. Along with net feedbacks to additional climate change.

2.3.1 Possible impacts

Net effect changes to boreal forest extent/composition and shift in the Tundra-boreal biome
could have on global climate is complex and comprises many different aspects (see Figure 3).
Modelling studies have estimated the net feedback, but these are poorly constrained by
observations (IPCC AR5d). This means it is not possible to make confident estimates of how
a boreal tipping point might impact the UK or globally.

 Page 20 of 52
© Crown copyright 2021, Met Office
3 Implications for sea level

Globally, there is enough land-based ice that if it were all to melt would lead to approximately
70 metres of global sea level rise (Church et al. 2001). Although this figure is based on all the
land ice melting which would take thousands of years (Clark et al, 2016). The major ice sheets
of Greenland and Antarctica have both exhibited an acceleration in mass loss over the last
few decades (IPCC SROCC, 2019). The West Antarctic ice sheet may cross a tipping point
whereby self-sustaining feedbacks could lead to a rapid acceleration in sea-level rise over the
coming centuries (e.g., DeConto & Pollard, 2016). Although Greenland doesn’t seem to pose
the same imminent threat, research suggests that the trend in mass loss may become
irreversible even with modest levels of sustained surface warming (Ridley et al. (2010),
Solgaard et al. (2012), Pattyn et al. (2018) and IPCC SROCC (2019)).
Land-ice is overwhelmingly contained within Antarctica (~61 m, Church et al. 2001) and
Greenland (~7 m, Church et al. 2001), mountain glaciers only equate to an equivalent global
sea-level rise of about 0.32 ± 0.08m (IPCC SROCC, 2019). In this section we consider
Greenland and Antarctica which hold the largest amount of land-ice that when melted would
contribute significantly to future global sea-level rise. We also detail the mechanisms and
plausible timescale for reaching tipping point level melting from these regions and what effect
that might have on the UK.

3.1 Ice Mass Loss and Global mean sea level rise

Global mean sea level rise has been accelerating in recent years, 1902–2015 has seen an
increase of 16 cm (likely range 12cm to 21cm, IPCC SROCC 2019). However, given the
continuing acceleration of all the contributing components to unprecedented levels, global sea
level rise over the 21st century will be significantly larger. To put this in context of latest global
projections, the global model simulations with the different relative concentration pathway
scenarios (RCP) project global mean sea level rise by 2100 (relative to 1986-2005) to be:
Table 2: Global Mean Sea Level Rise (GMSLR) at 2100. Range provided in brackets.

 CMIP5 GMSLR (relative to 1986- UKCP18 GMSLR (relative to 1981-
 2005, 2000)
 from IPCC SCROCC 2019 Table 4.4)

 RCP2.6 43cm (29cm to 59 cm) 29cm to 66cm

 RCP4.5 55cm (39cm to 72cm) 38cm to 79cm

 RCP8.5 84cm (61cm to 1.1m) 56cm to 1.12m

[Note: addition of these different estimates would require scaling as they are not relative to the

 Page 21 of 52
© Crown copyright 2021, Met Office
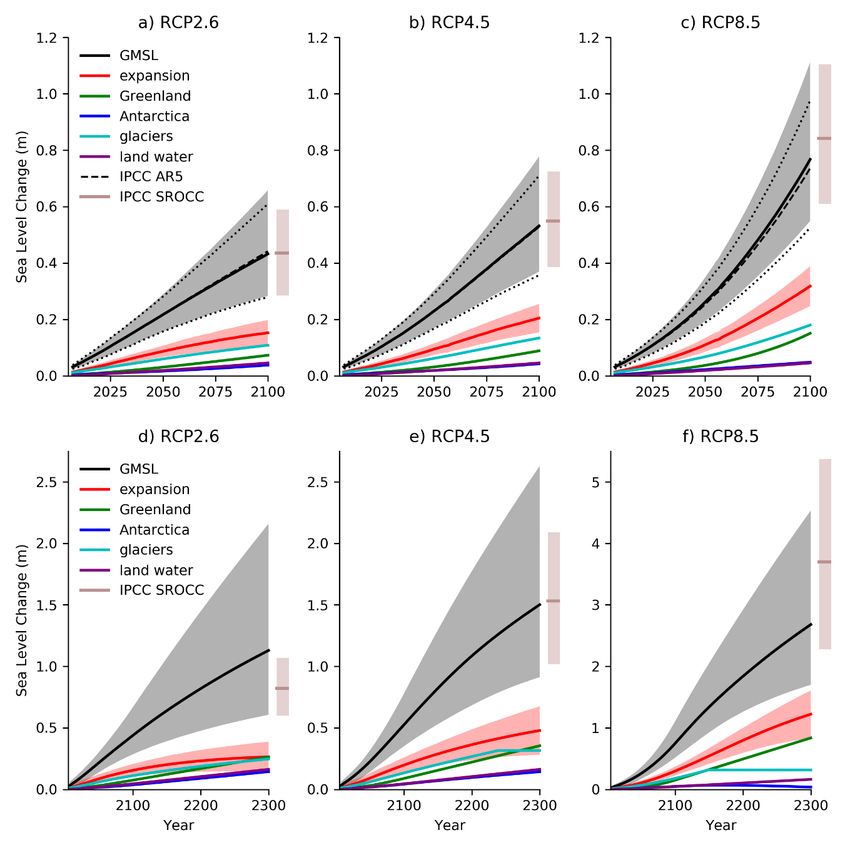
same time periods]
The largest contribution to the projections in Table 2 is from thermal expansion as the ocean
water temperatures increase. There are also substantial contributions from ice melt of
Greenland and Antarctic ice sheets and small contributions from glaciers which do not contain
much ice and landwater changes, see Figure 4.
“ The sum of ice sheet and glacier contributions over the period 2006–2015 is the dominant source of sea level rise (1.8
mm yr–1, very likely range 1.7–1.9 mm yr–1), exceeding the effect of thermal expansion of ocean water (1.4 mm yr –1,
very likely range 1.1–1.7 mm yr–1) 22 (very high confidence)” IPCC SROCC, 2019

Figure 4: Individual contributions to global sea level rise up to 2100 (upper row) and 2300(lower row),
taken from (Palmer et al. (2020)). Also shown for comparison is the total sea level projections presented
in IPCC AR5 (Church et al, 2013) as black dotted line and IPCC SROCC 2100 (upper row) and 2300
(lower row) projection as a pink line (IPCC SROCC, 2019). All projections are shown relative to the
1986-2005 baseline.

 Page 22 of 52
© Crown copyright 2021, Met Office
The threat of accelerated global sea-level rise comes from the ice sheets, thermal expansion
does not have the same potential for acceleration. The Antarctic ice sheet, which dominates
the overall GMSL uncertainty, the impact of this is seen in the spread of GMSL projections. It
is also important to note that projections (shown in Figure 4) show the central part of the
distribution, in the case of a tipping we would want to look to the tails of the distribution which
are not represented in Figure 4.
The question we are posing is how possible it is these contributions could be much larger were
land-ice in Greenland and Antarctica to melt faster. To answer this, we need to consider the
mechanisms for how land-ice in these regions can melt.

3.2 Estimating regional sea level change from global sea level rise.

Figure 5 Effect of glacial isostatic adjustment (GIA) on sea level rise estimates around the UK taken
from Figure A.1.1.5 from UKCP18 Marine report (Palmer et al 2018)

Whilst global and regional sea level changes are directly correlated, it is not as simple as
global sea level increase equals regional sea level increase. Global sea level refers to the
mean average sea level across the entire Earth. To estimate regional sea level changes the

 Page 23 of 52
© Crown copyright 2021, Met Office
projected changes in land-based ice must be combined with spatial patterns, or “fingerprints”,
that account for the response of Earth’s gravity, rotation and solid Earth deformation (e.g.
Palmer et al, 2018). This means that the local sea-level contribution from ice mass changes
can be amplified, diminished, or even reversed in sign for regions close to the ice mass loss.
Estimates of Sea level rise for the UK are given in Palmer et al. (2018) based on two sets of
fingerprints (to account for uncertainty in the fingerprint patterns) by Slangen et al, (2014) and
Spada and Stocchi (2007).

The other effect that is incorporated into regional sea level rise estimates is glacial isostatic
adjustment (GIA) (Church et al 2013). This effect is a result of the Earth’s mantle still
responding to the loss of land ice following the termination of the last glacial period, about 10
thousand years ago. The largest effect on the UK from ongoing vertical land motion but also
from associated changes to Earth’s gravity field and rotational effects (Shennan et al 2012).
This component of the regional UK sea level rise estimates is negative over eastern Scotland
where the sea level falls relative to the land and positive for the Southern UK indicating sea
level rise (See Figure 5 for spatial pattern of GIA effect around the UK).
To calculate regional sea level estimates for the UK, Global sea level rise is first scaled by
the region’s gravitational fingerprint and the region’s GIA adjustment is then added on top.
As so,
 ℎ
 = ℎ
 +

So, in some areas the resulting sea level change could be a reduction.

3.2.1 Greenland ice sheet

The main mechanism for Greenland ice melt is changes in surface mass balance, where ice
melts faster than snow can accumulate, rather than instability of ice shelves. The current rate
of ice sheet loss from Greenland is 278 ± 11 Gt yr–1 which is equivalent to 0.77 ± 0.03 mm yr–
1 of global sea level rise (2006-2015) which is mostly due to surface melting (high confidence)

and would be irreversible for millennia (IPCC SROCC, 2019). Complete loss of Greenland ice
would be contributing around 7 m to global sea level rise, but this would take many thousands
of years, as the surface mass balance process occurs at a steady rate that would not suddenly
accelerate quickly unlike the marine ice shelf/cliff instability processes.

IPCC SROCC estimates sea level rise due to Greenland ice melt during the 21st century would

 Page 24 of 52
© Crown copyright 2021, Met Office
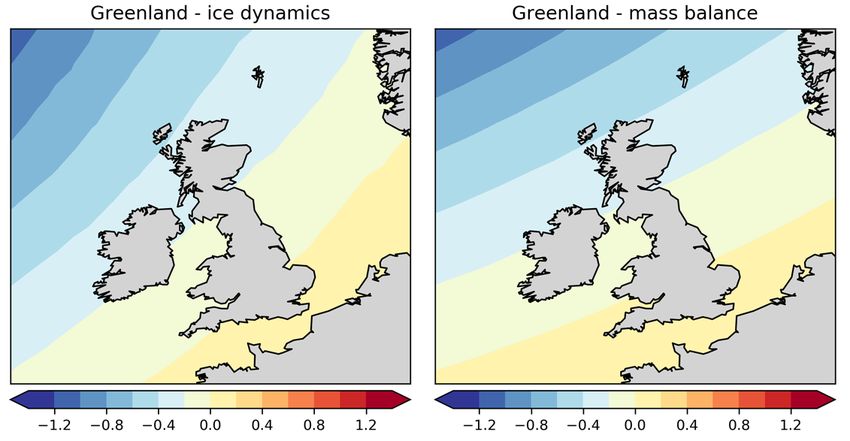
be closer to 10s of centimetres (IPCC SROCCC, 2019). Which is an update on previous
projections of 20-85mm by 2100 under RCP8.5 (by Church et al 2013).
Some self-reinforced melting may occur due to the surface mass balance–elevation feedback
(Pattyn et al. 2018). Timing of this was initially to be thought of in the range of 3.1 (1.9–5.1 )°C
global warming by Gregory and Huybrechts (2006), but this was more recently revised to 1.6
(0.8–3.2) °C by Robinson et al. (2012). Leading to irreversible mass loss, should that level of
global warming persist, and a further 0-15% surface mass balance which is equivalent to an
additional 0 -14mm sea level rise by 2100 (based on RCP8.5, Church et al. 2013).
It is not considered possible that this could led to an abrupt change (IPCC SROCCC) unlike
ice shelves in Antarctica which are subject to other melting processes which can be more
rapid (see below). So, Greenland does not pose the same imminent threat as Antarctica in
terms of sea-level change (except, potentially, through associated change in local dynamic
sea-level change, as per Vellinga and Wood, 2008).

3.2.2 What does Greenland ice melt mean for the UK?

When translating global mean sea level rise projections into estimates for regions there are
regional gravitational effects that must be considered. To account for these, the global
contribution to sea level rise from Greenland is scaled with ‘fingerprints’ accordingly for the
UK as in Figure 6, for its effect on UK sea level rise could be estimated. Greenland ice melt
does not have such a large effect on the UK sea level as it does elsewhere or on average
globally. This is because of the UK’s proximity to Greenland is such that it is close enough to
be subject to the gravitational effects of ice mass loss redistribution.

Figure 6: Fingerprint patterns of sea level rise adjustments necessary due to regional gravitational
effects for Greenland.

 Page 25 of 52
© Crown copyright 2021, Met Office
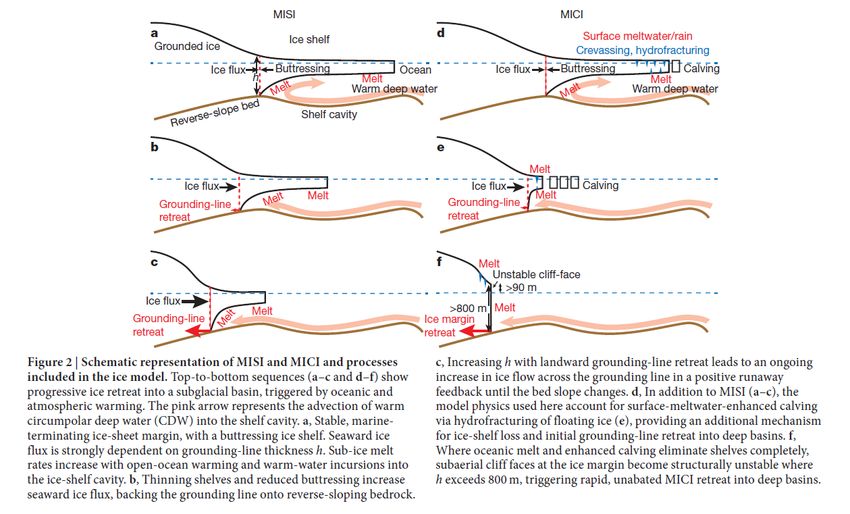
The effect to UK due to ice loss purely from Greenland (not elsewhere) would be through
changes to sea level (scaled as explained above) and weakening of AMOC. Weakening of
AMOC due to increased freshwater input from Greenland melt leading to substantial regional
sea-level changes through ocean dynamic sea-level change (see AMOC section above).
To summarise, for Greenland to form a tipping point that has significant effect on the UK the
process would more likely be through AMOC weakening/shutdown due to ice melt injecting
more freshwater in the Atlantic. This is because the main process for mass loss is surface
melting - a process that occurs at a steady rate that would not suddenly accelerate unlike the
marine ice shelf/cliff instability processes that could act elsewhere – and our proximity to
Greenland reducing the sea level increase due to gravitational effects of Greenland ice loss.

3.2.3 West Antarctic ice sheet

IPCC SROCC estimates for 2006-2015 for ice mass loss from Antarctica are 155 ± 19 Gt yr–1
(equivalent to 0.43 ± 0.05 mm yr–1), mostly due to rapid thinning and retreat of major outlet
glaciers draining the West Antarctic Ice Sheet (very high confidence).
Changes in Antarctic Ice sheet extent are deemed possible (IPCC SROCCC, 2019) and there
are several mechanisms by which this could occur:

 • Change in surface mass balance – where ice melts faster than snow can accumulate
 - this is the dominant process for ice loss in East Antarctica.
 • Ice flow processes – dynamical flow of ice and melting.
 • Marine Ice Sheet Instability –this occurs when a critical threshold (“grounding line”) is
 reached, where an ice sheet is no longer attached to the land bed beneath, so it floats
 atop ocean making it unstable, vulnerable to changes in circumpolar circulation and
 more likely to melt at a faster rate. (Rignot et al, 2014; Favier et al, 2014; Joughin et
 al, 2014)
 • Marine Ice Cliff Instability (Pollard et al. 2015) - disintegration of floating ice shelves
 which leave behind structurally unstable coastal ice cliffs taller than around 100m in
 height that could collapse leaving further unstable ice cliffs that could in turn collapse
 leading to a self-reinforcing accelerating ice loss cycle.

The main risk of abrupt change comes from West Antarctica, which is losing ice mass primarily
due to ice flow processes but could start rapidly losing more ice from accelerating instability
processes. Self-sustaining feedback processes have been identified that could lead to a
substantial acceleration in mass loss from Antarctica over the 21st century and beyond: Marine
Ice Sheet Instability (MISI) and Marine Ice Cliff Instability (MICI) see Figure 7. Marine ice cliff
instability self-sustaining feedback could lead to a contribution to global sea level rise from

 Page 26 of 52
© Crown copyright 2021, Met Office
Antarctica alone of around 1m by 2100 if it developed rapidly (DeConto and Pollard, 2016,
Palmer et al. 2018 and Edwards et al. 2019). Then beyond 2100, if established, the impacts
from MISI/MICI will be of much greater magnitude in the coming centuries.

Figure 7: Schematic Diagram displaying MISI and MICI ice -melt process. Taken from Deconto and
Pollard 2016.

For RCP2.6, Deconto & Pollard (2016) estimates of Antarctic contribution to Global mean
sea level rise are similar to that of UKCP18 but for higher emissions scenarios are
considerably higher (Table 3 and Figure 8). This is because Deconto and Pollard (2016)
have accounted for additional marine ice sheet/cliff instability processes described above.

 Page 27 of 52
© Crown copyright 2021, Met Office
Table 3: Global Mean Sea Level Rise (GMSLR) and Antarctic Contribution at 2100. Range provided in
brackets.
 CMIP5 GMSLR CMIP5 Deconto and Deconto and
 (relative to Antarctic Pollard upper Pollard lower
 1986-2005, contribution to estimate of estimate of
 GMSLR Antarctic Antarctic
 from IPCC
 (relative to contribution contribution
 SCROCC 2019
 1986-2005, (relative to 2000, (relative to 2000,
 Table 4.4)
 from Deconto & from Deconto &
 from IPCC
 Pollard (2016)) Pollard (2016))
 SCROCC 2019
 Table 4.4)

 RCP2.6 43cm (29cm to 4cm (1cm to 11cm (0 to 22cm) 2cm (-11cm to 15cm)
 59 cm) 11cm)

 RCP4.5 55cm (39cm to 6cm (1cm to 49 cm (29 to 69cm) 26cm (-2cm to 54cm)
 72cm) 15cm)

 RCP8.5 84cm (61cm to 12cm (3cm to 1.05m (75cm to 64cm (15cm to
 1.1m) 28cm) 1.35m) 1.15m)

Figure 8: An illustration of the impact of DeConto and Pollard (2016) simulations of Antarctic ice
mass loss on the UKCP18 21st century sea-level projections. Also shown are the likely range
projections and High-End range from IPCC SROCC (2019).

However, they are not necessarily more likely as the surface melt rates used, which drive
these instability processes, were considerably higher than that estimated by CMIP5 multi
model projections which are estimating up to 1m by 2100 (See Figure 8). IPCC SROCC
projects significant on-going committed sea level rise out to 2300 of several meters (IPCC

 Page 28 of 52
© Crown copyright 2021, Met Office
SROCC, 2019). A study by Clark et al. (2016) looking at long-term commitment to sea level
rise estimated that with the 470Pg C released up to 2000, even if we were to reach net-zero
emissions tomorrow, without further action we would be committed to approximately 1.7m
(range of 1.2 to 2.2m) of global mean sea level rise. Further release of another 470Pg C
resulting in approximately another 9m, most of which is due to Antarctic melting (Clark et al.
2016).
Figure 8 also shows these estimates of global mean sea level rise up to 2100 alongside those
of H++ high-end scenario developed with UKCP09 projections and the Deconto and Pollard
estimates that include accelerating instability processes MISI and MICI. Should either of these
scenarios be realised in the event of Antarctica reaching a tipping point that accelerates
melting, global mean sea level rise would be considerably higher than current projections of
UKCP18 and IPCC. Importantly, there is huge uncertainty in the magnitude of this
acceleration. IPCC does state low confidence in statements about this as there is uncertainty
and lack of process understanding, with model experiments relying on parameterised
processes.

3.2.4 What Antarctic melting means for the UK?

In contrast to the scaling for Greenland (Figure 6) the scaling for UK sea level estimates due
to gravitation effects of Antarctic mass loss is very close to 1 for all UK regions (see Figure 9).
So, the contribution to all areas of the UK from Antarctica alone does not vary much regionally
and is similar to what it contributes globally.

Figure 9 Fingerprint patterns of sea level rise adjustments necessary due to regional gravitational
effects for Antarctic (lower). See for fingerprints for Greenland.

 Page 29 of 52
© Crown copyright 2021, Met Office
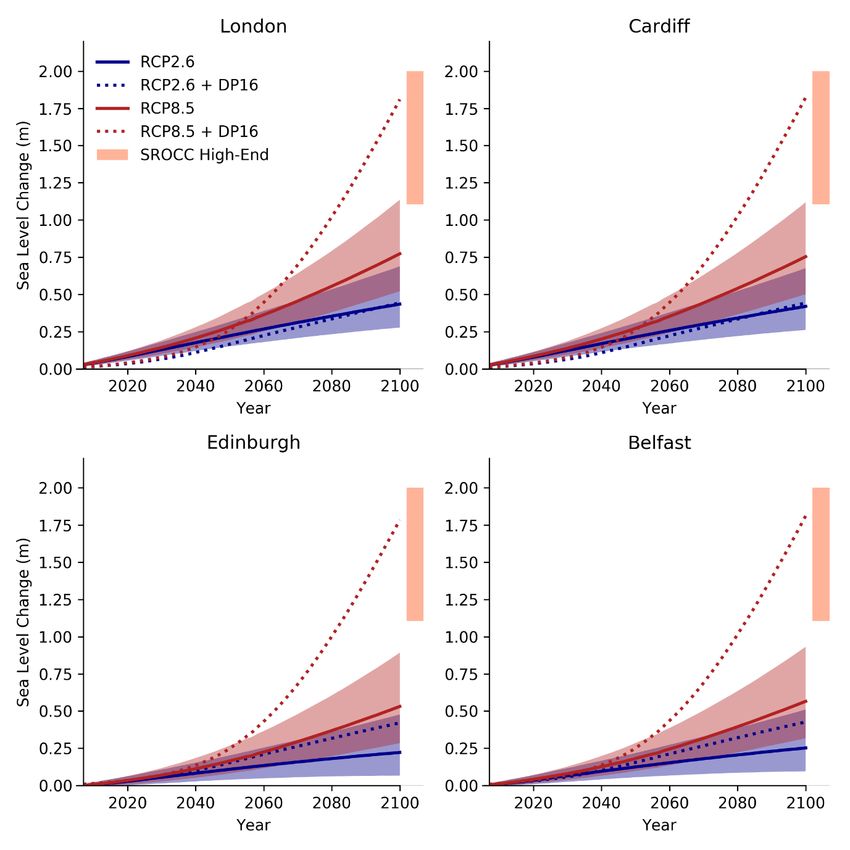
Table 4: Comparison of CMIP5 and Deconto and Pollard (2016) Antarctic contributions.

 Scenario CMIP5 Antarctic Deconto and Pollard Deconto and Pollard
 contribution in cm to upper estimate of lower estimate of
 GMSLR (relative to Antarctic contribution Antarctic contribution
 1986-2005, from IPCC in cm (relative to 2000, (relative to 2000, from
 SCROCC 2019 Table from Deconto & Deconto & Pollard
 4.4) Pollard (2016)) (2016))

 RCP2.6 4 (1 to 11) 11 (0 to 22) 2 (-11 to 15)

 RCP4.5 6 (1 to 15) 49 (29 to 69) 26 (-2 to 54)

 RCP8.5 12 (3 to 28) 105 (75 to 135) 64 (15 to 115)

Table 4 it may seem that the Antarctic contributions to GMSLR in RCP8.5 of only a few cm by
2100 are trivial compared to the total GMSLR but in RCP8.5 which these values are based on
does not include the same extent of marine instability or the self-enhancing feedback of ice
shelf/ice cliff collapse that is included in the Deconto and Pollard (2016) experiment.
The UKCP18 RCP2.6 and RCP8.5 Antarctic contributions are replaced by the central estimate
of Deconto and Pollard (2016) given in Table 4 and displayed alongside the original UKCP18
projections in Figure 10 for 4 UK Capital cities. It is clear from Figure 10 that when including
Deconto and Pollard estimates of Antarctic melting (via MISI and MICI) that sea levels could
rise far quicker than CMIP5-based projections from UKCP18 and IPCC suggest. So
considerably accelerated Antarctic melting in the event of a tipping point could result in
significantly higher levels of sea level rise of up to 2m by 2100 around the UK.

 Page 30 of 52
© Crown copyright 2021, Met Office
You can also read