Oxidation of low-molecular-weight organic compounds in cloud droplets: global impact on tropospheric oxidants - Recent
←
→
Page content transcription
If your browser does not render page correctly, please read the page content below
Atmos. Chem. Phys., 21, 9909–9930, 2021
https://doi.org/10.5194/acp-21-9909-2021
© Author(s) 2021. This work is distributed under
the Creative Commons Attribution 4.0 License.

Oxidation of low-molecular-weight organic compounds in
cloud droplets: global impact on tropospheric oxidants
Simon Rosanka1 , Rolf Sander2 , Bruno Franco3 , Catherine Wespes3 , Andreas Wahner1 , and Domenico Taraborrelli1
1 Institute
          of Energy and Climate Research: Troposphere (IEK-8), Forschungszentrum Jülich GmbH, Jülich, Germany
2 Atmospheric  Chemistry Department, Max Planck Institute for Chemistry, Mainz, Germany
3 Spectroscopy, Quantum Chemistry and Atmospheric Remote Sensing (SQUARES),

Université libre de Bruxelles (ULB), Brussels, 1050, Belgium

Correspondence: Simon Rosanka (s.rosanka@fz-juelich.de)

Received: 6 October 2020 – Discussion started: 4 November 2020
Revised: 2 March 2021 – Accepted: 7 April 2021 – Published: 1 July 2021

Abstract. In liquid cloud droplets, superoxide anion (O−  2(aq) )   tions from the Infrared Atmospheric Sounding Interferome-
is known to quickly consume ozone (O3(aq) ), which is rel-          ter (IASI) for 2015. In general, the explicit in-cloud oxidation
atively insoluble. The significance of this reaction as a tro-      leads to an overall reduction in predicted OVOC levels and
pospheric O3 sink is sensitive to the abundance of O−      2(aq)    reduces EMAC’s overestimation of some OVOCs in the trop-
and therefore to the production of its main precursor, the hy-      ics. The in-cloud OVOC oxidation shifts the HO2 production
droperoxyl radical (HO2(aq) ). The aqueous-phase oxidation          from the gas to the aqueous phase. As a result, the O3 budget
of oxygenated volatile organic compounds (OVOCs) is the             is perturbed with scavenging being enhanced and the gas-
major source of HO2(aq) in cloud droplets. Hence, the lack          phase chemical losses being reduced. With the simplified in-
of explicit aqueous-phase chemical kinetics in global atmo-         cloud chemistry, about 13 Tg yr−1 of O3 is scavenged, which
spheric models leads to a general underestimation of clouds         increases to 336 Tg yr−1 when JAMOC is used. The highest
as O3 sinks. In this study, the importance of in-cloud OVOC         O3 reduction of 12 % is predicted in the upper troposphere–
oxidation for tropospheric composition is assessed by us-           lower stratosphere (UTLS). These changes in the free tropo-
ing the Chemistry As A Boxmodel Application (CAABA)                 sphere significantly reduce the modelled tropospheric ozone
and the global ECHAM/MESSy Atmospheric Chemistry                    columns, which are known to be generally overestimated by
(EMAC) model, which are both capable of explicitly repre-           EMAC and other global atmospheric models.
senting the relevant chemical transformations. For this anal-
ysis, three different in-cloud oxidation mechanisms are em-
ployed: (1) one including the basic oxidation of SO2(aq) by
O3(aq) and H2 O2(aq) , which thus represents the capabilities of    1   Introduction
most global models; (2) the more advanced standard EMAC
mechanism, which includes inorganic chemistry and simpli-           Aqueous-phase chemistry in cloud droplets differs signifi-
fied degradation of methane oxidation products; and (3) the         cantly from gas-phase chemistry, mainly due to photolysis
detailed in-cloud OVOC oxidation scheme Jülich Aqueous-             enhanced by scattering effects within cloud droplets (Bott
phase Mechanism of Organic Chemistry (JAMOC). By using              and Zdunkowski, 1987; Mayer and Madronich, 2004), faster
EMAC, the global impact of each mechanism is assessed fo-           reaction rates, and chemical reactions that do not occur in
cusing mainly on tropospheric volatile organic compounds            the gas phase (Herrmann, 2003; Epstein and Nizkorodov,
(VOCs), HOx (HOx = OH + HO2 ), and O3 . This is achieved            2012). Moreover, the conversion of nitrogen monoxide (NO)
by performing a detailed HOx and O3 budget analysis in              to nitrogen dioxide (NO2 ) by peroxy radicals (RO2 ) essen-
the gas and aqueous phase. The resulting changes are eval-          tially does not take place in liquid droplets because NO
uated against O3 and methanol (CH3 OH) satellite observa-           is very insoluble (Lelieveld and Crutzen, 1990). Compared
                                                                    to gas-phase chemistry, models of aqueous-phase chemistry

Published by Copernicus Publications on behalf of the European Geosciences Union.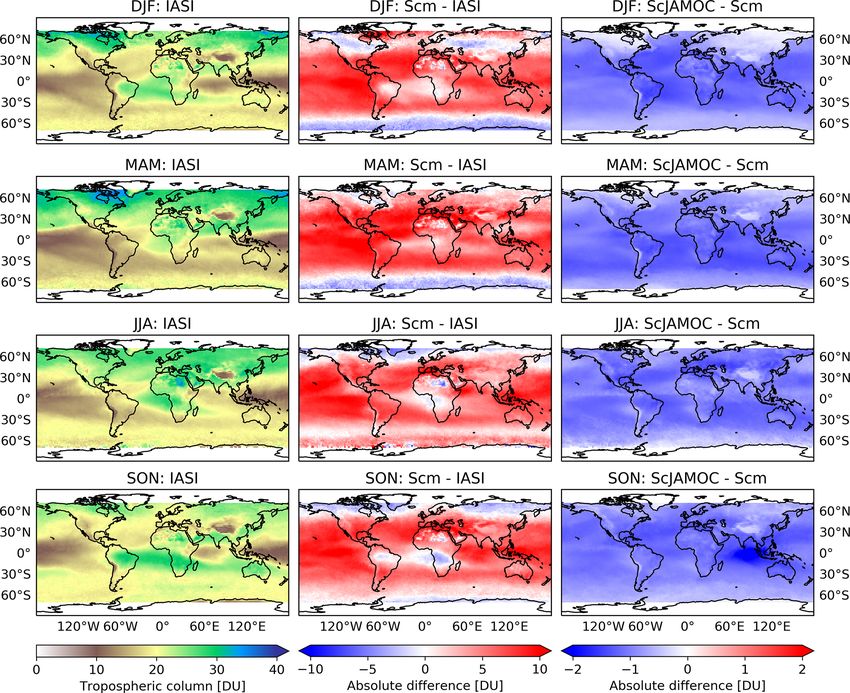
9910                                       S. Rosanka et al.: Impact of in-cloud OVOC chemistry on tropospheric oxidants

                                                                   sources, Liang and Jacob (1997) underestimated O−   2(aq) con-
                                                                   centrations dampening the in-cloud destruction of O3(aq) .
                                                                   Due to these changes in the gas-phase oxidation budgets,
                                                                   clouds indirectly impact the formation of secondary organic
                                                                   aerosols (SOAs). Further, the in-cloud oxidation of OVOC
                                                                   leads to the formation and destruction of SOA precursors.
                                                                   Therefore, clouds can act as SOA sources (Blando and
                                                                   Turpin, 2000), and modelling studies suggest that clouds may
                                                                   contribute on the same order of magnitude to the SOA forma-
                                                                   tion as gas-phase sources (Ervens et al., 2011; Ervens, 2015;
                                                                   Lin et al., 2012).
                                                                      It is thus desirable to properly represent aqueous-phase
                                                                   chemistry in global models. Unfortunately, the detailed rep-
                                                                   resentation of aqueous-phase chemistry comes at a high
                                                                   computational cost. Thus, compared to gas-phase chemistry,
                                                                   aqueous-phase chemistry is poorly represented in most re-
Figure 1. Graphical representation of inorganic aqueous-phase      gional and global models. Further, it is often limited to
ozone chemistry based on Staehelin et al. (1984).                  basic sulfur dioxide (SO2(aq) ) oxidation as the only in-
                                                                   cloud O3(aq) destruction pathway in the aqueous phase (Er-
                                                                   vens, 2015). The reduced Chemical Aqueous Phase Radi-
still suffer from large uncertainties, and most global models      cal Mechanism (CAPRAM-RED) is based on CAPRAM 3.0i
only include rudimentary implementations (Ervens, 2015).           (Tilgner and Herrmann, 2010) and represents about 200 re-
In general, warm (liquid) clouds can act as a sink for ozone       actions (Deguillaume et al., 2009). So far, it has been ap-
(O3 ) and its precursors in the troposphere. Figure 1 gives        plied in 2-D applications using the regional chemistry trans-
an overview of the inorganic aqueous-phase chemistry for           port model COSMO-MUSCAT (Deguillaume et al., 2009;
O3(aq) according to the mechanism by Staehelin et al. (1984).      Schrödner et al., 2014). On a global scale, Myriokefalitakis
When O3 is taken up into cloud droplets, it is mainly de-          et al. (2011) studied the formation of oxalate using an ex-
stroyed via                                                        plicit aqueous-phase mechanism using about 50 reactions
                                                                   in an offline 3-D model. When investigating present online
O3(aq) + O−        −
          2(aq) → O3(aq) + O2(aq) .                        (R1)    global modelling capabilities, the global ECHAM/MESSy
                                                                   Atmospheric Chemistry (EMAC) model constitutes an ex-
The superoxide anion (O− 2(aq) ) is in equilibrium with its con-   ception. The technical advances implemented by Tost et al.
jugate acid, the hydroperoxyl radical (HO2(aq) ):                  (2006) allow an explicit representation of aqueous-phase pro-
HO2(aq)     O−        +                                            cesses. EMAC’s standard aqueous-phase mechanism repre-
             2(aq) + H(aq) .                               (R2)
                                                                   sents more than 150 reactions and even includes a sim-
Here, HO2(aq) is either scavenged from the gas phase or pro-       plified degradation scheme of methane oxidation products
duced by photo-oxidation inside the cloud droplet. The real-       (Tost et al., 2007). However, an extensive and explicit in-
istic representation of clouds as O3 sinks is thus sensitive to    cloud OVOC oxidation scheme suitable for EMAC and other
a proper representation of HO2(aq) in cloud droplets.              global models in general has not been available. By neglect-
   The importance of aqueous-phase chemistry for tropo-            ing in-cloud OVOC oxidation, aqueous-phase HO2(aq) con-
spheric O3 has already been the topic of many earlier studies.     centrations are very likely underestimated. Thus, it is ex-
Lelieveld and Crutzen (1990) proposed that clouds strongly         pected that global atmospheric models underestimate clouds
influence O3 , HOx (HOx = HO2 + OH), and NOx (NOx =                as O3 sinks. In order to make a detailed in-cloud OVOC ox-
NO + NO2 ). They concluded that under high-NOx condi-              idation scheme readily available for box as well as for re-
tions, the net O3 production is decreased by as much as 40 %       gional and global simulations that is affordable with mod-
at particular regions affected by clouds. However, Liang and       ern supercomputing facilities, we have developed the Jülich
Jacob (1997) suggested that Lelieveld and Crutzen (1990)           Aqueous-phase Mechanism of Organic Chemistry (JAMOC)
grossly overestimated the impact of clouds on O3 because           and implemented it into the atmospheric chemistry mech-
they made the assumption that the methyl peroxy radical            anism Module Efficiently Calculating the Chemistry of the
(CH3 O2 ) could have the same solubility as HO2 . They pre-        Atmosphere (MECCA) in our companion paper by Rosanka
dicted that clouds reduce tropospheric O3 by less than 3 %         et al. (2021). In JAMOC, the phase transfer of species con-
in the tropics and at mid-latitudes during summer. A major         taining up to 10 carbon atoms is taken into account, and a
aqueous-phase source of HO2(aq) is the oxidation of water-         selection of species containing up to 4 carbon atoms is con-
soluble oxygenated volatile organic compounds (OVOCs).             sidered to react in the aqueous phase, resulting in more than
However, by not considering additional in-cloud HO2(aq)            1000 reactions. Isoprene (C5 H8 ), the most abundantly emit-

Atmos. Chem. Phys., 21, 9909–9930, 2021                                             https://doi.org/10.5194/acp-21-9909-2021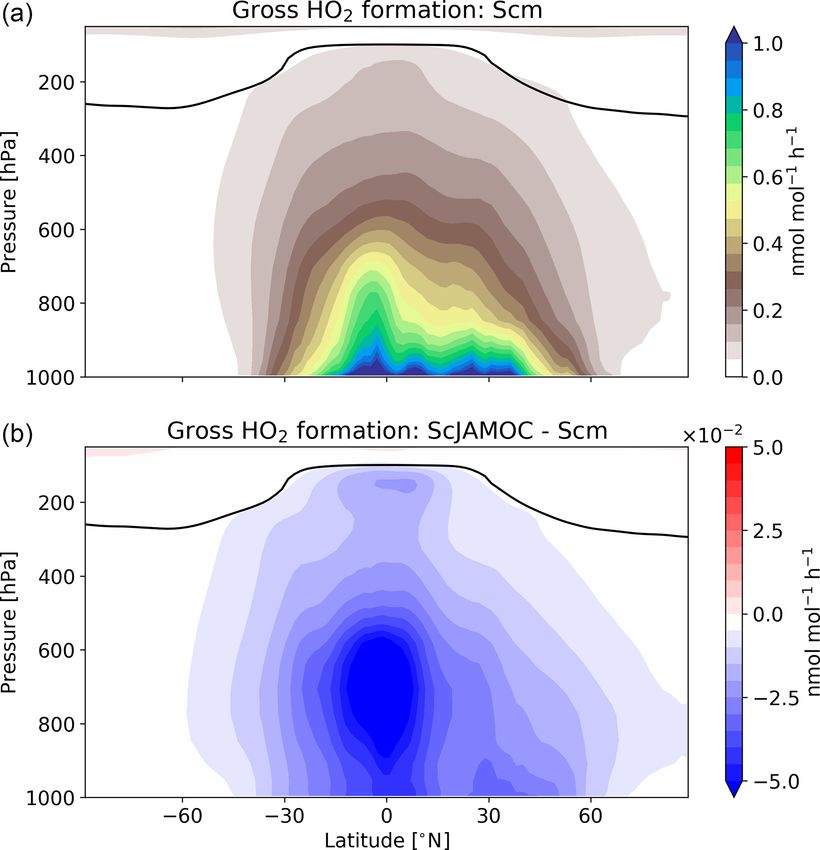
S. Rosanka et al.: Impact of in-cloud OVOC chemistry on tropospheric oxidants                                            9911

ted volatile organic compound (VOC), is not explicitly dis-       2.1.1   Aqueous phase
solved but many of its oxidation products explicitly react
inside cloud droplets. Here, OVOC reactions with hydroxyl         The first aqueous-phase mechanism includes the uptake of a
radicals (OH(aq) ) are implemented as the main daytime oxi-       few soluble compounds, their acid–base equilibria, and the
dation pathway, whereas nitrate radicals (NO3(aq) ) represent     oxidation of SO2(aq) by O3(aq) and H2 O2(aq) . This mech-
the main nighttime oxidant.                                       anism was applied by Jöckel et al. (2006) and is consid-
   In this study, JAMOC is implemented into the global            ered to represent the capabilities of most global models
model EMAC (Sect. 2) and its importance for tropospheric          (Ervens, 2015). The second aqueous-phase mechanism in-
VOCs, HOx , and O3 is addressed. The performance of               cludes an advanced scheme, representing more than 150 re-
JAMOC is compared to the performance of an aqueous-phase          actions (Tost et al., 2007; Jöckel et al., 2016). It includes
mechanism including only minimal aqueous-phase chem-              in-cloud HOx(aq) chemistry and the destruction of O3(aq)
istry and to that of the standard mechanism of EMAC (each         by O− 2(aq) , but it misses a detailed in-cloud OVOC oxida-
presented in Sect. 2.1). In order to understand the mechanism     tion scheme. This mechanism can be considered the cur-
behind the impact of in-cloud OVOC oxidation on a single          rent standard mechanism used in EMAC. The last aqueous-
air parcel, a box-model study is performed in Sect. 3. Af-        phase mechanism is the complex OVOC oxidation scheme
terwards, the impact on a global scale is analysed (Sect. 4).     JAMOC developed in our companion paper by Rosanka et al.
The analysis focuses on a selection of VOCs, HOx , and O3 .       (2021). This mechanism is based on the box-model mecha-
The multiphase chemistry of JAMOC is expected to impact           nism Cloud Explicit Physico-chemical Scheme (CLEPS 1.0;
tropospheric organic acids, which will be the topic of a fur-     Mouchel-Vallon et al., 2017). In order to make it applicable
ther study. When considering the global O3 budget, odd oxy-       for global models, Rosanka et al. (2021) reduced the num-
gen (Ox ) is analysed to account for rapid cycling between        ber of aqueous-phase species to a selection containing up to
species of the Ox family. In the scope of this study, Ox is       4 carbon atoms. JAMOC represents the photo-oxidation of
defined as                                                        all species containing 1 and 2 carbon atoms represented in
                                                                  CLEPS but limits the photo-oxidation of species with 3 or
Ox ≡ O + O3 + NO2 + 2 × NO3 + 3 × N2 O5 + HNO3                    4 carbon atoms to the major products from C5 H8 oxidation
       + HNO4 + ClO + HOCl + ClNO2 + 2 × ClNO3                    (i.e. methylglyoxal, methacrolein, and methyl vinyl ketone)
       + BrO + HOBr + BrNO2 + 2 × BrNO3 + PANs                    and the in-cloud sources of methylglyoxal. Still, the phase
                                                                  transfer of soluble species containing up to 10 carbon atoms
       + PNs + ANs + NPs,                                  (1)    is represented in JAMOC. In addition to CLEPS, Rosanka
                                                                  et al. (2021) extended JAMOC by (1) simulating hydration
where PANs are peroxyacyl nitrates, PNs are alkyl peroxy
                                                                  and dehydration explicitly; (2) taking the oligomerisation of
nitrates, ANs are alkyl nitrates, and NPs are nitrophenols.
                                                                  formaldehyde, glyoxal, and methylglyoxal into account; (3)
In Sect. 4, all EMAC simulations performed are evaluated
                                                                  adding further aqueous-phase photolysis reactions; and (4)
against satellite observations of O3 and methanol (CH3 OH)
                                                                  considering the gas-phase photo-oxidation of new outgassed
obtained from the Infrared Atmospheric Sounding Interfer-
                                                                  species. Overall, JAMOC represents the phase transfer of 350
ometer (IASI). Model uncertainties are discussed in Sect. 5,
                                                                  species, 43 equilibria (acid–base and hydration), and more
followed by a general conclusion (Sect. 6).
                                                                  than 280 photo-oxidation reactions. A complete description
                                                                  of JAMOC, including a list of all reactions, is available in
2     Modelling approach                                          Rosanka et al. (2021). Even though Fenton’s chemistry is an
                                                                  in-cloud source of OH(aq) , this chemistry is not considered
The aqueous- and gas-phase mechanisms are presented in            in this study (switched off in JAMOC) due to missing global
Sect. 2.1. They are used within two different modelling           iron (Fe) distributions and emissions in EMAC. The associ-
frameworks: a box model and a global atmospheric model.           ated uncertainties for excluding this OH(aq) sources are dis-
The box model, used to investigate the local impact on an         cussed in Sect. 5.
air parcel, is presented in Sect. 2.2, and the global chemical
atmospheric model is presented in Sect. 2.3. Section 2.4 pro-     2.1.2   Gas phase
vides an overview of all simulations performed in this study.
                                                                  The Mainz Organic Mechanism (MOM; Sander et al., 2019)
2.1    The chemical mechanisms                                    is used to model gas-phase chemistry, containing an ex-
                                                                  tensive oxidation scheme for isoprene (Taraborrelli et al.,
The study is based on the comparison of three different           2009, 2012; Nölscher et al., 2014), monoterpenes (Hens
aqueous-phase mechanisms (Sect. 2.1.1). While they are            et al., 2014), and aromatics (Cabrera-Perez et al., 2016).
characterised by different levels of complexity, especially in    In addition, comprehensive reaction schemes are considered
terms of the species and reactions taken into account, they are   for the modelling of the chemistry of NOx , HOx , CH4 , and
all coupled to the same gas-phase mechanism (Sect. 2.1.2).        anthropogenic linear hydrocarbons. VOCs are oxidised by

https://doi.org/10.5194/acp-21-9909-2021                                          Atmos. Chem. Phys., 21, 9909–9930, 2021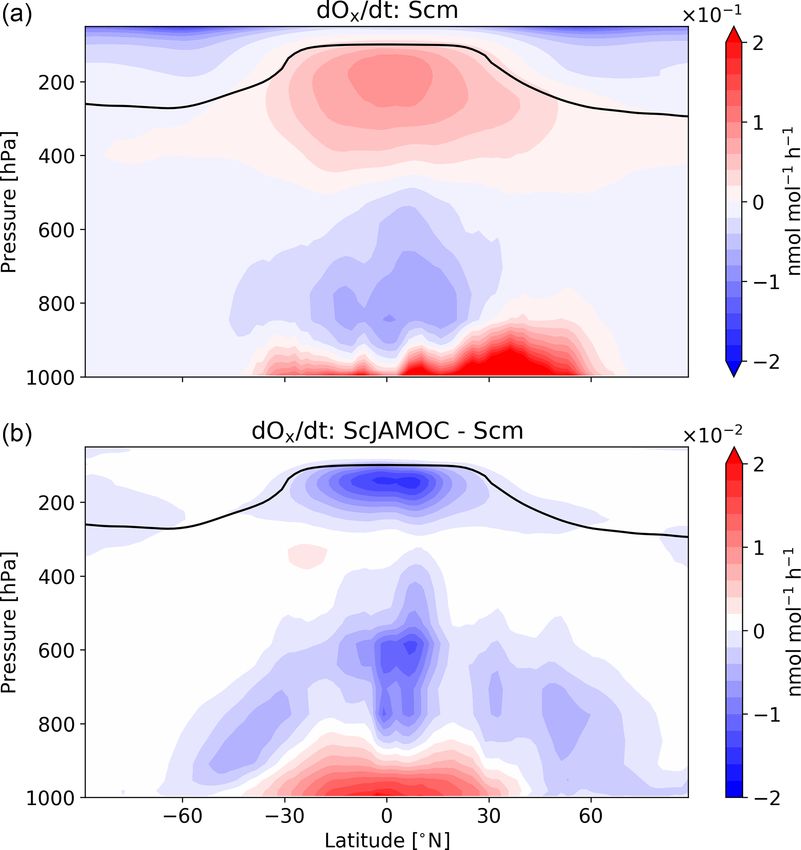
9912                                      S. Rosanka et al.: Impact of in-cloud OVOC chemistry on tropospheric oxidants

OH, O3 , and NO3 , whereas RO2 reacts with HO2 , NOx , and           In contrast to CAABA, gas- and aqueous-phase chem-
NO3 and undergoes self- and cross-reactions (Sander et al.,       istry are calculated separately. In order to model the gas-
2019). When the complex in-cloud OVOC oxidation scheme            phase mechanism MOM in the troposphere and stratosphere,
JAMOC is coupled to MOM, MOM is modified following                the submodel MECCA is used. The SCAVenging submodel
the gas-phase additions as described in Rosanka et al. (2021).    (SCAV; Tost et al., 2006) is used to simulate the removal
                                                                  of trace gases and aerosol particles by clouds and precipita-
2.2    Chemistry box model CAABA                                  tion. SCAV calculates the transfer of species into and out of
                                                                  rain and cloud droplets using the Henry’s law equilibrium,
Each of the three mechanisms is implemented in the Chem-          acid dissociation equilibria, oxidation–reduction reactions,
istry As A Boxmodel Application (CAABA; Sander et al.,            heterogeneous reactions on droplet surfaces, and aqueous-
2019) in order to investigate their implications for a sin-       phase photolysis reactions (Tost et al., 2006). In this study,
gle air parcel under predefined atmospheric conditions. The       SCAV is used to calculate the three aqueous-phase mecha-
MECCA submodel in CAABA is capable of numerically in-             nisms presented in Sect. 2.1.1. Like MECCA, SCAV treats
tegrating the multiphase chemical mechanism as one single         the aqueous-phase mechanism as an ODE system and uses
system of ordinary differential equations (ODEs) with appro-      KPP (version 1) to solve it. This operator splitting is neces-
priate phase-transfer reactions (Sander, 1999; Kerkweg et al.,    sary because the ODE systems resulting from the combina-
2007). The Kinetic PreProcessor (KPP version 2.2.3; Sandu         tion of gas-phase and in-cloud aqueous-phase mechanisms
and Sander, 2006) is used in MECCA to integrate these ODE         would suffer from (1) a higher stiffness due to fast acid–base
systems. Further, photolysis, emissions and dry deposition        equilibria and phase-transfer reactions and (2) load imbal-
of chemical species, and the exchange with other air masses       ances on high-performance computing (HPC) systems due to
outside the box (entrainment) are represented in a simplified     the sparsity of clouds. In both MECCA and to some degree
manner.                                                           SCAV, tagging systems are used to calculate detailed gas-
   In this study, an air parcel during summer is simulated at a   and aqueous-phase Ox and HOx budgets. These systems al-
mid-latitude with a constant temperature of 278 K and a rela-     low the estimation of the full implications of the aqueous-
tive humidity of 100 %. The same initial conditions are used      phase mechanism for atmospheric chemistry. The tagging
as proposed in Rosanka et al. (2021, see their Table 3), but      system of MECCA is more sophisticated and allows for ob-
the NO emissions are neglected in this study. In order to rep-    taining reaction rates from multiple reactions and combining
resent a realistic atmospheric cloud event and investigate the    them into a single tracer (Gromov et al., 2010). For the tro-
impact of the newly developed aqueous-phase mechanism,            pospheric Ox budget, the gas-phase chemical production and
three atmospheric conditions are modelled during the simu-        loss and the scavenging and wet deposition are taken into ac-
lated day. First, CAABA is initialised at 00:00 UTC, and no       count by using MECCA and SCAV, respectively. Addition-
cloud droplets are present until 12:00 UTC. At 12:00 UTC a        ally, the dry deposition of Ox and many MOM species is cal-
cloud is formed with droplet radii of 20 µm and a liquid wa-      culated by the submodel Dry DEPosition (DDEP; Kerkweg
ter content of 0.3 g m−3 . After 1 h, the cloud evaporates and    et al., 2006) using its default scheme.
all species outgas. The rest of the day is simulated using the       The MESSy submodel Model of Emissions of Gases and
same conditions as before the cloud event.                        Aerosols from Nature (MEGAN) is used to model bio-
                                                                  genic VOC emissions (Guenther et al., 2006). Global iso-
2.3    Global model EMAC
                                                                  prene emissions are scaled to the best estimate of Sinde-
The ECHAM/MESSy Atmospheric Chemistry (EMAC)                      larova et al. (2014), which is 595 Tg yr−1 . Biomass burning
model is a numerical chemistry and climate simulation sys-        emission fluxes are calculated using the MESSy submodel
tem that includes submodels describing tropospheric and           BIOBURN, which calculates these fluxes based on biomass
middle atmospheric processes and their interaction with           burning emission factors and dry matter combustion rates.
oceans, land, and human influences (Jöckel et al., 2010). It      For the latter, Global Fire Assimilation System (GFAS) data
uses the second version of the Modular Earth Submodel Sys-        are used, which are based on satellite observations of fire ra-
tem (MESSy2) to link multi-institutional computer codes.          diative power from the Moderate Resolution Imaging Spec-
The core atmospheric model is the fifth-generation Euro-          troradiometer (MODIS) satellite instruments (Kaiser et al.,
pean Centre Hamburg general circulation model (ECHAM5;            2012). The biomass burning emission factors for VOCs are
Roeckner et al., 2003). For the present study, EMAC               based on Akagi et al. (2011).
(ECHAM5 version 5.3.02, MESSy version 2.54.0) is used                The submodel SORBIT (Jöckel et al., 2010) is used to
at T63L90MA resolution, i.e. with a spherical truncation of       sample the model state along sun-synchronous satellite or-
T63 (corresponding to a quadratic Gaussian grid of approx-        bits, at the time of the satellite overpass, and to compare
imately 1.875◦ by 1.875◦ in latitude and longitude) with 90       the model outputs to satellite observations obtained from
vertical hybrid pressure levels up to 0.01 hPa.                   the Infrared Atmospheric Sounding Interferometer (IASI,
                                                                  Clerbaux et al., 2009) on board the Metop-A (IASI-A)
                                                                  and Metop-B (IASI-B) satellites. In particular, Fast Opti-

Atmos. Chem. Phys., 21, 9909–9930, 2021                                            https://doi.org/10.5194/acp-21-9909-2021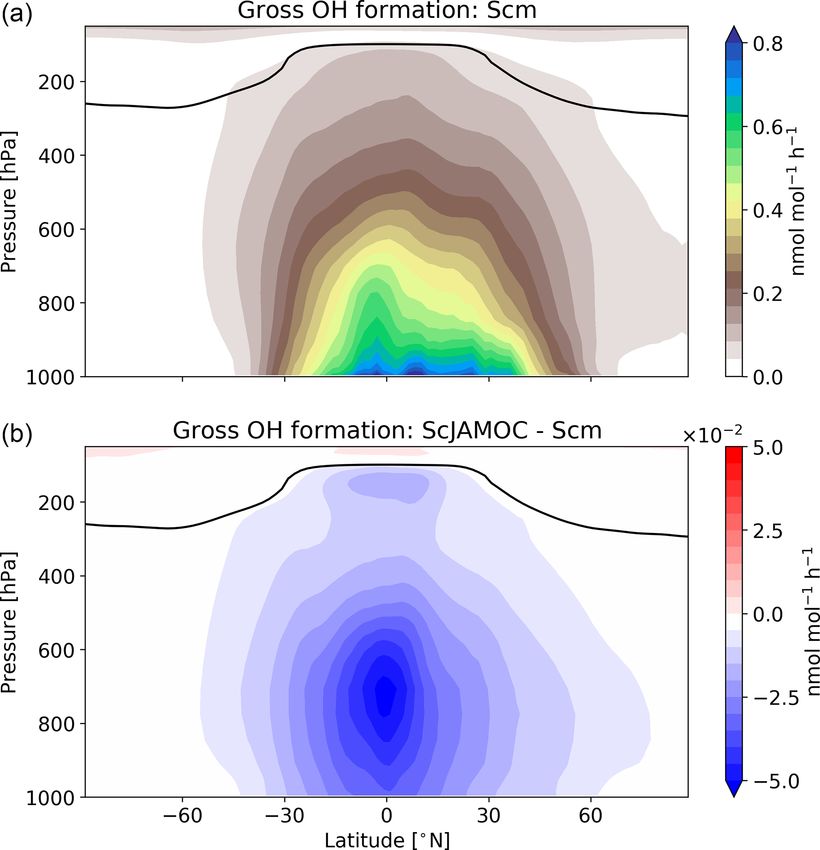
S. Rosanka et al.: Impact of in-cloud OVOC chemistry on tropospheric oxidants                                               9913

mal Retrievals on Layers for IASI Ozone (FORLI-O3 , ver-           mechanism on a single air parcel is investigated. For com-
sion 20151001; see Hurtmans et al., 2012, for a description        parison, the same day is simulated in CAABA using the
of the retrievals) is used for the comparison of tropospheric      same initial conditions but excluding the specific cloud event
O3 columns. In general, when analysing tropospheric bur-           at 12:00 UTC. The global impact is investigated by per-
dens and budgets, the standard EMAC tropopause defini-             forming a reference and two sensitivity simulations with
tion is used. Here, the tropopause is defined in the extrat-       EMAC. Global simulations without any in-cloud aqueous-
ropics using potential vorticity, whereas temperature lapse        phase chemistry lead to unrealistic concentrations of O3
rates are used in the tropics (Jöckel et al., 2006). However,      and other chemical species (Tost et al., 2007). Therefore,
when comparing modelled tropospheric O3 columns to IASI-           the reference simulation includes the minimal scavenging
FORLI measurements, the troposphere is defined as ranging          mechanism (in the following called Scm). The two sensi-
from the ground to 300 hPa in order to limit the influences of     tivity simulations use the standard EMAC (in the follow-
the stratospheric O3 but to include the altitude of maximum        ing called ScSta) and the detailed OVOC oxidation aqueous-
sensitivity of IASI in the troposphere (Wespes et al., 2017).      phase mechanism (in the following called ScJAMOC). For
Moreover, this allows the avoiding of larger errors that affect    consistency, the same simulation names are used for the
the O3 retrievals in the upper troposphere–lower stratosphere      CAABA simulations. In EMAC, the years 2014 and 2015 are
(UTLS) (Wespes et al., 2016) and that result in a positive         simulated, where 2014 is discarded as spin-up. A summary
column bias (Boynard et al., 2016). The evaluation of sim-         of the gas- and aqueous-phase mechanisms used in each
ulation results against global observational datasets of VOC       CAABA and EMAC simulation performed in this study is
abundance can be performed for only a few species. Daily           given in Table 1. All simulations were performed at the Jülich
global distributions of methanol total columns are avail-          Supercomputing Centre with the JURECA and JUWELS
able from IASI-A and IASI-B observations, using a neural-          clusters (Jülich Supercomputing Centre, 2018, 2019).
network-based retrieval approach (Franco et al., 2018). Due
to the limited vertical information on methanol that is con-
tained in the IASI spectra, only total columns have been re-       3   Box-model results
trieved. Since the neural-network-based retrievals do not rely
on scene-dependent a priori information, no averaging ker-         Figure 2 shows the time evolution of selected gas-phase
nels are produced and the retrieved total columns are meant        species for the different aqueous-phase mechanisms Scm,
to be compared at face value with model data (see Franco           ScSta, and ScJAMOC for the cloud scenario of CAABA (see
et al., 2018, and references therein). For this purpose, the       Sect. 2.2). For comparison, the results of the no-cloud sce-
IASI methanol measurements have been daily averaged on             nario are also shown. Both Scm and ScSta have only little
the EMAC T63 spatial grid. The comparisons with IASI O3            impact on most of the OVOCs explicitly treated in JAMOC.
and methanol data are associated with some observational           For some OVOCs, the phase transfer considered in Scm and
uncertainties. IASI retrievals are obtained in the thermal in-     ScSta leads to reduced gas-phase concentrations during the
frared range, resulting in an especially high sensitivity to       cloud event. After the cloud evaporates, gas-phase concentra-
clouds. Appropriate filters are applied in order to account        tions are slightly higher compared to the no-cloud scenario,
for cloud-contaminated IASI scene observations. These fil-         since the OVOCs transferred into the cloud droplet generally
ters are based on defined cloud cover thresholds, using infor-     do not oxidise. Within ScSta, a subset of these OVOCs (con-
mation from the EUMETCast operational processing system            taining one carbon atom) are oxidised, leading to a slight re-
(August et al., 2012). The fractional cloud cover threshold        duction compared to Scm. In contrast, ScJAMOC efficiently
depends on the species observed. For O3 and methanol, all          removes OVOCs, leading to reduced OVOC concentrations
observations with a fractional cloud cover above 13 % (We-         overall. Glyoxal, one of the OVOC examples presented in
spes et al., 2017) and 25 % (Franco et al., 2018) have been        Fig. 2, is completely removed from the gas phase and quickly
excluded, respectively. The IASI methanol retrievals are less      hydrated within the cloud droplet. The irreversible oxidation
sensitive to the presence of residual clouds since no radia-       of its hydrated forms and oligomers leads to a reduction in in-
tive transfer model is used, resulting in a higher threshold for   cloud glyoxal concentrations. In the gas-phase, glyoxal itself
methanol. Of course, it cannot be completely ruled out that        is produced by the oxidation of hydrocarbons. Due to low
individual IASI measurements are locally affected by resid-        aqueous-phase HOx concentrations during the cloud event,
ual clouds that passed the filtering. However, due to the huge     the oxidation of these hydrocarbons is reduced. After the
dataset used for the seasonal averages, it is considered that      cloud evaporates, the higher hydrocarbon concentrations lead
such an effect is diluted and is globally negligible.              to some glyoxal being produced.
                                                                      Each mechanism leads to changes in most gas-phase radi-
2.4   Simulations performed                                        cal concentrations. As soon as the cloud droplets form, gas-
                                                                   phase HOx is reduced due to the uptake of radicals and rad-
In both modelling frameworks, multiple simulations are             ical precursors within the first few minutes. This becomes
performed. In CAABA, the impact of each aqueous-phase              evident when inspecting the results of Scm: in this mecha-

https://doi.org/10.5194/acp-21-9909-2021                                            Atmos. Chem. Phys., 21, 9909–9930, 2021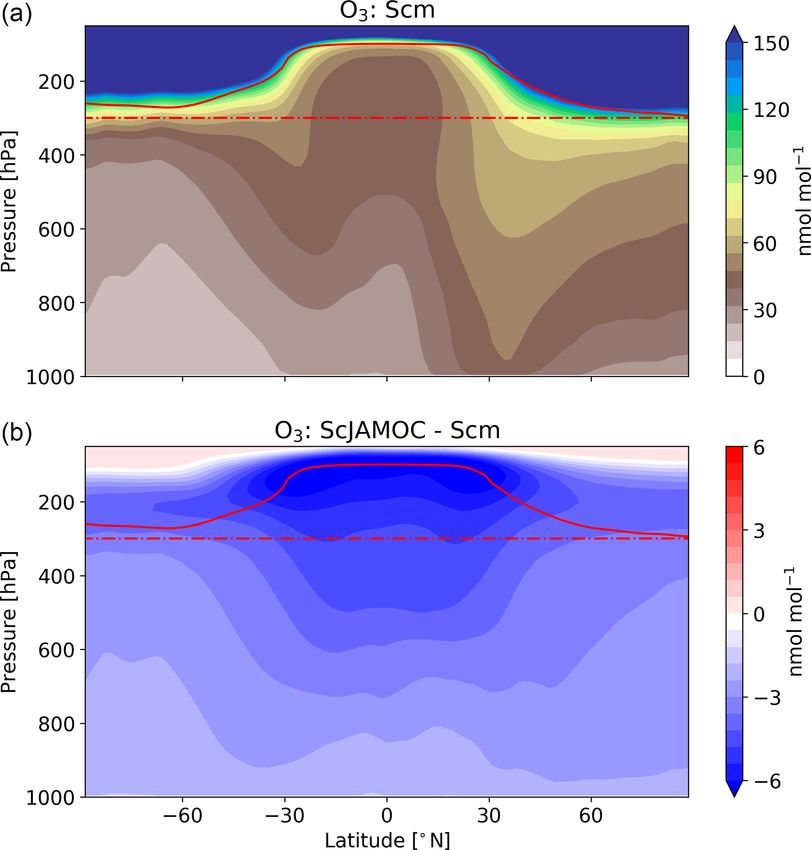
9914                                                 S. Rosanka et al.: Impact of in-cloud OVOC chemistry on tropospheric oxidants

Table 1. Characteristics of the gas- and aqueous-phase mechanism used for each simulation performed in this study using CAABA and
EMAC.

                                 Gas-phase                                            Aqueous-phase mechanism
               Simulation        mechanism          Phase transfer         Equilibriaa       Oxidation        Photolysis        Original reference
               Scm               MOMb                             14            12                     3                  –     Jöckel et al. (2006) c
               ScSta             MOMb                             34            17                    58                  3     Tost et al. (2007)
               ScJAMOC           MOMb, d                         350            43                   266                 23     Rosanka et al. (2021)
             a Acid–base and hydration equilibria. b Mainz Organic Mechanism (MOM; Sander et al., 2019). c Representative of most global models (see
             Table 1 in Ervens, 2015). d Modified to represent the gas-phase photo-oxidation of gem-diols and oxalic acid (see Sect. 2.1.2 and Rosanka et al.,
             2021).

                                                                                                                 P
Figure 2. Time evolution for gas-phase mixing ratios of the sum of all the OVOCs explicitly reacting in JAMOC ( OVOCs; see Eq. A1 in
Appendix A), glyoxal, glycolaldehyde, methylglyoxal, HO2 , OH, NOx , and O3 within the box model CAABA. The time when the cloud is
present (between 12:00 and 13:00 UTC) is indicated by blue background shading. Nighttime is indicated by grey background shading. Mixing
ratios are provided for no-cloud event (black line), Scm (green line), ScSta (purple line), and ScJAMOC (red line). The characteristics of
each simulation are provided in Table 1. Note that lines may overlap.

nism, the uptake of HOx is not taken into account. Here, the                             of 1.3 × 10⁻¹³ and 2.5 × 10⁻⁸ M for OH(aq) and HO2(aq) , re-
gas-phase HO2 concentration is still reduced due to the up-                              spectively. These predictions are of similar magnitude com-
take of a few HO2 sources (e.g. formaldehyde). In the case of                            pared to the results of CLEPS (see Fig. 4 in Mouchel-Vallon
the other mechanisms, the uptake of HOx is explicitly con-                               et al., 2017) and observations and predictions by Tilgner et al.
sidered and leads to an additional reduction in gas-phase con-                           (2013) and Arakaki et al. (2013).
centrations when the cloud forms. In the case of ScJAMOC                                    When the cloud forms, gas-phase O3 is reduced in compar-
and, to some extent, of ScSta, the additional partitioning of                            ison to the no-cloud scenario because of its reactive uptake
OVOCs into the cloud droplet leads to a further decrease in                              into the cloud droplet. Within Scm, O3(aq) only reacts with
gas-phase HOx concentrations. The reduction in OH is in                                  SO2(aq) , leading to only a little reduction in gas-phase O3 .
line with other modelling studies for cloud events (Tilgner                              This reduction is more pronounced for ScSta and ScJAMOC
et al., 2013). When the cloud evaporates, radicals and radical                           due to additional aqueous-phase sinks and the uptake of HO2
sources are transferred to the gas phase. For ScJAMOC, the                               into the cloud droplet. For ScJAMOC, the reduction in O3 is
efficient in-cloud oxidation of radical sources induces signif-                          larger due to the additional aqueous-phase HO2(aq) sources
icantly lower HOx concentrations after the cloud evaporates.                             from OVOC oxidation. In the gas phase, the significantly re-
The photolysis of OVOCs and their oxidation within cloud                                 duced HO2 concentrations cause NOx to increase (HO2 be-
droplets cause an increase in HOx(aq) of about 50 %. In Sc-                              ing the major sink of NOx ). However, it mostly dampens the
JAMOC, CAABA predicts average in-cloud concentrations                                    production of O3 after the cloud event.

Atmos. Chem. Phys., 21, 9909–9930, 2021                                                                          https://doi.org/10.5194/acp-21-9909-2021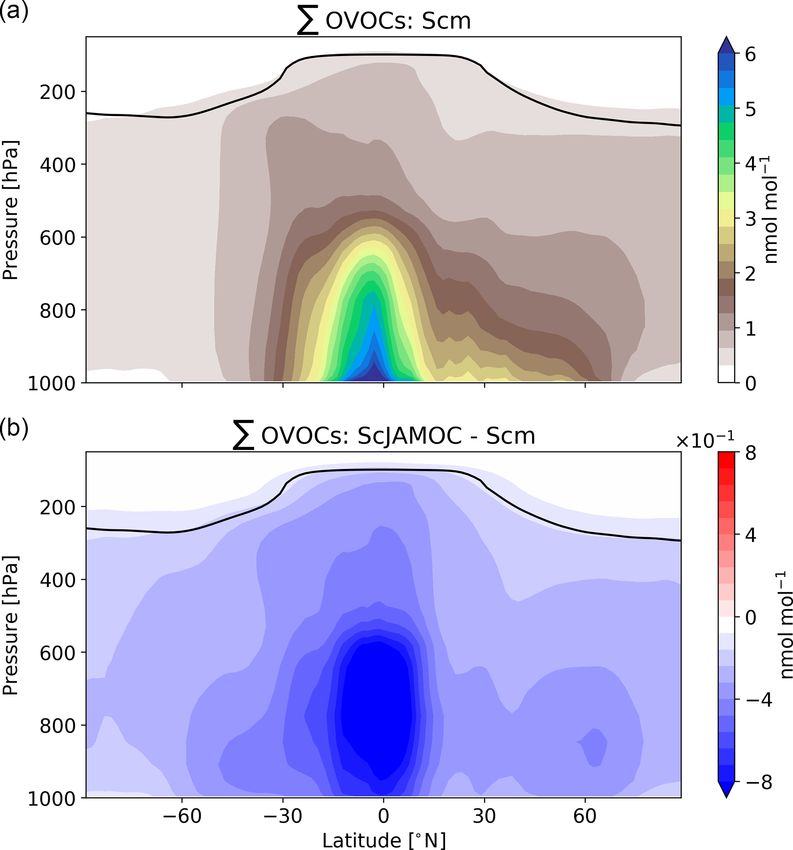
S. Rosanka et al.: Impact of in-cloud OVOC chemistry on tropospheric oxidants                                                    9915

                                                                      Table 2. Mean gas-phase tropospheric burden in 2015 for a selec-
                                                                      tion of VOCs for Scm and the changes induced by ScSta and Sc-
                                                                      JAMOC. The characteristics of each simulation are provided in Ta-
                                                                      ble 1. Burden values are given in gigagrams (Gg).

                                                                                                        Scm    1ScSta    1ScJAMOC
                                                                       C1 VOCs
                                                                       Formaldehyde                   1212.3    −46.6        −204.2
                                                                       Methanol                       3279.3   −341.0        −998.8
                                                                       Methyl hydroperoxide           1914.5    −32.9        −849.9
                                                                       Hydroxymethyl hydroperoxide      67.8     +0.2         −16.0
                                                                       C2 VOCs
                                                                       Ethanol                         110.9     +0.4         −16.6
                                                                       Ethylene glycol                   3.1     +0.1          −1.4
                                                                       Acetaldehyde                    147.1     +1.7         +12.1
                                                                       Glycolaldehyde                  278.8     −0.9        −101.2
                                                                       Glyoxal                          44.6      0.0         −12.7
                                                                       Ethyl hydroperoxide              62.9     −0.9         −28.3
                                                                       C3 VOCs
                                                                       Methylglyoxal                   181.8     −0.6         −35.3
                                                                       Isopropyl hydroperoxide          13.0     −0.2          −4.6

Figure 3. Yearly zonal mean mixing ratio P of the sum of all the
OVOCs explicitly reacting in JAMOC ( OVOCs; see Eq. A1 in
Appendix A) for Scm (a) and in comparison to ScJAMOC (b).             tio of the Psum of all OVOCs that are explicitly treated in
The characteristics of each simulation are provided in Table 1. The   JAMOC ( OVOCs; see Eq. A1 in Appendix A) for Scm.
yearly mean tropopause is depicted by a black line.                   High OVOC concentrations are predicted in the lower tro-
                                                                      posphere and at lower latitudes, consistent with strong ter-
                                                                      restrial biogenic emissions at the Earth surface. By the gen-
4     Global impact on atmospheric composition
                                                                      eral upward transport in the equatorial region, OVOCs are
This section evaluates the importance of in-cloud OVOC ox-            transported into the free troposphere. Due to deep convec-
idation on a global scale by focusing on VOCs (Sect. 4.1),            tion events in the same region, OVOCs are even transported
and HOx (Sect. 4.2). The importance for tropospheric O3 is            into the dry tropical upper troposphere. The lower panel of
discussed in Sect. 4.3.                                               Fig. 3 shows the changes
                                                                                            P     in the sum of OVOCs explicitly
                                                                      treated in JAMOC ( OVOCs; see Eq. A1 in Appendix A)
4.1    Impact on tropospheric VOCs                                    obtained by comparing Scm and ScJAMOC. Overall, the tro-
                                                                      pospheric OVOC burden is reduced with the largest change
The extensive aqueous-phase OVOC oxidation scheme                     in the tropical free troposphere. The frequent occurrence of
JAMOC considers many VOC sinks. These significantly in-               clouds in this region and the high OVOC concentrations lead
fluence the concentrations of tropospheric VOCs. In general,          to an efficient removal of gas-phase OVOCs. The ubiquity of
VOCs can be split into primarily emitted VOCs and OVOCs               clouds in the NH extratropics allows for additional removal
mostly formed from secondary production (e.g. oxidation of            of OVOCs from the gas phase. These results are in line with
primarily emitted VOCs). The main global source of pri-               the box-model results presented above (see Fig. 2). The effi-
marily emitted VOCs is biogenic processes. The largest bio-           cient removal of OVOCs in warm clouds significantly affects
genic emissions take place in the equatorial region (e.g. Ama-        the OVOC levels in the dry tropical upper troposphere. Here,
zon Basin, Central Africa) with additional emissions in the           these OVOCs act as an important HOx source, potentially
Northern Hemisphere (NH) and Southern Hemisphere (SH)                 influencing the production of O3 (Jaeglé et al., 2001).
extratropics. Isoprene, the most abundant biogenic VOC, is               Table 2 provides an overview of the annual tropospheric
only slightly influenced by ScJAMOC. The yearly mean tro-             burden for a selection of VOCs explicitly treated in JAMOC.
pospheric burden increases from 204 (Scm) to 213 Gg (Sc-              As shown in Fig. 3, the global burden of most VOCs is
JAMOC). This increase is caused by changes in OH concen-              reduced due to the uptake and oxidation processes imple-
trations, the main isoprene oxidant (see Sect. 4.2). Primar-          mented in ScJAMOC. Because of the low number of VOCs
ily emitted VOCs are quickly oxidised in the lower tropo-             containing one carbon atom treated in ScSta, changes be-
sphere, leading to low concentrations in the free troposphere.        tween Scm and ScSta are only minor. The burden of some
The top panel of Fig. 3 shows the zonal mean mixing ra-               VOCs even increases in ScSta, which is caused by reduced

https://doi.org/10.5194/acp-21-9909-2021                                               Atmos. Chem. Phys., 21, 9909–9930, 2021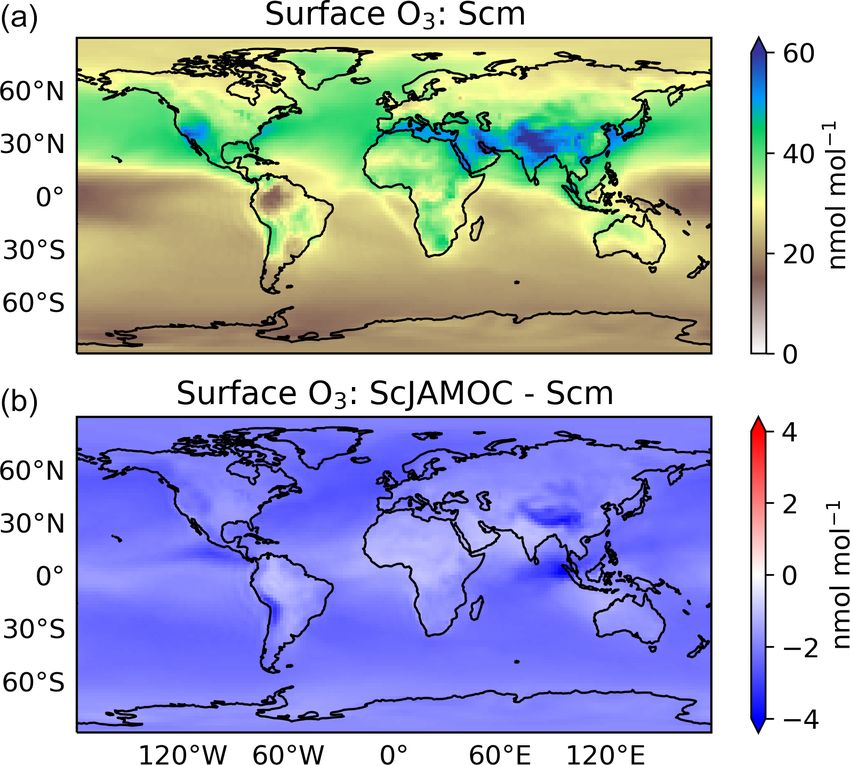
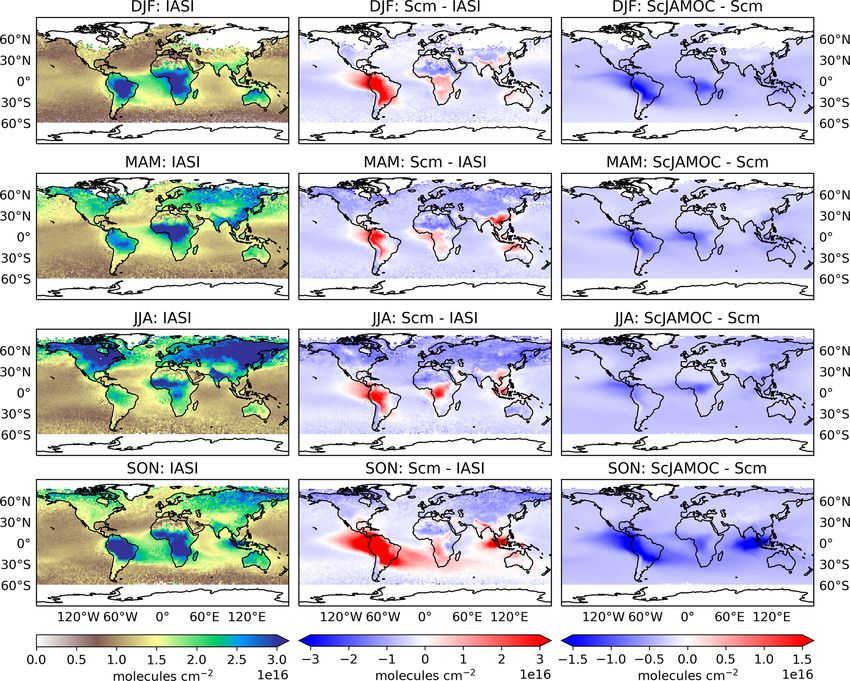
9916                                         S. Rosanka et al.: Impact of in-cloud OVOC chemistry on tropospheric oxidants

Figure 4. Seasonal-mean (seasons are December–February, DJF; March–May, MAM; June–August, JJA; September–November, SON) inte-
grated methanol column obtained from IASI satellite observations (left), of the Scm simulation in comparison to IASI observations (centre),
and of ScJAMOC in comparison to Scm (right). The characteristics of each simulation are provided in Table 1.

HOx concentrations (see Sect. 4.2). The impact in ScJAMOC               phase oxidation. This leads to a relative change that is sim-
differs for each VOC, with some VOCs in terms of absolute               ilar to the one of ethylene glycol. Acetaldehyde is the only
changes being efficiently removed, whereas others are only              OVOC for which an enhanced burden is predicted. This is
slightly impacted. The varying efficiency of the VOCs re-               partially due to newly implemented in-cloud sources but in
moval by clouds is explained by differences in their Henry’s            particular to the aqueous-phase oxidation of methylglyoxal
law constants, accommodation coefficients, and aqueous-                 yielding pyruvic acid, which is a known source of acetalde-
phase reactivities. The burden of methanol, the OVOC con-               hyde (Berges and Warneck, 1992).
taining one carbon atom for which the highest absolute                     Figure 4 shows the seasonal-mean methanol column for
change is predicted, is reduced by about 1000 Gg. For methyl            the IASI observations. In addition, the differences of Scm
hydroperoxide the total change is lower but the relative re-            vs. IASI and ScJAMOC vs. Scm are shown. The high-
duction is higher, which is due to slightly higher solubility           est methanol columns occur close to its major biogenic
and overall higher reaction rate constants for the oxidation            sources (e.g. Amazon Basin, boreal forests). When using
by OH(aq) and NO3(aq) . Formaldehyde is reduced by about                Scm, EMAC underestimates methanol at mid-latitudes and
16 %. Even though ethanol has a Henry’s law constant sim-               overestimates it close to methanol’s main tropical biogenic
ilar to that of methanol, the relative reduction is still signifi-      sources (see centre column, Fig. 4). Both these model in-
cantly smaller, due to slower aqueous-phase oxidation. Ethy-            consistencies are caused by an incorrect spatial distribu-
lene glycol has slow aqueous-phase oxidation but very high              tion of biogenic emissions. The submodel MEGAN, used to
solubility, which results in a substantial reduction in its tro-        simulate biogenic methanol emissions (see Sect. 2.3), esti-
pospheric burden. The opposite holds for ethyl hydroperox-              mates yearly biogenic methanol emissions of 104 Tg yr−1 ,
ide, which is 4 times less soluble but undergoes fast aqueous-          which is close to the 103 Tg yr−1 estimated by Millet et al.

Atmos. Chem. Phys., 21, 9909–9930, 2021                                                    https://doi.org/10.5194/acp-21-9909-2021
S. Rosanka et al.: Impact of in-cloud OVOC chemistry on tropospheric oxidants 9917
(2008, their Table 2). However, the spatial distribution of
biogenic emissions from MEGAN is different to their pre-
dictions. Compared to Millet et al. (2008), MEGAN sig-
nificantly overestimates biogenic emissions in the Amazon
Basin but underestimates emissions at middle and high lati-
tudes. EMAC simulates the Amazon Basin as too dry in the
dry season (September–November, SON) and consequently
too hot (Hagemann and Stacke, 2015). The biogenic emis-
sions in MEGAN are temperature-dependent, and generally
higher temperatures induce higher emissions. Thus, the posi-
tive bias in surface temperatures in EMAC leads to an overes-
timation in the Amazon Basin. Additionally, uncertainties for
all coefficients used in MEGAN, related to the emissions of
methanol and primarily emitted VOCs (e.g. isoprene) further
influence the incorrect emission distribution. EMAC also un-
derestimates methanol over the oceans. In the current simula-
tion setup, the ocean is represented to only act as a methanol
sink but should be considered a source as well over certain
oceans (e.g. over the Pacific; see Millet et al., 2008). How-
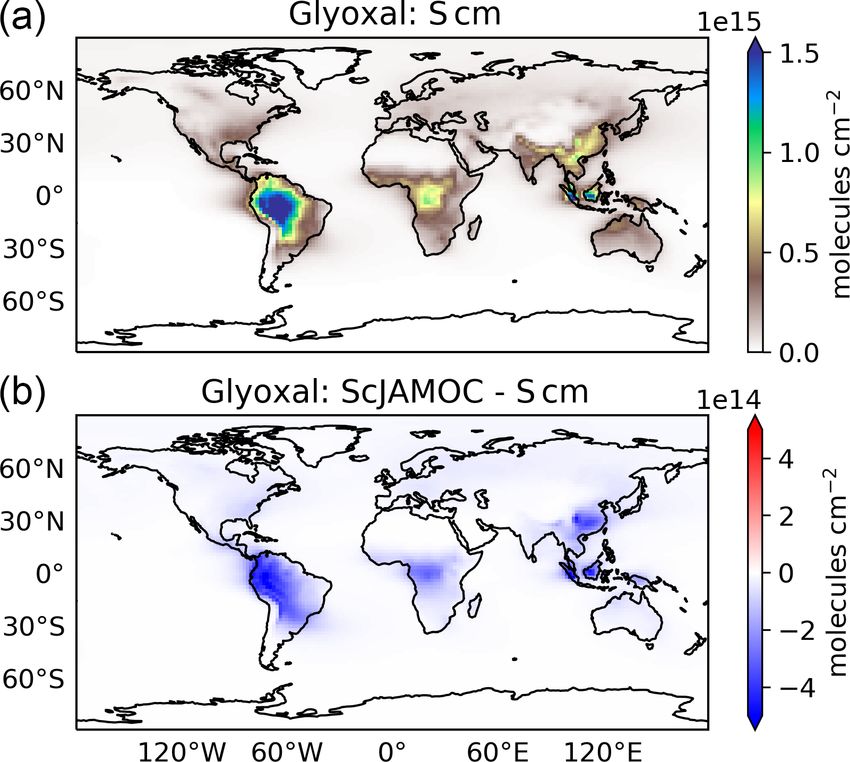
Figure 5. Mean integrated tropospheric glyoxal column for Scm
ever, EMAC models the ocean as a net sink with an uptake
(a) and in comparison to ScJAMOC (b). The characteristics of each
of about 2.1 Tg yr−1 , which is smaller than the predicted net
simulation are provided in Table 1.
sink from Millet et al. (2008) of 16 Tg yr−1 . It is thus ex-
pected that there is an additional deficiency in the represen-
tation of the gas-phase chemistry of methanol in MOM. Still, by ScJAMOC. In the gas phase, glyoxal is an oxidation prod-
when using ScJAMOC, the model bias for methanol is par- uct of hydrocarbons. Therefore, high glyoxal concentrations
tially resolved (see right column of Fig. 4). In areas where the are predicted by EMAC close to strong biogenic hydrocarbon
sources are expected to be modelled correctly (i.e. Central sources (e.g. Amazon Basin). As found with the CAABA box
Africa, East Asia), the additional in-cloud OVOC oxidation model, atmospheric glyoxal levels are significantly reduced
leads to a reduction in methanol partially resolving the model by the chemical loss in cloud droplets with ScJAMOC (see
bias in these regions. However, ScJAMOC is not able to com- Table 2). When comparing these results to satellite retrievals
pletely resolve the model bias over the Amazon Basin. The from Alvarado et al. (2014, their Fig. 9), it can be concluded
positive model bias away from its major sources (i.e. over that the spatial distribution is reasonably well captured by
oceans) is reduced and partially resolved. Especially during Scm. However, glyoxal levels are generally overestimated in
the NH autumn (SON), the strong model bias over the East regions where biogenic emissions dominate. The additional
Pacific and the South Atlantic Ocean is reduced. At the same sink introduced into ScJAMOC leads to a significant reduc-
time, a high overestimation for Scm is observed southeast tion in the model bias, especially in the Amazon Basin and
of India over the Indian Ocean. The strong El Niño event over Central Africa. However, the model bias is not yet fully
in 2015/16 led to droughts, draining the already-dry Indone- resolved in the Amazon Basin. Here, the too-high biogenic
sian peatland. This drying, in combination with widespread hydrocarbon emissions from MEGAN are the cause of an
deforestation, led to strong Indonesian fires, emitting large overestimated production of glyoxal. It is important to keep
amounts of VOCs (Parker et al., 2016). This positive model in mind that the comparability with these satellite retrievals
bias is strongly reduced when in-cloud methanol oxidation is limited due to a different year simulated. It is still expected
is taken into account (ScJAMOC). A detailed analysis of that the yearly mean spatial distributions of biogenic emis-
the Indonesian peatland fires in 2015 and the importance of sions are comparable for both years and mainly vary in their
detailed in-cloud OVOC oxidation during such a pollution magnitudes. To conclude, when using JAMOC (ScJAMOC)
event is presented by Rosanka et al. (2020b). the representation of methanol and glyoxal gas-phase con-
To the best of our knowledge, glyoxal satellite retrievals centrations is significantly improved within EMAC.
from the Ozone Monitoring Instrument (OMI; Levelt et al.,
2006) are only available up to 2014, while the TROPO- 4.2 Impact on tropospheric HOx
spheric Monitoring Instrument (TROPOMI) started its oper-
ations in late 2017. Levelt et al. (2018) report that this is due VOCs play an important role in the production and loss of
to detector degradation and the challenging nature of glyoxal OH and HO2 . Thus, the additional uptake of VOCs will influ-
retrievals. A detailed analysis for the year 2007 is performed ence the tropospheric OH budget. In the troposphere, OH is
by Alvarado et al. (2014). Figure 5 gives the yearly mean in- primarily produced by the reaction of O(1 D) with H2 O. Here,
tegrated glyoxal column for Scm and the changes introduced the main source of O(1 D) is the photolysis of O3 . Figure 6
https://doi.org/10.5194/acp-21-9909-2021 Atmos. Chem. Phys., 21, 9909–9930, 2021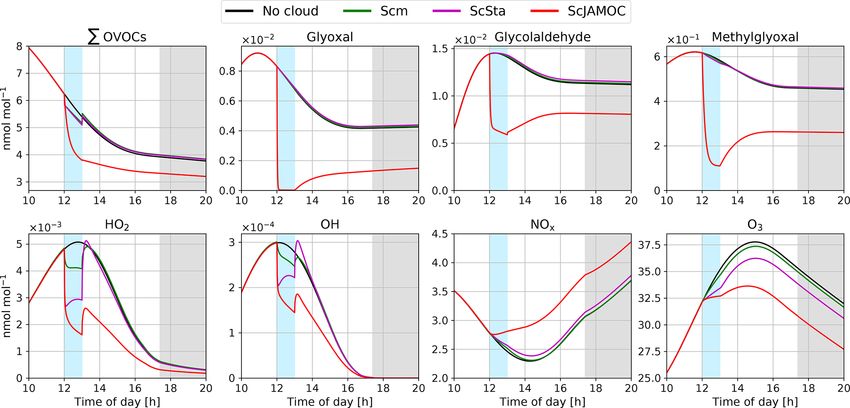
9918                                        S. Rosanka et al.: Impact of in-cloud OVOC chemistry on tropospheric oxidants

Figure 6. Zonal-mean gross OH formation for Scm (a) and in com-      Figure 7. Zonal-mean gross HO2 formation for Scm (a) and in com-
parison to ScJAMOC (b). The characteristics of each simulation are   parison to ScJAMOC (b). The characteristics of each simulation are
provided in Table 1. The yearly mean tropopause is depicted by a     provided in Table 1. The yearly mean tropopause is depicted by a
black line.                                                          black line.

gives the zonal mean of the total OH production of Scm and           with their reported budgets. However, the authors report a
the changes predicted by ScJAMOC. OH is mainly produced              lower tropospheric gross OH formation of 251.2 Tmol yr−1
in the lower troposphere by both its primary and its sec-            while using the same tropopause definition. This difference
ondary sources, whereas in the upper troposphere secondary           is mainly related to the different years simulated (leading
sources dominate. Table 3 gives an overview of the tropo-            to different emissions) and a lower model resolution used
spheric gas-phase OH sources and sinks. With ScJAMOC,                (T42L31, approximately 2.8 by 2.8◦ in latitude and longi-
the gross OH formation decreases by about 7.3 % from 280.2           tude with 31 vertical layers). Specifically, the lower number
to 259.8 Tmol yr−1 . This finding is consistent with the box-        of tropospheric levels is expected to influence tropospheric
model results (Fig. 2). The uptake and oxidation of VOCs in          budgets.
the aqueous phase reduce the contribution of VOCs to the OH             Figure 7 shows the zonal HO2 production for Scm and the
production. However, the major reduction in the OH produc-           changes predicted in ScJAMOC. Due to the fast intercon-
tion is caused by overall reduced tropospheric O3 concentra-         version within the HOx family, the spatial distribution and
tions. Specifically, the two largest O3 sinks, namely the OH         magnitude of the HO2 production are similar to the produc-
production induced by O3 photolysis and the reaction of O3           tion of OH. Table 4 gives the gas-phase HO2 budget for each
with HO2 , are reduced by 8.5 %. O3 has a long atmospheric           simulation. The HO2 production changes from about 315 to
lifetime, leading to low spatial variability in the reduction        290 Tmol yr−1 for Scm and ScJAMOC, respectively. Lower
in tropospheric O3 . However, the reduction in VOC concen-           VOC concentrations lead to a reduction in the HO2 produc-
trations has high spatial variability (see Fig. 3), largely de-      tion. Here, the influence of VOCs containing one carbon
termining the spatial distribution of the reduction in the to-       atom is the highest (see Table 2). Thus, VOCs become less
tal OH formation by ScJAMOC (Fig. 6b). The removal of                important as an HO2 sink. The highest reduction is caused
VOCs containing one carbon atom presents the largest con-            by the reduced availability of HO2 , significantly reducing
tribution to the reduction. The reduction in HOx leads to            radical–radical reactions as an HO2 sink.
an additional reduction in the destruction of OH from HOx               Tables 3 and 4 also provide the in-cloud budgets for OH(aq)
cross-reactions (HO2 + OH and OH + OH). The OH budget                and HO2(aq) . The representation of the aqueous-phase chem-
presented in this study compares well with earlier EMAC              istry of OH(aq) in clouds strongly affects the HO2(aq) pro-
studies by Lelieveld et al. (2016), which used the standard          duction. The aqueous-phase budget of OH(aq) differs signif-
in-cloud EMAC mechanism (ScSta). The relative contribu-              icantly between ScSta and ScJAMOC, which explicitly treat
tions of each OH source and sink in ScSta are comparable             in-cloud HOx(aq) kinetics. ScJAMOC has the highest total

Atmos. Chem. Phys., 21, 9909–9930, 2021                                                https://doi.org/10.5194/acp-21-9909-2021
S. Rosanka et al.: Impact of in-cloud OVOC chemistry on tropospheric oxidants                                                           9919

Table 3. Global tropospheric mean gas- and aqueous-phase source and sink fluxes of OH for Scm and the changes induced by ScSta and
ScJAMOC. The characteristics of each simulation are provided in Table 1. All values are given in Tmol yr−1 . The aqueous-phase budget is
only based on cloud droplets. Rain droplets are not taken into account. For comparison, the tropospheric OH budget presented by Lelieveld
et al. (2016) is shown in the last column. Please note that Lelieveld et al. (2016) simulated a different year and used EMAC at a lower model
resolution.

                                                           Scm     1ScSta       1ScJAMOC          Lelieveld et al. (2016)
                          Gas-phase sources
                          O(1 D) + H2 O                  96.67       −1.39             −7.11                         84.0
                          NO + HO2                       84.53       −0.25             −2.10                         76.6
                          O3 + HO2                       32.36       −0.95             −3.93                         34.4
                          H2 O2 + hν                     26.70       −0.85             −1.39                         24.8
                          OVOCs                          30.40       −0.30             −5.82                         31.4
                          Other                           9.54       +0.01             −0.02                            –
                          Total                         280.20       −3.73            −20.37                        251.2
                          Gas-phase sinks
                          OH + HOyg a                    49.88       +0.06             −1.90                         46.2
                          OH + NOy b                      4.73       +0.01             +0.11                          4.1
                          OH + CH4                       32.85       −0.02             −0.35                         29.8
                          OH + C1 c                     150.90       −2.73            −16.20                        134.8
                          OH + Cn VOCs                   39.75       −0.15             −2.70                         34.7
                          Other                           2.09        0.00              0.00                          1.6
                          Total                         280.20       −3.73            −20.37                        251.2
                          Aqueous-phase sources
                          O3 + O−2                            –      +1.94             +6.30                             –
                          H2 O2 + hν                          –      +0.95             +1.08                             –
                          C1 VOCs + hν                        –          –             +4.71                             –
                          Cn VOCs + hν                        –          –             +0.32                             –
                          Other                               –      +0.02             +0.02                             –
                          Total                               –      +2.91            +12.43                             –
                          Aqueous-phase sinks
                          OH + HOyaq d                        –      +0.42             +2.20                             –
                          C1 VOCs                             –      +2.40             +8.98                             –
                          Cn VOCs                             –          –             +0.91                             –
                          Other                               –      +0.09             +0.34                             –
                          Total                               –      +2.91            +12.43                             –
                         a HO ≡ H , O , H O , radical–radical reactions. b NO ≡ NO, NO , HNO . HNO , HNO , NH , N-reaction
                              yg      2 3 2 2                                y            2       2       3       4   3
                         products. c C1 ≡ CO, VOCs with one C atom. d HOyaq ≡ O−
                                                                               2 , H2 O2 , radical–radical reactions.

OH(aq) production with more than 12 Tmol yr−1 , which is                     the major OH(aq) sink, with OVOCs containing one carbon
about 4 times higher than in ScSta. The higher increase, com-                atom contributing the most. This oxidation leads to the most
pared to the box model (Sect. 3), is attributed to the spe-                  significant production of HO2(aq) , followed by OVOC pho-
cific box-model scenario (Sect. 2.2 and Rosanka et al., 2021,                tolysis. Due to increased aqueous-phase OH(aq) and H2 O2(aq)
their Table 3). In both ScSta and ScJAMOC, most OH(aq) is                    concentrations, the oxidation of H2 O2(aq) increases by a fac-
formed by the destruction of O3(aq) . In ScJAMOC, the pho-                   tor of 4 in ScJAMOC. The destruction of O3(aq) leads to a re-
tolysis of OVOCs leads to the second-highest formation of                    duction in O− 2(aq) . This equilibrium is therefore the dominant
OH(aq) . Here, OVOCs containing one carbon atom contribute                   HO2(aq) sink for both ScSta and ScJAMOC, since HO2(aq) is
the most, of which most OH(aq) is formed from methyl hy-                     in equilibrium with O−    2(aq) (Reaction R2). To the best of our
droperoxide. Due to higher radical concentrations, the reac-                 knowledge, no in-cloud HOx(aq) budget has been presented
tions of OH(aq) with O3(aq) and radical–radical reactions in                 so far in the literature on a global scale. The novel in-cloud
ScJAMOC contribute about 4 times as much to the loss of                      aqueous-phase budgets can thus not be compared to earlier
HOx(aq) compared to in ScSta. The oxidation of OVOCs is                      studies.

https://doi.org/10.5194/acp-21-9909-2021                                                          Atmos. Chem. Phys., 21, 9909–9930, 2021
9920 S. Rosanka et al.: Impact of in-cloud OVOC chemistry on tropospheric oxidants
Table 4. Global tropospheric mean gas- and aqueous-phase source HO2 . For ScJAMOC, the chemical production decreases by
and sink fluxes of HO2 for Scm and the changes induced by ScSta about 150 Tg yr−1 (2.6 %), mainly caused by an overall re-
and ScJAMOC. The characteristics of each simulation are provided duction in HO2 (see Sect. 4.2) and in RO2 radicals due to
in Table 1. All values are given in Tmol yr−1 . The aqueous-phase the uptake and explicit oxidation of VOCs. The chemical
budget is only based on cloud droplets. Rain droplets are not taken loss on the other hand is reduced by about 90 (1.7 %) and
into account.
about 420 Tg yr−1 (8.0 %) for ScSta and ScJAMOC, respec-
Scm 1ScSta 1ScJAMOC
tively. This reduction is mainly attributed to an overall re-
duction in tropospheric levels of O3 and HOx . The loss by
Gas-phase sources dry deposition reduces by about 50 Tg yr−1 (5.6 %) for Sc-
OH + O3 12.51 −0.18 −0.71 JAMOC, due to generally reduced surface O3 concentrations.
H2 O2 + OH 13.86 −0.44 −0.56 The largest change in the Ox budget is related to scavenging
HNO4 a 26.38 −0.52 −1.59 processes. Ox scavenging increases from about 150 (Scm) to
C1 VOCs 214.71 −3.58 −17.76 about 260 (73.3 %) and 480 Tg yr−1 (220.0 %) for ScSta and
Cn VOCs 22.33 +0.01 −0.64 ScJAMOC, respectively. Here, the biggest increase occurs
Photolysis 24.64 −0.47 −3.88 for O3 scavenging, due to the accelerated O3(aq) destruction
Other 1.26 −0.01 −0.01 by enhanced HO2(aq) (Reaction R1), which in turn enhances
Total 315.69 −5.19 −25.15 the O3 uptake. These changes in the Ox budget terms lead
Gas-phase sinks to a reduced O3 burden. Compared to the literature, the O3
burden from ScJAMOC is closer to the observational esti-
HO2 + O3 32.36 −0.95 −3.93
mate from satellite retrievals for the same time period of 287–
HO2 + OH 12.86 −0.21 −0.69
HO2 + HO2 77.34 −2.33 −8.37 311 Tg in the 60◦ S–60◦ N latitudinal band and closer to the
HO2 + NO 84.53 −0.25 −2.10 global tropospheric burden of 324 Tg derived from the IASI-
HO2 + NO2 and NO3 27.31 −0.44 −1.58 FORLI observations (Gaudel et al., 2018, their Table 5).
C1 VOCs + HO2 47.63 −1.34 −6.74 However, it is important to take into account that different
Cn VOCs + HO2 26.85 −0.22 −2.08 tropopause definitions are used in the extratropics. In Gaudel
Other 6.81 +0.55 +0.34 et al. (2018), the tropopause definition for IASI-FORLI is the
Total 315.69 −5.19 −25.15 WMO tropopause altitude definition, based on the tempera-
Aqueous-phase sources ture lapse rate (WMO, 1957). In this study, potential vorticity
is used as the tropopause definition in the extratropics (see
Mass transfer – +0.60 +0.51 Sect. 2.3). All three Ox budgets (Table 5) compare well with
H2 O2 + OH – +0.38 +1.61
a recent multi-model comparison of Young et al. (2018, see
C1 VOCs – +2.39 +10.80
their Fig. 3). The chemical loss and chemical production get
C2 VOCs – – +0.92
Other – +0.01 +0.09 closer to the multi-model mean of 4442 and 4937 Tg yr−1 ,
Total – +3.38 +13.93 respectively. The tropospheric O3 burden in ScJAMOC is
now lower than the multi-model mean of 337 Tg but closer
Aqueous-phase sinks to the observational estimate from Ziemke et al. (2011). The
HO2 O− + increased stratospheric–tropospheric exchange (STE) is still
2 +H – +2.68 +8.69
HO2 + HOyaq b – +0.69 +5.22 lower than the multi-model mean (535 Tg yr−1 ) and the ob-
Other – +0.01 +0.02 servational estimate of 489 Tg yr−1 by Olsen et al. (2013).
Total – +3.38 +13.93 The tropospheric O3 lifetime is reduced by 1 d, due to higher
−
relative changes in the Ox loss than in the tropospheric O3
a HNO → NO + HO . b HO
yaq ≡ O2 , radical–radical reactions.
4 2 2 burden.
Figure 8 gives the zonal net Ox production for Scm and
the changes in ScJAMOC. In general, Ox is produced where
4.3 Impact on tropospheric O3 NOx concentrations are high (close to the surface and in the
upper troposphere). In the free troposphere, above the plan-
The efficient oxidation of OVOCs by cloud droplets leads etary boundary layer (PBL), the increased destruction of O3
to elevated aqueous-phase HO2(aq) concentrations acceler- over the ocean leads to an overall net Ox loss in the zonal
ating the in-cloud O3(aq) destruction. This has a significant mean. The changes in the chemical production and in the loss
impact on tropospheric O3 levels predicted by EMAC. Ta- of Ox and the increase in scavenging lead to changes in the
ble 5 gives the Ox budget for the three simulations. The net Ox production in ScJAMOC. At the surface, the net Ox
chemical production increases for ScSta compared to Scm. production increases. Here, the efficient uptake of O3 sink
Slightly elevated NOx concentrations lead to an increased precursors overcompensates for the reduction in the chemi-
contribution of methylperoxy radicals and RO2 reactions cal production and leads to a reduced chemical loss. This in-
with NO, compensating for the reduced production from crease mainly occurs over continental regions. In the free tro-
Atmos. Chem. Phys., 21, 9909–9930, 2021 https://doi.org/10.5194/acp-21-9909-2021S. Rosanka et al.: Impact of in-cloud OVOC chemistry on tropospheric oxidants 9921
Table 5. Detailed tropospheric Ox budget for Scm and the changes induced by ScSta and ScJAMOC. The characteristics of each simulation
are provided in Table 1. The gross terms as well as the relative contributions of the major contributors are given. For comparison, the range
of Ox budgets in other models and the multi-model mean values from the Tropospheric Ozone Assessment Report (TOAR) are also shown.
Please note that the models in the multi-model comparison and from TOAR differ in their resolution, tropopause definition, Ox definition,
and chemical mechanism used.
Scm 1ScSta 1ScJAMOC Other modelsa TOARb
Sources [Tg yr−1 ]
Chemical production 5895.6 +7.1 −155.8 4751–5249 4937 ± 656
HO2 + NO 4050.3 −12.8 −101.3 3185–3436 –
CH3 O2 + NO 1084.8 +13.1 −22.9 1092–1288 –
RO2 + NO 731.1 +6.7 −30.8 345–525 –
Other 29.4 +0.1 +0.1 – –
STEc 355.2 +5.6 +15.3 325–391 535 ± 161
Sinks [Tg yr−1 ]
Chemical loss 5254.7 −91.2 −423.2 4193–4841 4442 ± 570
O(1 D) + H2 O 2317.3 −35.0 −167.3 1997–2224 –
HO2 + O3 1550.1 −42.4 −187.6 1061–1356 –
OH + O3 599.0 −1.4 −0.6 518–654 –
HOBr + hv 341.6 −0.8 −54.6 174–285 –
PhO + O3 d 215.4 +1.5 −31.8 – –
Other 231.3 −4.1 −81.5 – –
Dry deposition 846.5 −9.1 −47.3 799–908 996 ± 203
O3 801.6 −9.4 −47.1 – –
Other 44.9 +0.3 −0.2 – –
Scavenging 149.7 +112.9 +329.7 – –
O3 13.2 +104.4 +323.1 – –
N2 O5 25.0 −2.3 −2.7 – –
HNO3 111.5 −0.3 −1.0 – –
Other – +11.2 +10.3 – –
O3 burden [Tg] 348.2 −5.0 −25.0 339–351 337 ± 23
O3 lifetime [d] 20.3 −0.3 −1.0 22–24.2 22.5e
a Based on Sherwen et al. (2016), Hu et al. (2017), and Griffiths et al. (2020). b Values obtained from Young et al. (2018)
and Gaudel et al. (2018). c Stratospheric–tropospheric exchange. d O3 loss due to reaction with phenoxy radicals from
oxidation of aromatics (Taraborrelli et al., 2021). e Calculated based on mean burden and the mean total production.
posphere above the PBL, the net Ox change is reduced, lead- Here, O3 is reduced by more than 12 % for ScJAMOC. Even
ing to increased Ox destruction. This is directly caused by though the total lower tropospheric change is similar in both
the efficient uptake of HO2 , VOCs, and O3 precursors in this hemispheres, the relative reduction is higher in the SH (NH,
cloud-dominated region in ScJAMOC. In the tropical UTLS, about 4 %; SH, about 10 %).
VOCs are an important HO2 source. The efficient removal of Figure 11 shows the seasonal, tropospheric integrated O3
VOCs in the lower troposphere reduces the total VOC mass columns from IASI-FORLI O3 retrievals. In addition, the
transported into this region (see Fig. 3). The chemical pro- differences in Scm with respect to IASI-FORLI and in Sc-
duction of Ox is therefore reduced in the tropical UTLS, due JAMOC with respect to Scm are shown. As explained pre-
to limited availability of HO2 . viously, the comparison is performed here by using the tro-
Figures 9 and 10 give the yearly mean surface mixing ratio pospheric O3 column integrated between the Earth surface
and the zonal mean O3 mixing ratios for Scm and the changes and 300 hPa (see Sect. 2.3). To meaningfully compare the
in ScJAMOC. In general, O3 concentrations are higher in model profile to the IASI observation, the non-uniform sen-
the NH with the highest values found over continental areas. sitivity of the IASI-FORLI retrievals to the O3 vertical dis-
Overall, surface O3 slightly decreases for ScJAMOC with tribution was accounted for by applying the averaging ker-
the maximum mean reduction of about 4 nmol mol−1 . The nels. They provide the model vertical distribution of O3 as
decrease in surface O3 is very low where the net Ox produc- would be seen by IASI. For this purpose, the model pro-
tion increases. The highest reduction in O3 is predicted in the files sampled at the place and time of the IASI overpasses
UTLS, where tropospheric O3 concentrations are the highest. (see Sect. 2.3) were first vertically interpolated to the IASI
https://doi.org/10.5194/acp-21-9909-2021 Atmos. Chem. Phys., 21, 9909–9930, 2021You can also read


