Calibration of temperature-dependent ocean microbial processes in the cGENIE.muffin (v0.9.13) Earth system model - GMD
←
→
Page content transcription
If your browser does not render page correctly, please read the page content below
Geosci. Model Dev., 14, 125–149, 2021
https://doi.org/10.5194/gmd-14-125-2021
© Author(s) 2021. This work is distributed under
the Creative Commons Attribution 4.0 License.

Calibration of temperature-dependent ocean microbial processes in
the cGENIE.muffin (v0.9.13) Earth system model
Katherine A. Crichton1,a , Jamie D. Wilson2 , Andy Ridgwell3 , and Paul N. Pearson1
1 School of Earth and Ocean Sciences, Cardiff University, Cardiff, CF10 3AT, UK
2 BRIDGE,   School of Geographical Sciences, University of Bristol, Bristol, BS8 1QU, UK
3 Department of Earth and Planetary Sciences, University of California, Riverside, CA 92521, USA
a now at: School of Geography, University of Exeter, Exeter, EX4 4RJ, UK

Correspondence: Katherine A. Crichton (k.a.crichton@exeter.ac.uk)

Received: 4 December 2019 – Discussion started: 27 February 2020
Revised: 3 September 2020 – Accepted: 30 September 2020 – Published: 11 January 2021

Abstract. Temperature is a master parameter in the marine       isotopic signature (δ 13 C) of dissolved inorganic carbon in the
carbon cycle, exerting a critical control on the rate of bi-    ocean with modern observations. We additionally explore the
ological transformation of a variety of solid and dissolved     role of temperature in the creation and recycling of dissolved
reactants and substrates. Although in the construction of nu-   organic matter (DOM) and hence its impact on global carbon
merical models of marine carbon cycling, temperature has        cycle dynamics.
been long recognised as a key parameter in the production          We find that for the present day, the temperature-
and export of organic matter at the ocean surface, its role     dependent version shows a fit to the data that is as good as
in the ocean interior is much less frequently accounted for.    or better than the existing tuned non-temperature-dependent
There, bacteria (primarily) transform sinking particulate or-   version of the cGENIE.muffin. The main impact of account-
ganic matter (POM) into its dissolved constituents and con-     ing for temperature-dependent remineralisation of POM is
sume dissolved oxygen (and/or other electron acceptors such     in driving higher rates of remineralisation in warmer waters,
as sulfate). The nutrients and carbon thereby released then     in turn driving a more rapid return of nutrients to the sur-
become available for transport back to the surface, influenc-   face and thereby stimulating organic matter production. As
ing biological productivity and atmospheric pCO2 , respec-      a result, more POM is exported below 80 m but on average
tively. Given the substantial changes in ocean temperature      reaches shallower depths in middle- and low-latitude warmer
occurring in the past, as well as in light of current anthro-   waters compared to the standard model. Conversely, at higher
pogenic warming, appropriately accounting for the role of       latitudes, colder water temperature reduces the rate of nutri-
temperature in marine carbon cycling may be critical to cor-    ent resupply to the surface and POM reaches greater depth on
rectly projecting changes in ocean deoxygenation and the        average as a result of slower subsurface rates of remineralisa-
strength of feedbacks on atmospheric pCO2 .                     tion. Further adding temperature-dependent DOM processes
   Here we extend and calibrate a temperature-dependent         changes this overall picture only a little, with a slight weak-
representation of marine carbon cycling in the cGE-             ening of export production at higher latitudes.
NIE.muffin Earth system model, intended for both past              As an illustrative application of the new model configura-
and future climate applications. In this, we combine a          tion and calibration, we take the example of historical warm-
temperature-dependent remineralisation scheme for sinking       ing and briefly assess the implications for global carbon cy-
organic matter with a biological export production scheme       cling of accounting for a more complete set of temperature-
that also includes a dependence on ambient seawater tem-        dependent processes in the ocean. We find that between the
perature. Via a parameter ensemble, we jointly calibrate        pre-industrial era (ca. 1700) and the present (year 2010), in
the two parameterisations by statistically contrasting model-   response to a simulated air temperature increase of 0.9 ◦ C
projected fields of nutrients, oxygen, and the stable carbon    and an associated projected mean ocean warming of 0.12 ◦ C

Published by Copernicus Publications on behalf of the European Geosciences Union.
126                   K. A. Crichton et al.: Calibration of temperature-dependent ocean microbial processes in cGENIE

(0.6 ◦ C in surface waters and 0.02 ◦ C in deep waters), a re-
duction in particulate organic carbon (POC) export at 80 m
of just 0.3 % occurs (or 0.7 % including a temperature-
dependent DOM response). However, due to this increased
recycling nearer the surface, the efficiency of the transfer of
carbon away from the surface (at 80 m) to the deep ocean
(at 1040 m) is reduced by 5 %. In contrast, with no assumed
temperature-dependent processes impacting production or
remineralisation of either POM or DOM, global POC export
at 80 m falls by 2.9 % between the pre-industrial era and the
present day as a consequence of ocean stratification and re-
duced nutrient resupply to the surface. Our analysis suggests
that increased temperature-dependent nutrient recycling in
the upper ocean has offset much of the stratification-induced
restriction in its physical transport.

1   Introduction

The cycle of carbon through the ocean is dominated by the
                                                                  Figure 1. Simplified schematic of the ocean biological pump and
production, destruction, and transformation of both dissolved     dissolved nutrient movements, as well as the two temperature-
and particulate organic matter (DOM and POM, respectively)        dependent processes that are considered in this study. (1) Nutrient
(Legendre et al., 2015; Heinze et al., 2015). The “biologi-       uptake rate and (2) remineralisation rate. In the style of the U.S.
cal carbon pump” (Fig. 1) is central in this – acting through     DOE (2008). We do not model sediments in this study, but they ap-
phytoplankton growth to remove carbon (and nutrients) from        pear in the figure for completeness.
the surface and mixed layer waters and subsequently trans-
ferring it to the deep, principally via the sinking of POM
(see Hülse et al., 2017, for a review) and to a lesser extent     face and, importantly, the rate at which the organic matter is
via the subduction of DOM. Export of POM out of the near-         remineralised in the ocean interior.
surface euphotic zone is principally controlled by photosyn-         To a first order, export of carbon out of the mixed layer
thesis rates (primary production) together with zooplankton       in a warming world will be reduced as a consequence of in-
grazing, respiration, and other food web processes (Steinberg     creased ocean stratification reducing nutrient resupply to sur-
and Landry, 2017; Mari et al., 2017). Of this export, only        face waters (Pörtner et al., 2014; Reusch and Boyd, 2013).
a fraction ultimately reaches the deep ocean as the initial       However, the export of carbon is only one of the perti-
export flux is filtered through a series of further processes     nent factors in marine carbon cycling. Also important is the
and transformations involving feeding and remineralisation        “transfer efficiency” of the biological pump – the fraction
by microbes and other biota; it is further modulated by the       of exported carbon that reaches the inner ocean or, alterna-
sinking speeds and composition of the sinking matter itself       tively, the mean depth below the surface at which this car-
(Bach et al., 2016; Rosengard et al., 2015; Turner, 2015).        bon is remineralised and dissolved inorganic carbon (DIC)
At the ocean floor, organic matter undergoes further micro-       returned to the ocean. A deeper mean remineralisation depth
bial degradation and transformation before the residual is        equates to a more transfer-efficient biological carbon pump.
buried in accumulating marine sediments. Removing carbon          The subsurface processes that affect the biological carbon
from surface waters and storing it for centuries (intermedi-      pump efficiency are also temperature-dependent (Bendtsen
ate depths), millennia (deep ocean), or multi-millennia (sed-     et al., 2015; Turner, 2015; Boscolo-Galazzo et al., 2018),
iments) exerts an important control on atmospheric pCO2 ,         complicating the net response of the biological carbon pump
which would otherwise be some 150 to 200 ppm higher than          and carbon sequestration in the ocean interior to changes in
present in the absence of any biological activity in the ocean    global warming.
(Parekh et al., 2005; Sarmiento and Gruber, 2006). Ocean             Not all ocean biogeochemical models and associated
circulation generally acts against the biological pump, geo-      global carbon cycle studies account for temperature controls
chemically homogenising the ocean interior and returning          on (and hence the efficiency of) the biological carbon pump
carbon (and nutrients) back to the surface. Surface-to-deep       (some that do include the following: Kvale et al., 2019; Ya-
geochemical gradients and storage of carbon in the ocean are      mamoto et al., 2018; Cao and Zhang, 2017; Laufkötter et
hence a function of the rate of ocean ventilation in conjunc-     al., 2016; Kvale et al., 2015; Segschneider and Bendtsen,
tion with the rate of biological export of carbon from the sur-   2013; Chikamoto et al., 2012; Moore et al., 2002). Hülse

Geosci. Model Dev., 14, 125–149, 2021                                                https://doi.org/10.5194/gmd-14-125-2021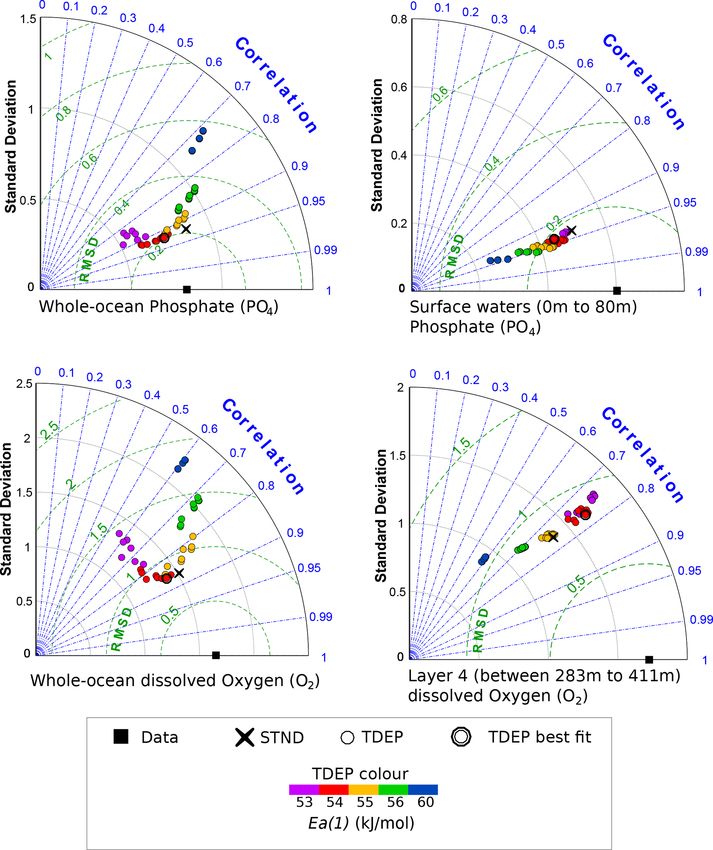
K. A. Crichton et al.: Calibration of temperature-dependent ocean microbial processes in cGENIE                                127

et al. (2017) presented an extensive review of how EMICs           thermodynamic sea ice model (Marsh et al., 2011). As per
(Earth system models of intermediate complexity) and box           previous calibrations of ocean biogeochemical cycles (e.g.
models treat ocean carbon cycle processes and summarised           Ridgwell et al., 2007), we employ the ocean circulation and
how inner ocean processes are less well constrained than sur-      sea ice model on a 36 x 36 equal area grid (10◦ longitude
face processes in many models and how their treatment in           and uniform in the sine of latitude) and couple these with
models is much more variable. This is also the case for more       a 2D energy–moisture balance atmosphere model (EMBM)
complex ocean models, such as those participating in CMIP5         (Marsh et al., 2011) (an alternative to this – a 3D atmo-
(Coupled Model Intercomparison Project 5) and used to in-          spheric general circulation model as in Holden et al., 2016
form the recent IPCC assessment (Bopp et al., 2013; Burd           – also exists but is not employed in this study). For trace-
et al., 2016). However, the temperature dependency of inner        ability, we employ a commonly used physical configura-
ocean processes has been found to have an important impact         tion with 16 vertical levels in the ocean and a present-
on nutrient distribution and therefore on primary production       day bathymetry following Cao et al. (2009) and retain all
(Taucher and Oschlies, 2011) as well as biological pump ef-        physics parameter values and boundary conditions control-
ficiency (Laufkötter et al., 2017), arguing for the necessity of   ling the climate system. The representation of the ocean car-
their inclusion in models.                                         bon and other biogeochemical cycles together with ocean–
   All things being equal, higher ocean temperatures should        atmosphere gas exchange, unless otherwise noted, also fol-
drive a greater fraction of remineralisation to occur in the       low Cao et al. (2009) and are summarised in more de-
upper water column, facilitating increased carbon and nu-          tail below. The various temperature-dependent parameterisa-
trient return to the ocean surface. Higher surface tempera-        tions that we substitute for the equivalent non-temperature-
ture will also increase the ability of phytoplankton to take       dependent processes in Cao et al. (2009) are described in full
up and assimilate the resulting increased nutrient availability    in this paper.
and hence re-export POM, although grazing pressure would              It is likely that both increased grazing pressure by zoo-
also increase. However, higher temperatures also lower the         plankton and primary production by phytoplankton will have
solubility of CO2 at the surface and hence loss to the atmo-       an impact on export production in a warmer world (Paul
sphere. Furthermore, for a geologically rapid and transient        et al., 2015; Turner, 2015). However, in the simplified bio-
warming at the surface such as is currently occurring, in-         logically induced export flux (Maier-Reimer, 1993) scheme
creased ocean stratification and reduced physical transport of     (Fig. 2) that we apply in cGENIE, we cannot explicitly con-
carbon and nutrients back to the surface will occur. The mul-      sider the impact of increased grazing pressure in the sur-
tiple conflicting influences of temperature mean that even the     face waters. Regardless, we are interested in the wider ques-
net sign of the feedback between greenhouse warming and            tion of the interaction of (any) temperature-dependent com-
ocean carbon cycling is uncertain (Yamamoto et al., 2018).         munity production (as export production) with temperature-
How carbon fixed at the surface is recycled via partitioning       dependent microbial remineralisation in the ocean interior
into DOM rather than exported as POM, and the rate at which        and its impact on the global ocean carbon cycle. We hence
DOM itself is recycled back into dissolved carbon and nutri-       represent only the direct effect of temperature on large-scale
ents as temperatures rise, adds another complicating layer of      metabolic processes (plankton photosynthesis (growth) and
temperature response and feedback.                                 microbial respiration). Other factors such as particle size dis-
   To help tease apart the varying influences of tempera-          tributions, particle density (Cram et al., 2018), “ballasting”
ture on marine carbon cycling and atmospheric CO2 , we             (e.g. Wilson et al., 2012), and sinking speed (determined by
present and calibrate a temperature-dependent representation       particle characteristics) (McDonnell et al., 2015) are gen-
of the biological pump in the current “muffin” release of          erally determined within the food web and may be consid-
the cGENIE EMIC (Cao et al., 2009) (see the statement in           ered to be of secondary importance in the context of the
the “Code availability” section). Our calibrated configuration     gross role of temperature in global carbon cycling. Recently,
is intended for use in global biogeochemical cycling studies       Boyd et al. (2019) defined additional particle pumps in the
that require a fuller consideration of the role of temperature     ocean involving eddy subduction, diel vertical migration,
in both the geological past and the future. For completeness,      mesopelagic migration, and seasonal lipid pumps. These pro-
we additionally develop and test a pair of parameterisations       cesses are also outside the scope of this study, particularly
for temperature dependency in the production and decay of          in the absence of a sufficiently high-resolution ocean cir-
DOM.                                                               culation model component, the absence of (fully coupled
                                                                   GCM) ocean–atmosphere dynamics and inter-annual vari-
                                                                   ability, and without an explicit ecosystem including multiple
2   The cGENIE.muffin Earth system model framework                 trophic layers and explicit zooplankton behaviours.

The basic framework of the cGENIE EMIC consists of a
3D frictional–geostrophic approximation ocean circulation
model (Edwards and Marsh, 2005) coupled to a 2D dynamic–

https://doi.org/10.5194/gmd-14-125-2021                                                 Geosci. Model Dev., 14, 125–149, 2021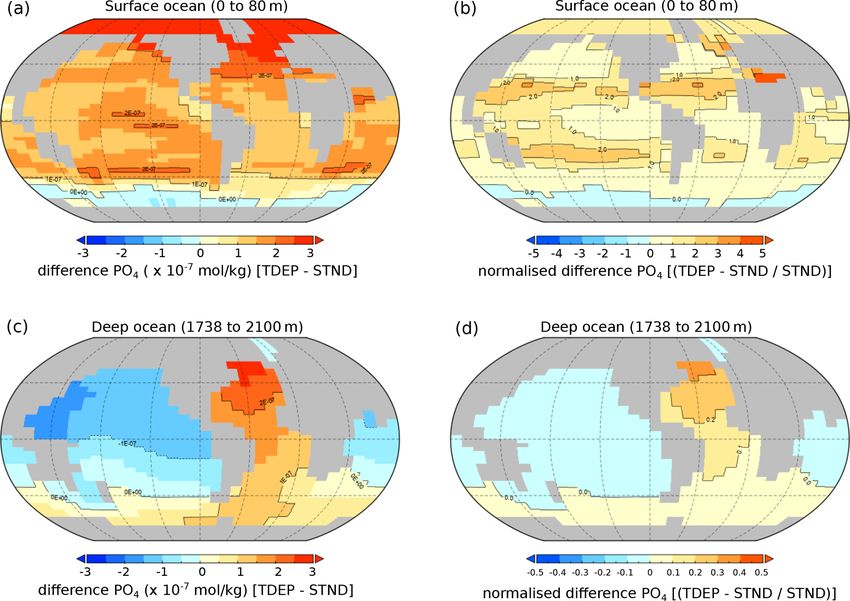
128                     K. A. Crichton et al.: Calibration of temperature-dependent ocean microbial processes in cGENIE

                                                                        nutrient concentration (mol kg−1 ), K PO4 is the Michaelis–
                                                                        Menten half-saturation value (mol kg−1 ), 1 − Aice is the ice-
                                                                        free fraction of the sea surface (with Aice being the ice-
                                                                        covered fraction of a grid cell), and II0 is the light limitation
                                                                        (based on incidence angle) term.
                                                                           Here, a maximum uptake rate, (maximum rate of conver-
                                                                        sion of dissolved PO4 , phosphate, into organic matter by
                                                                        phytoplankton) is prescribed and assigned a calibrated value
                                                                        of 9.0 × 10⁻⁶ mol kg−1 yr−1 (Cao et al., 2009), while the
                                                                        calibrated Michaelis–Menten half-saturation value is 9.0 ×
                                                                        10−7 mol kg−1 (Cao et al., 2009).
                                                                           Nutrient uptake is instantaneously converted into organic
                                                                        matter export, both particulate organic matter (POM) and a
                                                                        fraction as dissolved organic matter (DOM), in a ratio of 1 : 2
                                                                        following Najjar et al. (2007), and this represents commu-
                                                                        nity production (see Fig. 2). This production encompasses
                                                                        the entire surface food web, including the action of primary
                                                                        producers (phytoplankton) and the effect of consumers (e.g.
                                                                        grazers). In this export production model, dissolved inor-
                                                                        ganic carbon (DIC) is taken out of solution in the surface
                                                                        layer at a molar ratio of 106 : 1 to PO4 and O2 at a ratio of
                                                                        −138 : 1 with PO4 (Redfield et al., 1963). POM is partitioned
                                                                        into two fractions, which conceptually are labile (fraction 1,
                                                                        POM1) and recalcitrant POM (fraction 2, POM2) (Ridgwell
Figure 2. Schematic of biological pump processes showing where          et al., 2007). POM sinks vertically out of the surface layer
cGENIE export production operates. In the export production             and settles with a given velocity (here 125 m d−1 ). POM
model, no mechanistic consideration of the effects of temperature       is remineralised throughout the water column using a pre-
within the mixed layer (i.e. GPP vs. NPP vs. community produc-          scribed remineralisation “curve” reflecting the decay of POM
tion) can be considered, but heterotrophic respiration (as reminer-     as it sinks, first using dissolved oxygen and then sulfate. The
alisation) vs. community production (as export production) can be       prescribed remineralisation curve of relative sinking flux vs.
considered, as can nutrient recycling. In this study we apply temper-
                                                                        depth (see e.g. Hülse et al., 2017) is always adhered to (Eq. 2a
ature dependency to organic matter production and remineralisation
that drives the biological carbon pump. We do not model burial in
                                                                        for POM1, Eq. 2b for POM2). In the sinking curve, the rela-
this version of cGENIE (but it is here for completeness). In this       tive flux at each layer (z) is calculated according to an expo-
cGENIE configuration, the nutrient is phosphate. The dashed line        nential decay function (Ridgwell et al., 2007).
indicates the cycling (and resupply due to circulation) of nutrients.

                                                                                                                         zhe − z
Solid lines indicate the cycling of carbon.                             FzPOM1 = Fz=h POM1
                                                                                               1  − r POM
                                                                                                            + r POM
                                                                                                                    exp              (2a)
                                                                                         e
                                                                                                                          l POM1

                                                                                                                       zhe − z
                                                                        FzPOM2 = Fz=h  POM2
                                                                                           e
                                                                                                 r POM
                                                                                                         + r POM exp POM2            (2b)
2.1    Standard, non-temperature-dependent model                                                                        l
       formulation (STND)                                                    POM is POM exported out of the surface layer (at 80 m),
                                                                           Fz=h e
                                                                        l POM is the length scale (556 m for POM1; 1 × 10⁶ m for
In the original version of the biological uptake scheme (Ridg-
                                                                        POM2 – effectively infinite and hence no water column de-
well et al., 2007), nutrients are taken out of the surface ocean
                                                                        cay), and r POM is the initial proportion of POM into frac-
layer according to several factors including light incidence,
                                                                        tion 2 (0.055).
ice fraction, nutrient uptake limitation (Michaelis–Menten
                                                                           Any POM not remineralised within the water column is in-
type), and a prescribed maximum uptake rate (Eq. 1). In this,
                                                                        stead remineralised at the ocean floor – a “reflective” bound-
0, the net nutrient uptake (mol PO4 kg−1 yr−1 ) and hence net
                                                                        ary condition assumption (see Hülse et al., 2017, for a dis-
primary production in the surface ocean layer of the model,
                                                                        cussion). DOM is degraded with a lifetime of 0.5 years fol-
is described as
                                                                        lowing Najjar et al. (2007).
               PO4                   I
0 = uPO
     0
        4
                        · (1 − Aice ) ,                          (1)    2.2   Temperature-dependent processes (TDEP)
            PO4 + K PO4              I0
                                                                        In an alternative representation of biological export produc-
where uPO
        0
          4
            is the maximum uptake rate (mol kg−1 yr−1 ),                tion in the model, a temperature-dependent growth rate lim-
   PO4
PO +K PO4
          is the nutrient limitation term, PO4 is the local             iter is applied to a characteristic timescale of ambient nutrient
   4

Geosci. Model Dev., 14, 125–149, 2021                                                     https://doi.org/10.5194/gmd-14-125-2021
K. A. Crichton et al.: Calibration of temperature-dependent ocean microbial processes in cGENIE                                     129

depletion (Eq. 3). A similar scheme (but without the addition           and 1t (z) is the time that sinking particles spend on average
of temperature-dependent remineralisation in the ocean) has             in layer z.
been previously applied by Meyer et al. (2016) for PO4 -only               We will describe and evaluate the impact of processes ac-
uptake and for two nutrients (PO4 and NO3 ) by Monteiro et              counting for the influence of temperature on both the pro-
al. (2012). In this, net nutrient uptake (mol PO4 kg−1 yr−1 )           duction (ratioed to POM) and degradation of DOM in Sect
is                                                                      5.2.
                PO4                   I
0 = Vmax ·               · (1 − Aice ) · γ T · PO4 ,             (3)
             PO4 + K PO4              I0
                                                                        3   Model tuning methodology
where γ T is the temperature growth limitation term (see
below), Vmax is the maximum net depletion rate multi-                   In previous published applications of the cGENIE model, ei-
plier (yr−1 ), PO4 is local PO4 concentration (mol kg−1 ),              ther a temperature dependence in calculating export (but not
    PO4
PO +K PO4
            is the nutrient limitation term, K PO4 is the               ocean interior mineralisation) (e.g. Meyer et al., 2016; Mon-
   4
Michaelis–Menten half-saturation value (mol kg−1 ), 1 − Aice            teiro et al., 2012) or a temperature dependence in reminer-
is the ice-free fraction of the cell, and II0 is the light limitation   alisation (but not biological productivity) (John et al., 2014)
(based on incidence angle) term.                                        has been utilised to address varying paleo-questions. More
   Temperature growth limitation is represented by the Ar-              commonly, neither has been utilised (e.g. Ridgwell and
rhenius equation, where T is local temperature (Eq. 4).                 Schmidt, 2010). Here, we explore both temperature depen-
                                                                        dencies together (Table 2). Although in John et al. (2014)
γ T = ae(T /b )                                                  (4)    the temperature-dependent remineralisation scheme was cal-
                                                                        ibrated to approximate the global mean POM decay profile
This is the Eppley curve, commonly applied to model
                                                                        in the default model (i.e. Ridgwell et al., 2007) under pre-
metabolic response to temperature change (Table 1). An im-
                                                                        industrial boundary conditions, here we adopt a more formal
proved fitted curve was proposed by Bissinger et al. (2008)
                                                                        re-tuning against observations of the primary scaling factors
(the LPD or Liverpool Plankton Database curve), with both
                                                                        in each scheme.
being based on fitting the model to data from empirical stud-
                                                                           We identify three primary parameters requiring joint re-
ies. The largest difference between the Bissinger curve and
                                                                        tuning: (1) the maximum nutrient uptake rate Vmax (Eq. 3)
the Eppley curve is the value of a (Eq. 4, Table 1). It makes
                                                                        that scales export production; (2) the activation energy, Ea (1)
little difference which curve we use because we calibrate
                                                                        (Eq. 5) (the minimum energy required for the transformation
Vmax (Eq. 3), which is also a multiplier for the temperature
                                                                        of organic carbon into inorganic carbon through respiration
growth limitation term (in Eq. 4). We use the original Epp-
                                                                        processes for the remineralisation of labile POC1, particulate
ley et al. (1972) values for a (0.59) and b (75.80), and as per
                                                                        organic carbon type 1), for which the labile POC1 dominates
Monteiro et al. (2012). Both the Eppley and Bissinger curves
                                                                        the export from the surface; and (3) the fraction of recalci-
gives a Q10 value (where Q10 is the increase in the rate of
                                                                        trant POC2 (denoted as r POM in Eq. 2a and 2b) formed at the
the metabolic process with a 10 ◦ C increase in temperature)
                                                                        surface that reaches the very deep ocean.
for nutrient uptake of 1.88 (Bissinger et al., 2008).
                                                                           The Vmax range was chosen by running a series of test sim-
    To calculate the remineralisation rate of POM (mol yr−1 ),
                                                                        ulations (a 10 kyr spin-up with pre-industrial boundary con-
an Arrhenius-type equation is applied (as in John et al., 2014)
                                                                        ditions followed by the historical transient simulation forced
(Eq. 5):
                                                                        with CO2 data to the present day) varying Vmax while re-
k(T ) = βPOMn e(−Ea /RT ) ,                                      (5)    taining the temperature-dependent remineralisation scheme
                                                                        adopted in John et al. (2014). From these results we selected
where Ea is activation energy (J mol−1 ), R is the gas constant         a range of values for the multiplier Vmax that gave reason-
(J K−1 mol−1 ), T is absolute temperature (K), and βPOMn is             able agreement with PO4 and O2 distributions; these Vmax
the rate constant for POM remineralisation (yr−1 ) as T ap-             values are 4, 7, and 10. For the initial fraction of POC2,
proaches infinity (for each POM fraction).                              we took the John et al. (2014) value (with a POC2 frac-
   This rate is calculated in each ocean layer (and model grid          tion of 0.008) and applied a range that encompassed 25 %
point) according to the local temperature for each of the two           to 400 % around that value. For the Ea (1) (Eq. 5) setting,
POM fractions. For both fractions, the sinking rate is as-              John et al. (2014) used a value of 55 kJ mol−1 , the median
sumed to be 125 m d−1 (Ridgwell, 2001), so for cGENIE’s                 of a range of 50 to 60 kJ mol−1 for labile POC identified in
non-uniform ocean depths, the fractional loss of POM due to             Arndt et al. (2013). We test a series of values for Ea (1) within
remineralisation in each layer (z) is as in Eq. (6):                    the range (Table 3). Our ensemble hence consisted of three
1FzPOMn = k(T )POMn · 1t (z) ,                                   (6)    different choices for Vmax , three different choices for initial
               z
                                                                        fraction of POC2, and five different choices for Ea (1), for a
where n denotes POM fraction (either labile (1) or recalci-             total of 3 × 3 × 5 = 45 different parameter combinations and
trant (2) – distinguished as these have different k(T ) values),        hence model ensemble member experiments. Values for the

https://doi.org/10.5194/gmd-14-125-2021                                                      Geosci. Model Dev., 14, 125–149, 2021
130                     K. A. Crichton et al.: Calibration of temperature-dependent ocean microbial processes in cGENIE

Table 1. Values for variables in Eq. (4).

                                                     Rate constant as     Multiplier    Reference
                                                      T approaches        constant
                                                       infinity (a)      for T (1/b)
                                    Eppley curve          0.59             0.0633       Eppley et al. (1972)
                                    LPD curve             0.81             0.0631       Bissinger et al. (2008)

Table 2. Model settings and processes included in each set-up. Column numbering corresponds to numbering in Fig. 1.

    Name              Circulation     Biochemistry     1. Temperature-     2. Temperature-       Temperature-      Description
                                                          dependent           dependent           dependent
                                                            uptake            reminera-           DOM (both
                                                                               lisation         production and
                                                                                               remineralisation)
    STND                   X                X                                                                      Standard model
    TDEP                   X                X                 X                     X                              Temperature-dependent
                                                                                                                   POM model
    TDEP+TDOM              X                X                 X                     X                  X           Temperature-dependent
                                                                                                                   POM and DOM model

Table 3. Settings for parameters in TDEP (temperature-dependent).           δ 13 C) known as the Suess effect (Keeling, 1979; Rubino et
Values in bold are those applied in John et al. (2014)                      al., 2013). This affects ocean δ 13 C in a non-uniform manner,
                                                                            impacting (in general) nearer-surface waters more strongly
    Parameter                                Values applied                 due to ocean physics and circulation patterns. We hence addi-
    Vmax                                     4, 7, 10                       tionally force atmospheric composition in the transient sim-
    POC fraction 2 (recalcitrant)            0.002, 0.008, 0.032            ulations with declining δ 13 CO2 (Francey et al., 1999).
    Ea(1) (labile fraction) ×103 J mol−1     53, 54, 55, 56, 60
                                                                            Model–data comparison method

                                                                            For the model–data comparison, World Ocean Atlas 2009
two rate constants, βPOMn (Eq. 5, for POC1 at 9 × 10¹¹ yr−1 ,               (WOA 2009; Levitus et al., 2010) 5◦ gridded climatological
for POC2 at 1 × 10¹⁴ yr−1 ), that were calibrated for the mod-              data for phosphate (PO4 ) and dissolved oxygen (O2 ) were
ern ocean and the sinking speed of 125 m d−1 in John et                     interpolated to a 10◦ × 10◦ grid (with a simple linear upscal-
al. (2014) are retained.                                                    ing) and then to the cGENIE model depth scale by averaging
   Each of the 45 experiments in the ensemble is spun up                    over the data depth points that most closely correspond to
for 10 000 years under pre-industrial boundary conditions:                  the cGENIE ocean model depth layer distribution. This depth
atmospheric pCO2 is restored to 280 ppm with a δ 13 CO2                     rescaling produced a global mean depth uncertainty of 2.2 %
isotopic value of −6.5 ‰. To contrast the model ensem-                      (of the targeted cGENIE depth). The depth rescaling resulted
ble members with observations, a model–data comparison                      in minor additional uncertainties of ±0.01 µmols L−1 (at 1
based on a simulated pre-industrial steady state creates a mis-             standard deviation) for PO4 and ±0.02 µmols L−1 for dis-
match because global datasets are based on modern (i.e. the                 solved O2 in addition to the error inherent in the gridded
past few decades) oceanographic observations, wherein (es-                  climatology product. For a direct comparison with the data,
pecially shallow) distributions of nutrients and oxygen have                cGENIE model output from the year 2010 of the transient ex-
already been impacted by historical warming. Therefore, fol-                periments was also interpolated to 10◦ × 10◦ and converted
lowing on from each respective spin-up, each model ensem-                   to units of µmols L−1 (from mol kg−1 using modelled wa-
ble member is then forced from the year 1700 to 2010 in                     ter density) to match the units of the WOA data. Latitudes
a transient simulation with atmospheric composition con-                    higher than 80◦ were neglected due to higher uncertainties in
forming to the observed mean annual trend in CO2 . Direct                   both data and model outputs. For PO4 , we statistically com-
atmospheric measurements and ice core data have shown                       pared the surface concentration, which is important for con-
that atmospheric δ 13 CO2 has dropped with increasing CO2                   straining nutrient uptake rates, and the global ocean distribu-
due to fossil fuel emissions (that have a characteristic low                tion, which strongly reflects remineralisation and hence the

Geosci. Model Dev., 14, 125–149, 2021                                                           https://doi.org/10.5194/gmd-14-125-2021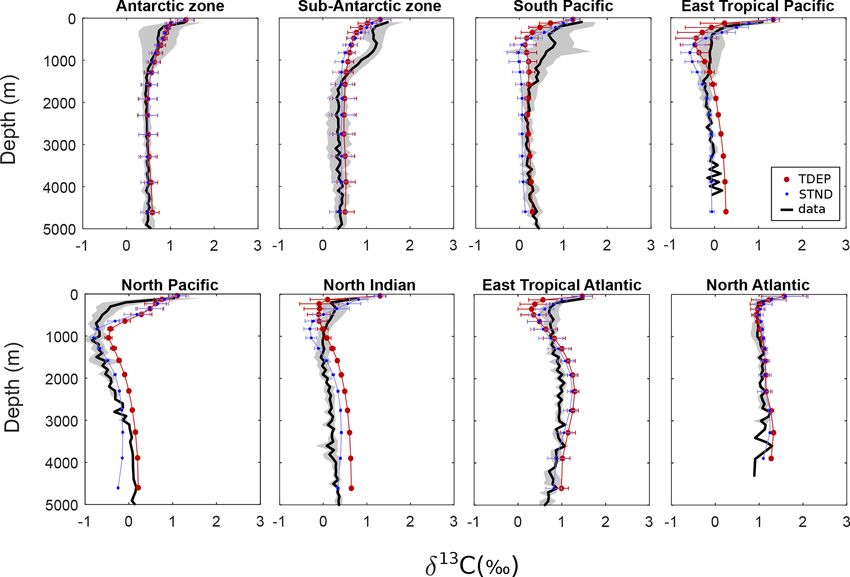
K. A. Crichton et al.: Calibration of temperature-dependent ocean microbial processes in cGENIE                                131

                                                                    4     Model–data and model–model comparison

                                                                    4.1    Tuning the temperature-dependent version – model
                                                                           vs. data

                                                                    We first assess model skill in simulating the temperature dis-
                                                                    tribution in the ocean, given its critical importance in the
                                                                    temperature-dependent calculations of metabolic processes
                                                                    (Fig. 4). We find a generally reasonable model fit to ocean
Figure 3. Selected ocean regions for model–data comparison (on a    temperature data in middle- and low-latitude near-surface
10 × 10◦ grid, with land masses overlaid for indication) based on   waters and in capturing the first-order patterns in benthic
Weber et al. (2016) and WOA 2009 data (Levitus et al., 2010).
                                                                    temperatures. At high latitudes, cGENIE shows larger dif-
                                                                    ferences compared with observations due to deficiencies in
strength and efficiency of the biological pump (plus ocean          modelled ocean circulation and/or the surface climate as sim-
circulation). For dissolved O2 , we statistically compared the      ulated in the simple 2D EMBM. For instance, the tempera-
model and data between 283 and 411 m (cGENIE ocean                  ture discrepancy throughout the water column in the North
level 4 centred at 346 m) as an indication of the dissolved         Atlantic may be due to an overly strong AMOC (Atlantic
oxygen depletion caused by remineralisation near the bot-           Meridional Overturning Circulation) in the model that deliv-
tom of the mixed layer and how well the model can repre-            ers too high a volume of warmer surface waters to depth. For
sent this. As with phosphate, we additionally compared the          the North Pacific, the model overestimation of near-surface
model global ocean dissolved oxygen distribution with data.         temperatures by cGENIE likely reflects insufficient surface
Finally, given that we are utilising model-derived tempera-         stratification: downward mixing that is too deep transporting
ture distributions in the ocean to project nutrient and oxygen      surface waters that are too warm to mid-depths in this loca-
concentrations (plus δ 13 C distributions) which we then con-       tion.
trast with the respective observed data, we interpolated tem-          The ensemble simulation results (year 2010 of the tran-
perature data (producing an uncertainty of ±0.1 ◦ C) in the         sient experiments) for the ocean geochemistry are shown in
same way as O2 and PO4 so as to elucidate biogeochemical            Fig. 5 on Taylor diagrams for their fit to observed distribu-
biases arising from model–data temperature mismatch.                tions of dissolved PO4 and O2 in the ocean. Points in Fig. 5
   To evaluate the model skill, we compared the model to data       are shaded according to the Ea (1) (Eq. 5) value, which has
standard deviation (SD), calculated the centred root mean           the strongest control on PO4 and O2 distribution of the three
square (CRMSD) difference between the model and data,               variables. The overall best fit to the data for the final TDEP
and calculated model–data correlation; these parameters can         setting was selected as Vmax = 10, Ea (1) = 54 kJ mol−1 , ini-
then be presented on a Taylor plot. On this plot the general        tial fraction POC2 = 0.008; the best fit is determined as the
proximity of the model point to the data point indicates the        setting with the combined overall lowest CRMSD for the
goodness of fit and provides a visual comparison of how the         PO4 and O2 distributions. The CRMSD for each variable is
changing parameters affect the model skill.                         shown in Fig. 5 as the radial distance from the data point (the
   For assessing water column profiles, we defined a set of         radial axis coloured green). In general the parameter value
ocean regions as shown in Fig. 3. These regions are simi-           combinations with the lowest CRMSD values correspond to
lar to those used by Weber et al. (2016), but with some re-         the highest correlations in the model fit to data (Fig. 5). The
gions reduced in size or separated (subtropical Pacific lim-        statistics for the STND and best-fit TDEP are listed in Ta-
ited to South Pacific and north Indian Ocean added). This           ble 4.
was done so that within each region, ocean water charac-
teristics (including temperature, nutrients, oxygen, salinity)      4.2    Performance of the temperature-dependent model
and particle fluxes (as Weber et al., 2016) are broadly simi-              compared to the standard model
lar. We compare the model distribution of δ 13 C of DIC with
data from Schmittner et al. (2013) by grouping these data           In this section we evaluate and compare the performance of
into regions (Fig. 3) and creating representative (mean with        the existing tuned, but non-temperature-dependent, biologi-
standard deviation) down-column profiles for δ 13 C for visual      cal scheme (STND) to the new tuned temperature-dependent
comparison with model outputs in the matching region. In all        scheme (TDEP).
cases, model output units are converted to match those of the          Figure 6 shows cross-plots for surface PO4 concentration
data for model–data comparison, which do not always match           (an important constraint on export production) for the best-fit
those units used in Sect.2.                                         TDEP and the standard model for the selected ocean regions.
                                                                    The addition of temperature dependence in TDEP generally
                                                                    increases surface PO4 concentrations and comes into better
                                                                    agreement with data than the standard model (STND). The

https://doi.org/10.5194/gmd-14-125-2021                                                 Geosci. Model Dev., 14, 125–149, 2021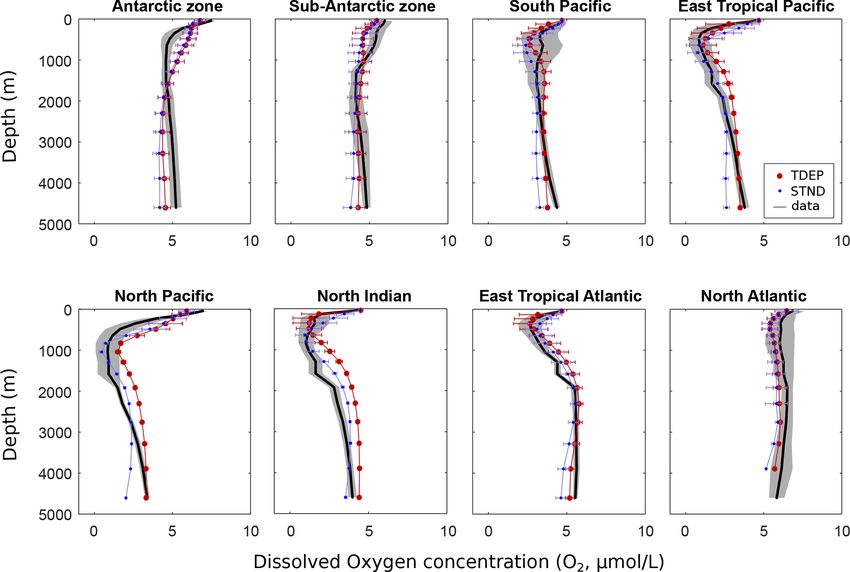
132                   K. A. Crichton et al.: Calibration of temperature-dependent ocean microbial processes in cGENIE

Figure 4. Temperature (◦ C) per depth by region for the model and data (mean and standard deviation). Data from WOA 2009 (Levitus et
al., 2010).

Table 4. Statistics for the fit of the model to phosphate and oxygen distribution in the present day for the STND, TDEP (best fit), and
TDEP+TDOM simulations. Statistics are shown as standard deviation (SD) in µmol L−1 , centred root mean square difference (CRMSD) in
µmol L−1 , and correlation to data. TDEP+TDOM is described in Sect. 5.2.

                                 Standard deviation                           CRMSD                            correlation
                      Data     STND     TDEP     TDEP+TDOM         STND     TDEP     TDEP+TDOM       STND     TDEP     TDEP+TDOM
 Whole-ocean PO4     0.8072   0.8072    0.7386        0.7606       0.2208   0.2043      0.2113      0.9236    0.9227         0.9177
 Surface PO4         0.6026   0.5009    0.4452        0.3921       0.1699   0.1820      0.2130      0.9350    0.9294         0.9274
 Whole-ocean O2      1.6461   1.5154    1.3900        1.4522       0.5476   0.5501      0.5356      0.8670    0.8615         0.8703
 O2 283 to 411 m     1.7285   1.3724    1.6531        1.6142       0.8145   0.8443      0.8200      0.7551    0.7660         0.7746

high-surface-nutrient regions, the Antarctic and the North             seen between TDEP and STND in surface middle- and low-
Pacific, are lower than data in all model cases, and this is           latitude waters, e.g. in the north Indian Ocean and eastern
likely due to the lack of iron limitation in this version of the       tropical Pacific, where nutrients are higher in TDEP in better
model, as biological activity removes too much nutrient con-           agreement with data. In higher-latitude waters, model–data
tent from the surface waters. However, in these regions, the           mismatch may be more closely related to ocean circulation
temperature-dependent version shows a slightly better fit to           (as for temperature; Fig. 4), with STND and TDEP distribu-
data than does the standard model, as the colder surface water         tions very similar to each other in the Southern Ocean and
reduces nutrient uptake rates. In contrast, the lowest-nutrient        North Pacific, but with TDEP a better fit to data in the North
regions (e.g. some South Pacific and some eastern tropical             Atlantic.
Atlantic) have slightly higher PO4 concentrations compared                With the exception of the high southern latitudes (higher
to data in TDEP.                                                       than ∼ 60◦ S), the addition of temperature-dependent mi-
   Regional water column profile model outputs for TDEP                crobial processes generally increases surface nutrient con-
and STND are plotted against PO4 data (Levitus et al., 2010)           centrations (as shown in Fig. 8a and b) compared to the
in Fig. 7. In both schemes, the model was tuned according              standard model. This is particularly apparent in the low-
to its fit to PO4 (and O2 ), and both TDEP and STND show               nutrient gyres, with up to 4 times higher PO4 concentrations
a visually reasonable fit to data. Some differences can be             in TDEP compared to STND (Fig. 8b). In the deeper ocean

Geosci. Model Dev., 14, 125–149, 2021                                                   https://doi.org/10.5194/gmd-14-125-2021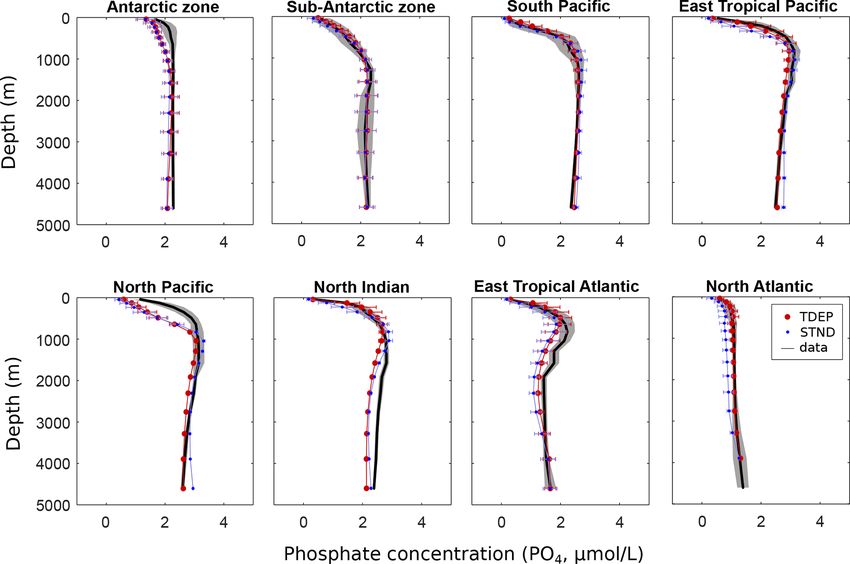
K. A. Crichton et al.: Calibration of temperature-dependent ocean microbial processes in cGENIE                                        133

Figure 5. Taylor diagrams for the model fit to data for PO4 and O2 concentrations, showing the standard deviation (standard deviation is not
normalised), correlation, and centred root means square difference (RMSD). Data from WOA 2009 (Levitus et al., 2010). The best-fit TDEP
setting is double circled.

Figure 6. Cross-plot for surface (0 to 80 m) PO4 concentrations (µmol L−1 ) for the data and model labelled by ocean region. Data from
WOA 2009 (Levitus et al., 2010).

https://doi.org/10.5194/gmd-14-125-2021                                                        Geosci. Model Dev., 14, 125–149, 2021
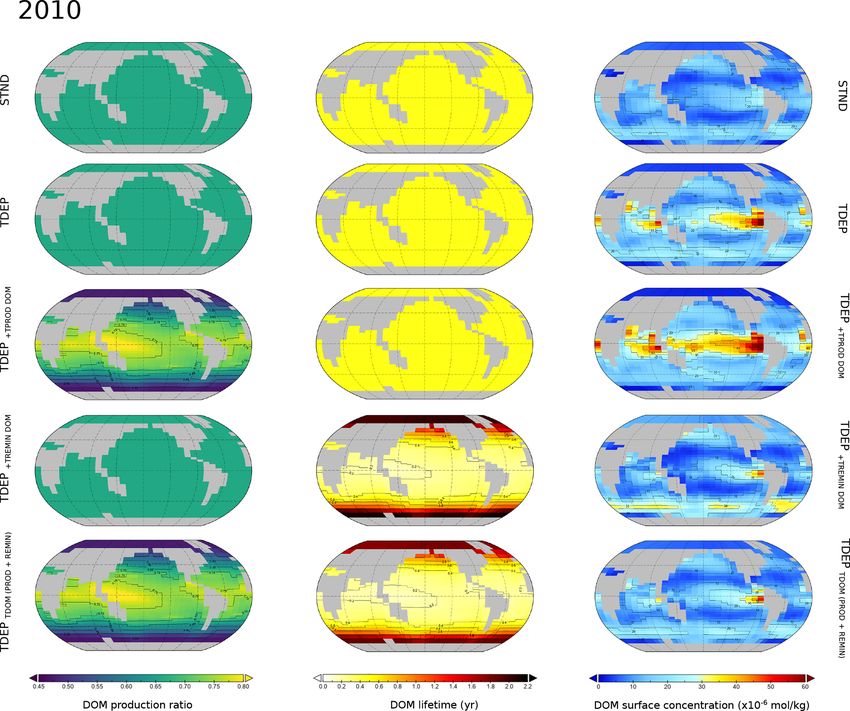
134                  K. A. Crichton et al.: Calibration of temperature-dependent ocean microbial processes in cGENIE

Figure 7. PO4 (µmol L−1 ) per depth by region for the model and data (mean and standard deviation). Data from WOA 2009 (Levitus et
al., 2010). STND is the standard model, an TDEP is the temperature-dependent model.

(Fig. 8c and d), nutrient concentrations are reduced in the        appear visually in reasonable agreement with data, although
temperature-dependent version except for the North Atlantic        in low- and middle-latitude warmer waters the OMZ occurs
(where higher surface nutrients are delivered to the deep via      higher in the water column in TDEP than STND.
the AMOC) and the high southern latitudes (with slightly
higher PO4 than the standard model).                               4.3   Tracing carbon-13
   The distribution of dissolved oxygen also provides impor-
tant information about the biological pump. Photosynthesis         In studying paleoclimates and, in particular, past states of
removes CO2 from ocean waters and adds O2 (where CO2               ocean circulation and carbon cycling, carbon-13 data are
and O2 are also exchanged with the atmosphere at the sur-          widely used as a tracer (Lynch-Stieglitz, 2003). Surface wa-
face ocean), while respiration does the opposite. As a gen-        ters have characteristic carbon-13 signatures with a pro-
eral pattern, respiration progressively reduces dissolved oxy-     nounced mostly latitudinal gradient, so changes in δ 13 C mea-
gen concentrations down the water column until a minimum           sured at any one location on the ocean floor may be at least
is reached. Below that depth – the oxygen minimum zone             partially attributed to changes in the strength and location
(OMZ) – ocean circulation reintroduces more oxygenated             of deepwater formation. The biological pump also affects
water masses from below. Dissolved oxygen concentrations           the δ 13 C signature of seawater. The process of photosynthe-
then slightly increase again with further depth as the flux        sis fractionates the carbon that is exchanged (from the dis-
of organic matter and hence respiration decline, and oxygen        solved inorganic to the organic form); carbon-12 is preferen-
is supplied through deep ocean circulation and via ventila-        tially taken up, leaving more carbon-13 in the surface waters
tion at the poles. In the Antarctic zone (Fig. 9), circulation     (Schmittner et al., 2013). As summarised by Kirtland Turner
patterns appear to dominate oxygen content (as STND and            and Ridgwell (2016), in the cGENIE model, fractionation be-
TDEP are very similar, but fairly dissimilar to data indica-       tween POC (and DOC) and δ 13 C of CO2 (aq) is a function of
tors). The North Pacific region also shows offsets between         the CO2 (aq) concentration based on an approximation of the
the model and data for O2 , PO4 , and temperature, also sug-       model of Rau et al. (1996) and Ridgwell (2001). This gives
gesting deficiencies in simulated deep ocean circulation. In       rise to a spatial distribution in the δ 13 C of exported organic
low-latitude waters, TDEP shows a better fit to data between       carbon, with lower (more negative) values at higher latitudes
the surface and 500 m than STND, suggesting that oxygen            and higher (less negative) values towards the Equator, pri-
depletion rates due to respiration are better described here.      marily reflecting the temperature control on the concentra-
Overall, the intensity of the OMZ in both STND and TDEP            tion of CO2 (aq) in surface waters. The mean flux-weighted

Geosci. Model Dev., 14, 125–149, 2021                                                https://doi.org/10.5194/gmd-14-125-2021
K. A. Crichton et al.: Calibration of temperature-dependent ocean microbial processes in cGENIE                                         135

Figure 8. Difference in PO4 concentration for best-fit TDEP compared to STND, (a, b) surface waters (0 to 80 m), and (c, d) deep waters
(1738 to 2100 m). (a, c) Absolute difference (mol kg−1 ) and (b, d) normalised difference. All are the present day; note the scale difference
in terms of the normalised difference between surface and deep water. STND is the standard model, and TDEP is the temperature-dependent
model.

Figure 9. Dissolved O2 (µmol L−1 ) per depth by region for the model and data (mean and standard deviation). Data from WOA 2009 (Levitus
et al., 2010). STND is the standard model, and TDEP is the temperature-dependent model.

https://doi.org/10.5194/gmd-14-125-2021                                                        Geosci. Model Dev., 14, 125–149, 2021
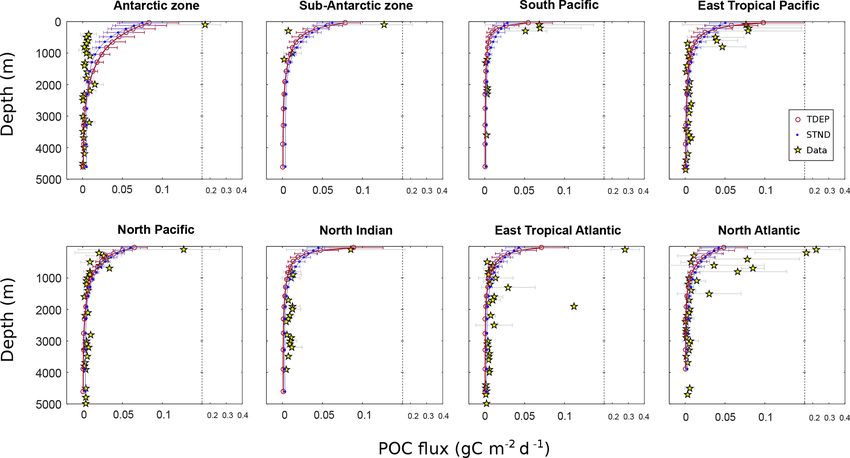
136                   K. A. Crichton et al.: Calibration of temperature-dependent ocean microbial processes in cGENIE

δ 13 C of POC is around −23 ‰ for the pre-industrial period        for POC (in gC m−2 d−1 ). TDEP and STND have differing
and around −26 ‰ by the year 2010 due to the impact of             initial POC export fluxes, with lower-latitude warmer waters
increasing CO2 (aq) on organic carbon 13 C fractionation and       showing higher export in TDEP due to the increased nutrient
the Suess effect. As POC is remineralised in the water col-        recycling there. A dataset of POC flux (Mouw et al., 2016a)
umn, low δ 13 C carbon is released, modifying the ambient          is overlaid on the remineralisation curves (Fig. 12). In both
δ 13 C of DIC. The δ 13 C of the ocean interior then represents    model configurations, the measured Antarctic zone POC flux
a balance between the input of light δ 13 C via the biological     at shallow and intermediate depths (< 1500 m) is signifi-
pump and the ingress of heavier δ 13 C supplied in deep waters     cantly lower than in the model. We do not account for iron
and ultimately sourced from high latitudes at the surface.         limitation in the Southern Ocean (or elsewhere) in this par-
   The regional mean and standard deviation for data δ 13 C as     ticular configuration of the cGENIE model, which would
well as model TDEP and STND are shown in Fig. 10. For al-          tend to limit productivity and POC export there and hence
most all regions, the broad patterns are similar to those seen     could potentially explain some of the mismatch we observe
in the dissolved O2 concentration, with benthic and deepwa-        at shallower depths. In general, the measured flux at depth
ter absolute δ 13 C values generally similar to data for both      appears reasonably represented with the exception of warmer
model configurations. One exception is the Antarctic zone          regions, where the measured POC flux (e.g. eastern tropical
where δ 13 C shows a good fit to data indicators nearer the sur-   Pacific, north Indian, eastern tropical Atlantic) is generally
face, and modelled oxygen shows a poorer fit to data nearer        higher than in the model. This likely reflects additional pro-
the surface. The offset in mid-depth waters (∼ 800 m) in the       cesses that may increase POC fluxes to depth such as ballast-
sub-Antarctic zone may be due to a reduced Antarctic inter-        ing by minerals (Klaas and Archer, 2002; Wilson et al., 2012)
mediate water contribution in the model. This may also ex-         and the lower reactivity of POC associated with increased
plain similar model offsets at this depth in the southern and      recycling in low-latitude plankton ecosystems (Aumont et
eastern tropical Pacific regions. In warm surface waters, δ 13 C   al., 2017).
is reduced more quickly with depth in TDEP than STND, as              Overall, the pattern of the efficiency of the transfer of par-
nutrient recycling occurs faster.                                  ticles from 80 to 1040 m (Fig. 13) in TDEP is similar to
                                                                   that found in Weber et al. (2016), wherein the efficiency of
4.4   POC export and implications for biological carbon            transfer is essentially a measure of the rate of remineralisa-
      pump efficiency                                              tion or what fraction of the POC exported at 80 m reaches
                                                                   1040 m. Colder waters show higher transfer efficiency, with
The inclusion of a temperature dependence term in reminer-         the lowest transfer efficiency seen in the subtropical gyres.
alisation strongly affects both the export of POM via changes      The STND model has a fixed decay rate for all locations, so
in the rate of nutrient recycling and the efficiency of the bi-    the transfer efficiency at any particular depth has a global uni-
ological carbon pump. To demonstrate the impact of each            form value. The global export-weighted mean remineralisa-
varied parameter, the export flux of POC (modelled at 80 m)        tion depth for STND is 627 m and for TDEP 378 m ±236 m.
for every simulation (not only the best-fit TDEP) is shown            It should be noted that here we have included all avail-
in Fig. 11. With a lower activation energy requirement (low        able data from Mouw et al. (2016a) without any attempt to
Ea (1) value), less energy is needed for the remineralisation      ensure these data are representative of the annual mean (for
process to occur; this means nutrients are returned to sur-        which the model output represents the annual mean). POC
face waters more quickly, production is higher, and so the         flux measurements can be highly dependent on the time of
POC flux at 80 m is higher. Conversely, the higher the Ea (1)      year and number of data measurement points available. Some
value, the more energy is required to remineralise organic         of the model–data mismatch may then be due to a mismatch
carbon. So, at higher Ea (1), proportionally more organic car-     between the interval in time represented by the data and the
bon reaches depth, making surface processes less important.        annual mean of the model. For instance, blooms, which are
The fraction of the POC exported that is recalcitrant and the      not well represented in the model, may explain some of the
maximum nutrient uptake rate at the surface become less im-        very high POC flux values (for example, 0.2 gC m−2 d−1 ) in
portant as Ea (1) increases. This trend occurs because there is    the North Atlantic and hence why the model annual mean
no variation in ocean temperature between runs in Fig. 11a;        appears to underestimate the flux.
i.e. atmospheric CO2 and climate are fixed. It is important to
note, however, that a larger Ea (1) leads to a larger sensitiv-
ity of remineralisation rates to changes in temperature, e.g. a
higher Q10 (Fig. 11b, c). The Q10 for remineralisation rates
in Fig. 11 ranges from below 2.3 (Ea (1) = 53 kJ mol−1 ) to
over 2.5 (Ea (1) = 60 kJ mol−1 ) for a change in temperature
from 0 to 10 ◦ C (Fig. 11c).
   The remineralisation curves for each ocean region are
shown in Fig. 12 for the best-fit TDEP and STND model

Geosci. Model Dev., 14, 125–149, 2021                                                https://doi.org/10.5194/gmd-14-125-2021
K. A. Crichton et al.: Calibration of temperature-dependent ocean microbial processes in cGENIE 137
Figure 10. δ 13 C of DIC (‰ VPDB) per depth by region for the model and data (mean and standard deviation). Data from Schmittner et
al. (2013). STND is the standard model, and TDEP is the temperature-dependent model.
Figure 11. Global POC flux (Pg C yr−1 ) at 80 m (a) and the effect of activation energy on (b) remineralisation rate and (c) Q10 (for a 0 to
10 ◦ C change). In (a) the STND model is shown as a black cross, and the TDEP model is indicated by circles. The best-fit TDEP setting is
double circled. STND is the standard model, and TDEP is the temperature-dependent model. Colours in (a) reflect those used in Fig. 5.
5 Implications of including temperature-dependent uptake rates due to the metabolic temperature dependence
microbial processes of photosynthesising marine biota, and the second is rem-
ineralisation rates of sinking particulate organic matter due
5.1 The role of temperature in the marine carbon cycle to the metabolic temperature dependence of respiring ma-
response to historical warming rine biota feeding on that sinking organic matter. We find
that the calibrated temperature response of the respiration-
based mechanism of remineralisation in the water column is
In this study we have focused on the two main compo-
more sensitive to temperature change (a mean Q10 of 2.28
nents of the biological carbon pump. The first is nutrient
https://doi.org/10.5194/gmd-14-125-2021 Geosci. Model Dev., 14, 125–149, 2021138 K. A. Crichton et al.: Calibration of temperature-dependent ocean microbial processes in cGENIE Figure 12. POC flux (gC m−2 d−1 ) for the model (mean and standard deviation) and data. Data from Mouw et al. (2016a). STND is the standard model, and TDEP is the temperature-dependent model. over a range of temperatures from 0 to 26 ◦ C, from Eq. 5 face waters and 0.02 ◦ C in the deepest waters). The result is using 54 kJ mol−1 for Ea (1)) than the photosynthesis-based that for TDEP this stratification-induced nutrient limitation one (the Eppley curve has a Q10 of 1.88, in Eqs. 3 and 4, effect on export is largely offset by the intensified recycling Bissinger et al., 2008), in agreement with fundamental stud- of nutrients in warmer surface and near-surface waters. ies (Brown et al., 2004). Historical temperature rise, which Between simulated pre-industrial and present-day model we induced in the cGENIE.muffin Earth system model by states, we found a substantially smaller drop in POC flux prescribing the observed CO2 in the atmosphere, provides an at 80 m when temperature dependence was included (TDEP) illustrative example of the role and importance of including compared to the standard model (STND). Global POC flux at sufficient temperature-dependent processes in models. In this 80 m is reduced by 0.3 % between the pre-industrial era and section we therefore discuss in more detail the transient dif- the present day in TDEP, but with increases in the Southern ferences between STND and TDEP model configurations. Ocean of around 10 % and in the tropics of around 1 %, sug- Between the years 1700 and 2010, global mean air temper- gesting an increase in NPP (net primary productivity) in the ature in cGENIE increases by 0.94 ◦ C. In turn, warming at tropics. Kwiatkowski et al. (2017) identified a reduction in the ocean surface induces stratification in the water column, NPP with warming in the tropical ocean of 3±1 % per degree reducing nutrient resupply to the surface from subsurface wa- of warming based on responses to ENSO (El Niño–Southern ters. In the STND model, this results in a pronounced drop Oscillation), which at face value is inconsistent with our sim- in POC export at 80 m of 2.9 % (Fig. 14), in agreement with ulation of a possible increase in NPP in the tropics. Their the average of the CMIP5 models (Bopp et al., 2013). How- estimate utilised satellite-based NPP products from data on ever, the transfer efficiency is additionally affected in TDEP, chlorophyll and light incidence, and they found that in no with a drop of over 5 % in the proportion of POC exported data constraint did NPP increase in the tropics (although the at 80 m that reaches 1040 m (equivalent to a shoaling of the data constraint varied according to the NPP product used). global mean remineralisation depth of 16 m) (Fig. 15). This However, Behrenfeld et al. (2016) noted that a reduction in reduction in biological pump transfer efficiency is a result of chlorophyll does not necessarily represent a reduction in pro- increased rates of remineralisation in the warming water col- ductivity due to photoacclimation. The satellite-based NPP umn, principally in surface and near-surface waters (while products do not account or correct for this effect, so they may whole-ocean, volumetrically weighted warming is 0.12 ◦ C well underestimate NPP in warming conditions. In an earlier over this period, 0.6 ◦ C occurs on a global mean basis in sur- study, Taucher and Oschlies (2011) found an increased NPP Geosci. Model Dev., 14, 125–149, 2021 https://doi.org/10.5194/gmd-14-125-2021
K. A. Crichton et al.: Calibration of temperature-dependent ocean microbial processes in cGENIE                                  139

                                                                     ing speeds, as larger particles sink faster (generally), and par-
                                                                     ticle size is a factor in export and transfer efficiency (Mouw
                                                                     et al, 2016b). The configuration of cGENIE we employ here
                                                                     does not account for particle size and has a fixed sinking
                                                                     speed globally (by default, 125 m d−1 ). The lack of parti-
                                                                     cle size variability and oxygen concentration’s role in rem-
                                                                     ineralisation may explain some of the increased POC flux at
                                                                     80 m that the model shows since the pre-industrial period in
                                                                     tropical waters. This tropical POC export increase may also
                                                                     be partly due to initial higher nutrient concentrations com-
                                                                     pared to data or to the increased remineralisation rates resup-
                                                                     plying nutrients to the surface, but it may also be linked to
                                                                     changes in DOM cycling (see Sect. 5.2). Predicted changes
                                                                     (and changes that may have already occurred) in NPP in low-
                                                                     nutrient warm waters are still subject to large uncertainties
                                                                     (Turner, 2015; Cross et al., 2015).
                                                                        There is also still uncertainty as to the causes, and even
                                                                     patterns, in POC flux differences across different ocean re-
                                                                     gions (Henson et al., 2012; Marsay et al., 2015; Weber et
                                                                     al., 2016; Cram et al., 2018). We find that the patterns of
                                                                     transfer efficiency (Fig. 13) for TDEP are in broad agree-
                                                                     ment with Marsay et al. (2015) and Weber et al. (2016).
                                                                     This transfer efficiency is not dependent on surface water
                                                                     NPP patterns or on how much POC is exported at 80 m in
Figure 13. Model POC transfer efficiency (also used as a measure     cGENIE; however, the absolute amount of carbon reaching
of biological carbon pump efficiency here) for STND (a) and best-    the deep ocean does depend on NPP and export. On warm-
fit TDEP (b). Transfer efficiency is the fraction of POC exported    ing since the pre-industrial period we found a reduced POC
at 80 m that reaches 1040 m for the year 2010. The global transfer   flux at 80 m and a reduction in transfer efficiency, combining
efficiency value for STND is 0.208.                                  to produce a reduction in the strength of the biological car-
                                                                     bon pump with warming. This further implies an increased
                                                                     carbon pump strength in cooler climates, as per Heinze et
when temperature dependence was included in modelled fu-             al. (2016).
ture projections. Laufkötter et al. (2017) also found that when         We note that circulation states and upwelling–
including a temperature dependence and oxygen-content-               downwelling changes can also have an impact on the
dependent remineralisation, NPP increased on warming due             distribution of carbon, oxygen, and nutrients between the
to intensified nutrient recycling in near-surface water. How-        surface and the deep (Kvale et al., 2019; Löptien and
ever, they suggested this was largely due to an initial posi-        Dietze, 2019), and they are also model-dependent. Circu-
tive bias in surface ocean nutrients. In a second model set-         lation changes are small between the pre-industrial era and
up, they reduced nutrient recycling in surface waters and            the present day compared to the simulations in Kvale et
found little impact on NPP between the temperature-sensitive         al. (2019) wherein very high CO2 (up to 1200 ppm) and
and temperature-independent model in a future projection to          high surface temperature result in large ocean circulation
2100 CE.                                                             pattern changes; increased nutrient storage in the deep ocean
   In this study we make no distinction between dissolved            was due to a longer residence time of deep ocean water
oxygen and sulfate in terms of controlling the reminer-              in that study (see Chikamoto et al., 2008, for the effect of
alisation rate of POC (unlike, for instance, Laufkötter et           Atlantic Overturning Circulation shutdown in cGENIE). In
al., 2017). Cavan et al. (2017) concluded that the large oxy-        our study we have found that the temperature-dependent
gen minimum zone in the eastern tropical Pacific reduces the         biological pump offsets some of the effects of physical ocean
rate of remineralisation due to the almost complete absence          response to warming (in increased near-surface nutrient
of zooplankton particle disaggregation within and provides a         recycling, thereby offsetting the effect of increased ocean
negative feedback to warming. However, Cram et al. (2018)            stratification that otherwise reduces surface nutrients in the
explained most of the regional variability in the flux of POC        STND simulation). However, this is not to suggest that a
in the deep sea via particle size and the effect of tempera-         temperature-dependent biological pump could offset the
ture on remineralisation, with oxygen concentration provid-          effect of extreme changes in circulation, such as an AMOC
ing a small improvement (by reducing nutrient recycling in           shutdown, or far more extreme warming scenarios than that
the eastern tropical Pacific). Particle size plays a role in sink-   applied here. We do not test such scenarios here.

https://doi.org/10.5194/gmd-14-125-2021                                                   Geosci. Model Dev., 14, 125–149, 2021
You can also read