Impact of increased resolution on long-standing biases in HighResMIP-PRIMAVERA climate models - GMD
←
→
Page content transcription
If your browser does not render page correctly, please read the page content below
Geosci. Model Dev., 15, 269–289, 2022
https://doi.org/10.5194/gmd-15-269-2022
© Author(s) 2022. This work is distributed under
the Creative Commons Attribution 4.0 License.

Impact of increased resolution on long-standing biases in
HighResMIP-PRIMAVERA climate models
Eduardo Moreno-Chamarro1 , Louis-Philippe Caron1,a , Saskia Loosveldt Tomas1 , Javier Vegas-Regidor1 ,
Oliver Gutjahr2,b , Marie-Pierre Moine3 , Dian Putrasahan2 , Christopher D. Roberts4 , Malcolm J. Roberts5 ,
Retish Senan4 , Laurent Terray3 , Etienne Tourigny1 , and Pier Luigi Vidale6
1 Barcelona  Supercomputing Center (BSC), 08034, Barcelona, Spain
2 Max Planck Institute for Meteorology, 20146 Hamburg, Germany
3 CECI, Université de Toulouse, CERFACS/CNRS, 31100, Toulouse, France
4 ECMWF European Centre for Medium-Range Weather Forecasts, Reading, RG2 9AX, United Kingdom
5 Met Office, Exeter, CE2 EX1 3PB, United Kingdom
6 NCAS-Climate, Department of Meteorology, University of Reading, Reading, RG6 6BB, United Kingdom
a now at: Ouranos, Montréal, H3A 1B9, Canada
b now at: Institut für Meereskunde, Universität Hamburg, 20146 Hamburg, Germany

Correspondence: Eduardo Moreno-Chamarro (eduardo.moreno@bsc.es)

Received: 21 June 2021 – Discussion started: 30 June 2021
Revised: 12 November 2021 – Accepted: 22 November 2021 – Published: 13 January 2022

Abstract. We examine the influence of increased resolu-            regional cloud cover and net cloud radiative effect biases.
tion on four long-standing biases using five different climate     The North Atlantic cold bias is also reduced at higher resolu-
models developed within the PRIMAVERA project. The bi-             tion, albeit at the expense of a new warm bias that emerges in
ases are the warm eastern tropical oceans, the double In-          the Labrador Sea related to excessive ocean deep mixing in
tertropical Convergence Zone (ITCZ), the warm Southern             the region, especially in the ORCA025 ocean model. Over-
Ocean, and the cold North Atlantic. Atmosphere resolution          all, the impact of increased resolution on the surface tem-
increases from ∼ 100–200 to ∼ 25–50 km, and ocean reso-            perature biases is model-dependent in the coupled models.
lution increases from ∼ 1◦ (eddy-parametrized) to ∼ 0.25◦          In the atmosphere-only models, increased resolution leads to
(eddy-present). For one model, ocean resolution also reaches       very modest or no reduction in the studied biases. Thus, both
1/12◦ (eddy-rich). The ensemble mean and individual fully          the coupled and atmosphere-only models still show large bi-
coupled general circulation models and their atmosphere-           ases in tropical precipitation and cloud cover, and in mid-
only versions are compared with satellite observations and         latitude zonal winds at higher resolutions, with little change
the ERA5 reanalysis over the period 1980–2014. The four            in their global biases for temperature, precipitation, cloud
studied biases appear in all the low-resolution coupled mod-       cover, and net cloud radiative effect. Our analysis finds no
els to some extent, although the Southern Ocean warm bias          clear reductions in the studied biases due to the increase in
is the least persistent across individual models. In the en-       atmosphere resolution up to 25–50 km, in ocean resolution
semble mean, increased resolution reduces the surface warm         up to 0.25◦ , or in both. Our study thus adds to evidence that
bias and the associated cloud cover and precipitation biases       further improved model physics, tuning, and even finer reso-
over the eastern tropical oceans, particularly over the tropical   lutions might be necessary.
South Atlantic. Linked to this and to the improvement in the
precipitation distribution over the western tropical Pacific,
the double-ITCZ bias is also reduced with increased reso-
lution. The Southern Ocean warm bias increases or remains
unchanged at higher resolution, with small reductions in the

Published by Copernicus Publications on behalf of the European Geosciences Union.
270                                                      E. Moreno-Chamarro et al.: Biases in HighResMIP climate models

1   Introduction                                                   1.1     Biases in the tropics

Climate models have biases with respect to observations,           1.1.1    Upwelling regions
some of which have persisted over model generations with
little or no improvement (e.g., Wang et al., 2014; Tian et         The first long-standing bias examined is the warm bias in
al., 2020). These biases can undermine the credibility of cli-     the eastern tropical oceans, which affects many state-of-
mate models, contributing to uncertainties in regional climate     the-art and previous-generation climate models (Li and Xie,
projections (Boberg and Christensen, 2012; Maraun, 2016)           2012; Xu et al., 2014a; Richter, 2015; Richter and Tokinaga,
and limiting their skill in predicting the climate of coming       2020). The eastern tropical oceans are characterized by in-
seasons and decades (e.g., Meehl et al., 2014; Exarchou et         tense coastal upwelling driven by the trade winds, which
al., 2021). Assessing and reducing common model biases are         bring cold, nutrient-rich waters from the deep ocean to the
therefore key topics for the climate community to address.         surface and transport them several thousand kilometers off-
    Increased model resolution is frequently seen as a way         shore. Cold surface waters contrast with warmer atmospheric
to improve model realism and hence reduce climate biases.          temperature aloft, which generates stable atmospheric con-
Most of the global climate models taking part in the CMIP          ditions that favor the formation of large-scale shallow stra-
activities have a nominal resolution of about 150 km in the        tocumulus decks. These reflect a large fraction of the solar
atmosphere and 1◦ in the ocean (e.g., IPCC, 2013), which           radiation and thereby help sustain the cold ocean surface be-
ensures a reasonable trade-off between computing time and          low. This system is misrepresented in many climate models,
model complexity. Higher-resolution models have shown im-          which fail to reproduce the cold tongue of surface waters and
provements in simulating the Gulf Stream position (e.g.,           hence exhibit a warm bias extending offshore (see, for ex-
Kirtman et al., 2012; Moreno-Chamarro et al., 2021), the In-       ample, bottom left panel in Fig. 1b). This bias has long been
tertropical Convergence Zone (ITCZ; e.g., Doi et al., 2012;        related to the underestimation of the cloud cover, which leads
Tian et al., 2020), and the storm tracks (e.g., Hodges et al.,     to warming because of excessive shortwave radiation reach-
2011), just to mention a few examples. Haarsma et al. (2016),      ing the surface (e.g., Huang et al., 2007; Hu et al., 2008).
Hewitt et al. (2017), and M. J. Roberts et al. (2018) have ex-     The warm bias, in turn, weakens the lower-tropospheric sta-
tensively reviewed the benefit of high-resolution modeling.        bility and thus hinders the formation of the stratocumulus
    On this basis, the Horizon2020 PRIMAVERA project               deck, which contributes to sustaining the surface warm bias.
(https://www.primavera-h2020.eu/, last access: 28 Decem-           Other mechanisms have been proposed to explain this bias,
ber 2021) was conceived to “develop a new generation of            including too weak equatorial and alongshore winds weaken-
advanced and well-evaluated high-resolution global climate         ing upwelling (e.g., Richter et al., 2012; Koseki et al., 2018;
models, capable of simulating and predicting regional cli-         Goubanova et al., 2019; Voldoire et al., 2019a), biases in re-
mate with unprecedented fidelity, for the benefit of gov-          gional atmospheric moisture (Hourdin et al., 2015), too weak
ernments, business and society”. Such new models have              offshore transport by ocean mesoscale eddies, and the mis-
shown improvements in the representation of various as-            representation of the coastal current system (Xu et al., 2014b)
pects of weather and climate variability, including block-         or vertical mixing in the upper ocean (e.g., Hazeleger and
ing frequency over the Pacific and Atlantic (Schiemann et          Haarsma, 2005; Exarchou et al., 2018; Deppenmeier et al.,
al., 2020), the distribution of precipitation over Europe (De-     2020). Richer (2015) extensively reviewed all these mecha-
mory et al., 2020), tropical cyclones (M. J. Roberts et al.,       nisms.
2020a; Vannière et al., 2020; Vidale et al., 2021; Zhang et al.,      Increased horizontal (typically beyond ∼ 25–50 km) and
2021), air–sea interactions over the Gulf Stream (Bellucci et      vertical resolution in the atmosphere can reduce the warm
al., 2021), and Atlantic Ocean heat transports (M. J. Roberts      bias due to an improved representation of coast-parallel
et al., 2020b). In this study, we provide a systematic as-         winds and better-resolved orography, especially along the
sessment of the impact of ocean and atmospheric resolu-            coast of west Africa (Gent et al., 2010; Milinski et al., 2016;
tion on mean climate (Sect. 3), focusing on the following          Harlaß et al., 2018). A mesoscale-resolving oceanic resolu-
long-standing biases: (i) the warm bias in the eastern tropical    tion can also mitigate the warm bias by improving the rep-
oceans, (ii) the double ITCZ, (iii) the warm Southern Ocean        resentation of the complex coastal current system as well
(SO), and (iv) the cold North Atlantic (Sects. 4 and 5). We        as the mesoscale eddy contribution to the upper-ocean heat
provide a brief introduction to each bias immediately below.       budget and offshore transport from the upwelling regions in
The models, experimental design, and observational datasets        the Atlantic (Seo et al., 2006; Xu et al., 2014b; Small et al.,
are described in Sect. 2, while the main conclusions and the       2015). However, the bias persists in some models and ocean
discussion of the results are in Sect. 6.                          basins, even after increasing their resolution (Jochum et al.,
                                                                   2005; Doi et al., 2012; Delworth et al., 2012; Milinski et al.,
                                                                   2016; Goubanova et al., 2019), which suggests that a refine-
                                                                   ment of model physics might still be necessary to remove
                                                                   it (Patricola et al., 2012; Harlaß et al., 2018). A reduction

Geosci. Model Dev., 15, 269–289, 2022                                                 https://doi.org/10.5194/gmd-15-269-2022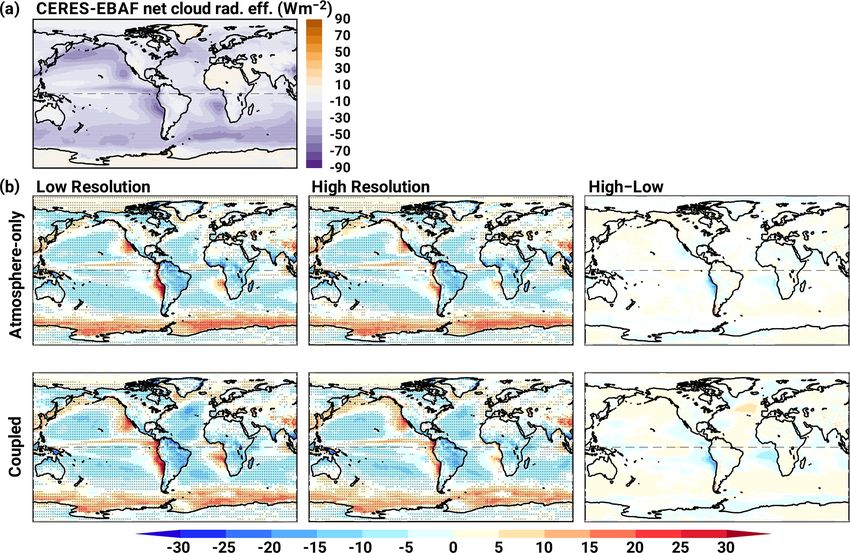
E. Moreno-Chamarro et al.: Biases in HighResMIP climate models                                                                            271

Figure 1. (a) ERA5 near-surface (2 m) air temperature (SAT; in ◦ C). (b) Left and middle: multi-model ensemble mean bias in SAT (in
◦ C) in the atmosphere-only (top) and coupled (bottom) simulations at low (left) and high (middle) resolutions. Biases are with respect to
ERA5 (shown in a). Stippling masks where at least four out of the five models agree on the anomaly sign. Right: difference between the two
resolutions. In all panels non-significant anomalies at the 5 % level (based on a two-tailed Student’s t test) are masked white. The Equator is
a dashed line in all the panels.

in the temperature and cloud biases in the eastern tropical               2019), in land temperature (Zhou and Xie, 2017), and in the
oceans might reduce current uncertainty about climate sensi-              atmosphere–ocean coupling due to sea-surface temperature
tivity (Andrews et al., 2019), impact precipitation biases for            (SST) biases amplified by the wind-evaporation-surface tem-
example over the equatorial North Atlantic (e.g., Hazeleger               perature and the Bjerkness feedbacks (Lin, 2007; Li and Xie,
and Haarsma, 2005; Huang et al., 2007; Siongco et al., 2016),             2014; Qin and Lin, 2018; Samanta et al., 2019). The double
and enhance models’ predictive skill over the tropics (Exar-              ITCZ commonly develops together with a cold surface bias
chou et al., 2021).                                                       and too weak easterlies over the equatorial western Pacific,
                                                                          which together lead to reduced convective precipitation aloft
1.1.2   The double ITCZ                                                   (Lin, 2007; Li and Xie, 2014; Oueslati and Bellon, 2015;
                                                                          Zhang et al., 2015; Samanta et al., 2019). The double-ITCZ
                                                                          bias can present distinct seasonal characteristics (Lin, 2007;
Another long-standing bias in the tropical climate in GCMs
                                                                          Li and Xie, 2014; Oueslati and Bellon, 2015; Adam et al.,
affects the representation of the ITCZ, referred to as the dou-
                                                                          2018) – although we will focus on the annual mean in our
ble ITCZ. This bias takes the form of a tropical precipitation
                                                                          analysis for the sake of simplicity.
distribution with two distinct maxima – to the north and south
                                                                             Increased model resolution can alleviate the double-ITCZ
of the Equator – instead of a single one north of the Equator,
                                                                          bias, especially over the Atlantic when the eastern tropical
as in observations (Fig. 2a and black line in Fig. 3; Schneider
                                                                          warm bias is reduced (Seo et al., 2006; Delworth et al., 2012;
et al., 2014). The double-ITCZ problem has persisted over
                                                                          Doi et al., 2012; Harlaß et al., 2018; Song and Zhang, 2020)
climate model generations (e.g., Lin, 2007; Li and Xie, 2014;
                                                                          and orography or mesoscale systems are better resolved in
Oueslati and Bellon, 2015; Zhang et al., 2015; Samanta et
                                                                          models (de Souza Custodio et al., 2017; Vannière et al., 2019;
al., 2019; Tian and Dong, 2020); it has been related to de-
                                                                          Monerie et al., 2020) and over the Pacific when tropical in-
ficiencies in the tropical or global energy budget (Hwang
                                                                          stability waves are explicitly resolved and extratropical, Pa-
and Frierson, 2013; Bischoff and Schneider, 2016; Adam et
                                                                          cific temperatures are more accurately simulated (Wengel et
al., 2016, 2018), in atmospheric deep convection (Zhang and
                                                                          al., 2021). Nonetheless, strong biases in the ITCZ and trop-
Wang, 2006; Oueslati and Bellon, 2015; Song and Zhang,

https://doi.org/10.5194/gmd-15-269-2022                                                          Geosci. Model Dev., 15, 269–289, 2022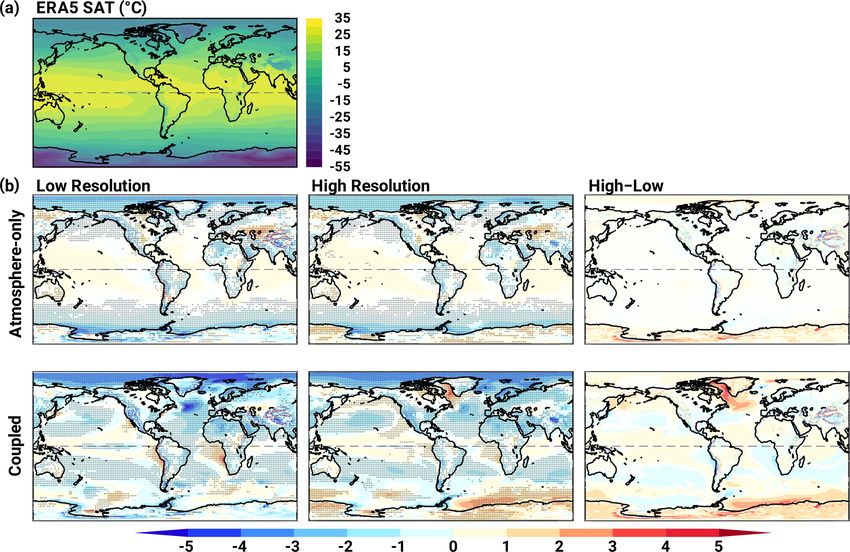
272 E. Moreno-Chamarro et al.: Biases in HighResMIP climate models
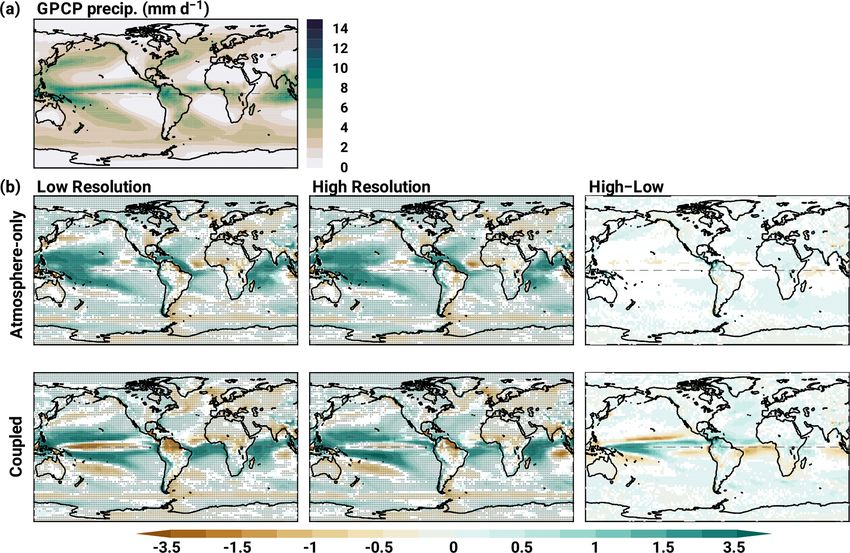
Figure 2. (a) GPCP precipitation rate (in mm d−1 ). (b) Multi-model ensemble mean bias in precipitation rate (in mm d−1 ) with respect to
the GPCP precipitation at low and high resolution (left and middle) and differences between the two resolutions (right), as in Fig. 1.
ical precipitation still develop in higher-resolution models tent and magnitude of these biases affects important aspects
(Gent et al., 2010; McClean et al., 2011; Raj et al., 2019), of the climate, not only over the SO but globally. Thus, for
which might further be reduced through improved convec- example, too warm surface temperatures result in a gross un-
tive parametrizations (Zhang et al., 2019) or the use of atmo- derestimation of the Antarctic sea ice by models (Beadling et
spheric convection-permitting (i.e., storm-resolving) climate al., 2020). Similarly, the associated misrepresentation of the
models (Klocke et al., 2017). low-level temperature gradient has been linked to an equa-
torward shift bias in the Southern Hemisphere (SH) upper-
1.2 Biases in middle and high latitudes troposphere jet (Ceppi et al., 2012). Biases in clouds over
the SO are an important uncertainty source for climate sen-
Besides biases in the tropics, climate models also present sitivity (McCoy et al., 2015; Tan et al., 2016). The biggest
substantial biases at higher latitudes, which have also per- reduction in the SO warm bias has recently been achieved
sisted across model generations. Here, we will discuss two through a more realistic representation of cloud properties
of the best-known: the SO surface warm bias and the cold over the region (Bodas-Salcedo et al., 2014; Seiki and Roh,
bias in the subpolar North Atlantic. 2020; Varma et al., 2020), which might be better character-
ized in higher-resolution models (Furtado and Field, 2017).
1.2.1 Southern Ocean
1.2.2 The North Atlantic
Both past and state-of-the-art climate models show a surface
warm bias over extensive areas at midlatitudes and higher lat- The bias in the North Atlantic surface temperature, associ-
itudes of the SO (see, for example, the bottom left panel in ated with a misrepresentation of the northward turn of the
Fig. 1b; Schneider and Reusch, 2016; Beadling et al., 2020). Gulf Stream, is frequently reported in coupled as well as
This bias has been attributed to an excessive shortwave radi- ocean-only climate models (Bryan et al., 2007; IPCC, 2013;
ation reaching and warming the surface ocean because of the Wang et al., 2014; Marzocchi et al., 2015). The bias is char-
underestimation of the cloud cover (especially mixed-phase acterized by a warm anomaly off the eastern North American
clouds) and errors in the cloud forcing (Hwang and Frierson, coast, due to a Gulf Stream separation that is too far north
2013; Bodas-Salcedo et al., 2012, 2014; Kay et al., 2016; and a cold anomaly to the east in the central subpolar region,
Schneider and Reusch, 2016; Hyder et al., 2018). The ex- due to too zonal a North Atlantic Current (see, for example,
Geosci. Model Dev., 15, 269–289, 2022 https://doi.org/10.5194/gmd-15-269-2022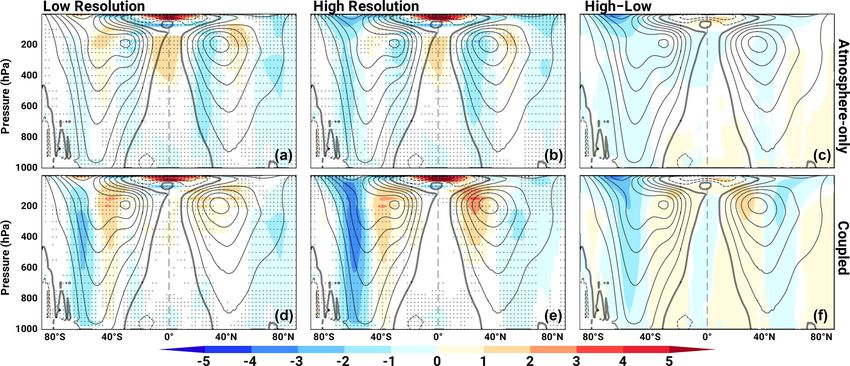
E. Moreno-Chamarro et al.: Biases in HighResMIP climate models                                                                      273

                                                                         2     Experimental setup

                                                                         2.1    Models and simulations

                                                                         We compare simulations generated with five different cli-
                                                                         mate models participating in the PRIMAVERA project and
                                                                         for which all the necessary data were publicly available on
                                                                         the CEDA-JASMIN platform at the time of the analysis (Ta-
                                                                         ble 1): CNRM-CM6-1 (Voldoire et al., 2019b), EC-Earth3P
                                                                         (Haarsma et al., 2020), ECMWF-IFS (C. D. Roberts et al.,
                                                                         2018), HadGEM3-GC31 (M. J. Roberts et al., 2019), and
                                                                         MPI-ESM1-2 (Gutjahr et al., 2019). Two resolutions for
                                                                         each model are compared (details provided in Table 1): a
                                                                         lower one, which in most cases features a standard ∼ 100–
                                                                         200 km atmosphere and an eddy-parametrized, 1◦ ocean; and
                                                                         a higher-resolution version with a ∼ 50 km atmosphere and
                                                                         an eddy-present, 0.25◦ ocean. For simplicity, the lower- and
                                                                         higher-resolution versions of each model are referred to as
                                                                         LR and HR, respectively. In all the models except for MPI-
                                                                         ESM1-2 resolution increases in both the ocean and atmo-
Figure 3. Zonally averaged precipitation rate (in mm d−1 ) in the
                                                                         sphere from LR to HR (Table 1). For the MPI-ESM1-2 only
tropics for the period 1980–2014 in the atmosphere-only (a, b) and
                                                                         the atmosphere resolution increases, from a nominal reso-
coupled (c, d) models at low (a, c) and high (b, d) resolutions. In
all the panels, the individual models are the colored, thin lines, the   lution of 134 to 67 km, both coupled to a 0.4◦ ocean. To
ensemble mean is the gray, thick line, and the GPCP dataset is the       extend the analysis and explore the benefit of an eddy-rich
black, thick line. The HadGEM3-GC31-HH (orange line) is shown            ocean model, we also analyze the HH coupled version of
in (d) only.                                                             the HadGEM3-GC31 (M. J. Roberts et al., 2019), which has
                                                                         the same atmospheric resolution as its here-referenced HR
                                                                         version (41 km) but coupled to an eddy-rich, 1/12◦ ocean
bottom left panel in Fig. 1b). Improving the representation of           (Table 1). However, the results of the HadGEM3-GC31-HH
the Gulf Stream and North Atlantic paths, as found in studies            model are simply discussed whenever they are relevant and
using ocean models at eddy-rich resolutions (∼ 0.1–0.05◦ ;               are not included to compute the ensemble means, since this
Smith et al., 2000; Bryan et al., 2007; Mertens et al., 2014),           model has a different eddy regime compared to the other HR
may therefore reduce the bias in North Atlantic temperatures             models.
(M. J. Roberts et al., 2019). However, ocean models at rela-                Following the CMIP6 HighResMIP protocol, no addi-
tively high (∼ 0.25–0.1◦ ) resolutions can still have substan-           tional tuning was applied to the HR model versions, except
tial biases in subpolar North Atlantic temperature and salinity          for a short list of parameters that explicitly change with res-
compared to 1◦ - or lower-resolution models (Delworth et al.,            olution (especially for oceanic diffusion and viscosity; see,
2012; Menary et al., 2015). Instead of increased resolution,             for example, Table 1 in M. J. Roberts et al., 2020b). Spe-
ad hoc corrections to the North Atlantic circulation and sur-            cific details about each model can be found in the references
face fluxes can also reduce the North Atlantic bias (Drews et            in Table 1. In contrast to the other models, the HR version
al., 2015). The North Atlantic bias can lead to further biases           of the ECMWF-IFS model was based on an existing config-
in the atmospheric circulation over the entire North Atlantic            uration used operationally at ECMWF and then adapted to
and Europe (Scaife et al., 2011; Keeley et al., 2012; Lee et             run at a lower resolution (C. D. Roberts et al., 2018b). We
al., 2018) and influence the characteristics of the North At-            note that four of five coupled models share an ocean com-
lantic decadal variability (Menary et al., 2015); an unrealistic         ponent based on NEMO (Nucleus for European Models of
Gulf Stream separation can similarly affect its response to fu-          the Ocean; Madec et al., 2017): CNRM-CM6-1, EC-Earth3P,
ture increases in greenhouse gases (Moreno-Chamarro et al.,              HadGEM3-GC31 use NEMO v.3.6, and ECMWF-IFS uses
2021).                                                                   NEMO v.3.4, although all differ in their atmospheric and sea
                                                                         ice components and ocean tuning parameters (more details
                                                                         in the references in Table 1). Similarly, two of five mod-
                                                                         els share an atmosphere component derived from the IFS
                                                                         (Integrated Forecasting System) of the European Centre for
                                                                         Medium-Range Weather Forecasts (ECMWF). Specifically,
                                                                         EC-Earth3P uses IFS cycle 36r4 and ECMWF-IFS uses IFS
                                                                         cycle 43r1. This similarity in the heritage of model configu-

https://doi.org/10.5194/gmd-15-269-2022                                                      Geosci. Model Dev., 15, 269–289, 2022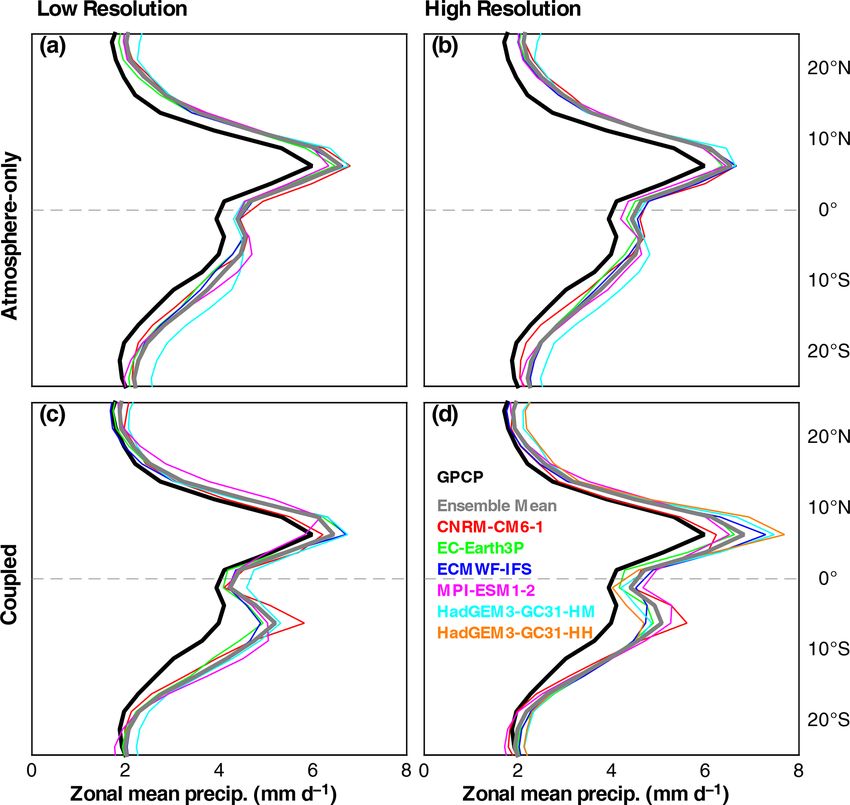
274 E. Moreno-Chamarro et al.: Biases in HighResMIP climate models
with the same low- (L) or high-resolution (H) atmosphere forced by a medium-resolution (M) SST field (M. J. Roberts et al., 2019). rations might lead to similar biases across the ensemble, and
1 Calculated as the area-weighted mean grid box diagonal in Klaver et al. (2020). 2 The LL and HH configurations refer to the coupled model versions. The equivalent AMIP resolutions are the LM and HM, respectively,
Table 1. Model names, horizontal resolution, and vertical levels in the atmosphere and ocean along with reference papers.
Reference
Vertical levels
(◦ ; km)
Ocean resolution
(top level)
Vertical levels
resolution (km)1
Atmosphere nominal
Resolution name
Model
thus our results on the impact of resolution may not general-
ize to all coupled modeling systems.
All simulations follow the HighResMIP experimental de-
sign (Haarsma et al., 2016). The experiments consist of (i)
atmosphere-only simulations (highresSST-present), which
are forced by daily, 0.25◦ SST, and sea ice concentration
from the Hadley Center Global Ice and Sea Surface Temper-
75
(100)
1◦
(0.01 hPa)
91
207
LR
ature (HadISST.2.2.0; Kennedy et al., 2017), and (ii) coupled
Voldoire et al. (2019b)
historical runs (hist-1950), which are forced by time-varying
CNRM-CM6-1
external forcing starting from a 50-year control spin-up that
uses fixed 1950s forcing. Both the atmosphere-only and cou-
75
(25)
0.25◦
(0.01 hPa)
91
75
HR pled experiments cover the period 1950–2014 – although
here we focus mainly on the 1980–2014 period (see be-
low). Comparing atmosphere-only and fully coupled climate
models allows isolating the biases arising from atmosphere–
75
(100)
1◦
(0.01 hPa)
91
107
LR
ocean interactions.
Haarsma et al. (2020)
Model simulation output is obtained from the Earth
EC-Earth3P
System Grid Federation (ESGF) nodes: CNRM-CM6-
1 (Voldoire, 2019a, b), EC-Earth3P (EC-Earth, 2018,
2019), ECMWF-IFS (C. D. Roberts et al., 2017, 2018a),
75
(25)
0.25◦
(0.01 hPa)
91
54
HR
HadGEM3-GC31 (M. J. Roberts, 2017; Coward and Roberts,
2018; Schiemann et al., 2019), and MPI-ESM1-2 (von Storch
et al., 2018a, b).
C. D. Roberts et al. (2018b)
75
(100)
1◦
(0.01 hPa)
91
80
LR
2.2 Observations and reanalysis
ECMWF-IFS
The climate models are compared against a suite of obser-
vational and reanalysis products. These include near-surface
75
(25)
0.25◦
(0.01 hPa)
91
40
HR
air temperature (SAT) and tropospheric zonal winds from
the ERA5 reanalysis (Hersbach et al., 2020), precipitation
rate from the version-2 GPCP dataset (Adler et al., 2003),
cloud cover from the version-3 ESA Cloud_cci dataset
(ESA CCI-CLOUD; Stengel et al., 2020), and net cloud
75
(100)
1◦
(85 km)
85
168
LL2
radiative effect computed from the CERES-EBAF dataset
M. J. Roberts et al. (2019)
(Kato et al., 2018; Loeb et al., 2018). The net cloud radiative
HadGEM3-GC31
effect is computed as the difference between the top-of-the-
75
(25)
0.25◦
(85 km)
85
32
HM2
atmosphere upward net flux and the clear-sky component; it
represents the net effect of clouds on the radiation budget
at the top of the atmosphere, with negative mean values
for cloud-induced cooling, and vice versa (Fig. 5a). Biases
75
(8)
0.08◦
(85 km)
85
32
HH2
in SAT and zonal winds with respect to the ERA-Interim
reanalysis (Dee et al., 2011) are very similar to those with
respect to ERA5 (not shown). Similarly, biases in SST (not
40
(50)
0.4◦
(0.01 hPa)
95
134
HR
shown) are very similar to those in SAT, which suggests SAT
Gutjahr et al. (2019)
biases are dominated by the SST ones over the ocean. The
MPI-ESM1-2
periods of comparison between models and observations are
adapted to maximize observations’ availability until the last
40
(50)
0.4◦
(0.01 hPa)
95
67
XR
simulated year (i.e., 2014). These periods are 1980–2014
for ERA5 and GPCP, 1982–2014 for ESA CCI-CLOUD,
and 2001–2014 for CERES-EBAF. Biases are computed
by adapting the ESMValTool (Eyring et al., 2020) recipe
“recipe_perfmetrics_CMIP5.yml” (https://docs.esmvaltool.
org/en/latest/recipes/recipe_perfmetrics.html, last access:
20 October 2020; Gleckler et al., 2008) to analyze the
Geosci. Model Dev., 15, 269–289, 2022 https://doi.org/10.5194/gmd-15-269-2022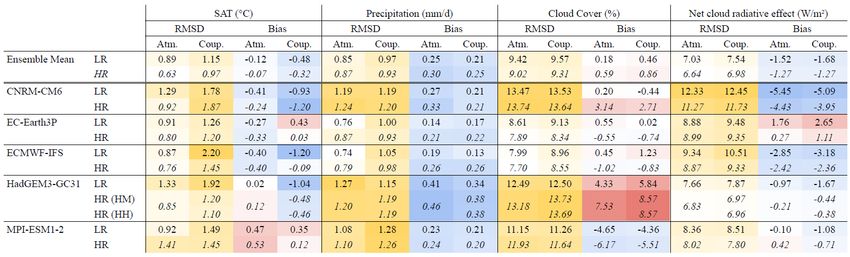
E. Moreno-Chamarro et al.: Biases in HighResMIP climate models 275
PRIMAVERA models. The statistical significance of the
Table 2. Root-mean-square deviation (RMSD) and mean bias (Bias) for the variables in Figs. 1, 2, 4, and 5 in the atmosphere-only (Atm.) and coupled (Coup.) models at LR and HR,
including the eddy-rich coupled model HadGEM3-GC31-HH. For each variable, the white to yellow shading reflects the RMSD gradient between its minimum (white) and maximum
(yellow) values. The red to blue shading, which is centered around the zero value, represents the bias values, blue meaning an excessively cold and wet model with negative biases in
differences between models or the ensemble means and
the observations is calculated for each variable based on a
two-tailed Student’s t test at the 5 % level, in which the null
hypothesis is that the two samples (model and observations)
have the same mean over the above-mentioned periods,
assuming the two samples have different variances (von
Storch and Zweirs, 1999). The associated non-significant
values are masked in white in Figs. 1, 2, 4, 5, 6, and all the
figures in the Supplement. An additional test is applied in
Figs. 1, 2, 4, 5, and 6 (shows as stippling) to measure the
agreement in the difference’s sign of the ensemble members
with respect to observations.
For the global biases and each regional bias (upwelling
regions, double ITCZ, SO, and North Atlantic) we compute
the mean bias and the root-mean squared deviation (RMSD;
Tables 2 and S1–S4 in the Supplement). The areas where
these metrics are computed are shown in Fig. S1 in the Sup-
plement and, for the tropical upwelling regions over the SH
Pacific and Atlantic, are between 105–70◦ W for the Pacific
and 30◦ W–15◦ E for the Atlantic, both between 0–30◦ S, be-
tween 100–150◦ W and 0–30◦ S for the Pacific ITCZ (as in
Tian and Dong, 2020), between 0–360◦ E and 50–70◦ S for
the SO, and between 80–10◦ W and 35–65◦ N for the North
Atlantic.
3 Global biases
the cloud cover and net cloud radiative effect compared to observations (and vice versa).
Table 2 summarizes the values of the global RMSD and bias
of four key variables: SAT, precipitation, cloud cover, and net
cloud radiative effect. These variables are chosen to assess
the different regional biases discussed in Sects. 4 and 5. On
average, the ensemble presents a too cold, wet, and slightly
cloudy climate, with excessive radiative cooling from clouds
compared to observations. The coupled and atmosphere-only
model versions present similar global biases at both resolu-
tions for all variables except for SAT, for which biases are
smaller in the atmosphere-only runs – consistent with these
being forced by observed SSTs. In terms of RMSD, the en-
semble mean presents some of the smallest values, likely be-
cause of error compensation among members.
In contrast to the ensemble mean, the EC-Earth3P and
MPI-ESM1-2 coupled models are globally warmer com-
pared to observations, mostly due to excessively warm
SO/Antarctica and tropics, respectively (Table 2 and Fig. S3).
Similarly, only the MPI-ESM1-2 models are insufficiently
cloudy compared to observations (Table 1), which is con-
nected to their strong biases over the tropics and subtrop-
ics (Figs. S6 and S7). The EC-Earth models are the only
ones that consistently show a positive radiative forcing bias
due to clouds, related to a widespread cloud overestimation
over the SO (Figs. S8 and S9). Across the ensemble, the
atmosphere-only and coupled CNRM-CM6-1 models show
the largest RMSD values, particularly in cloud cover and net
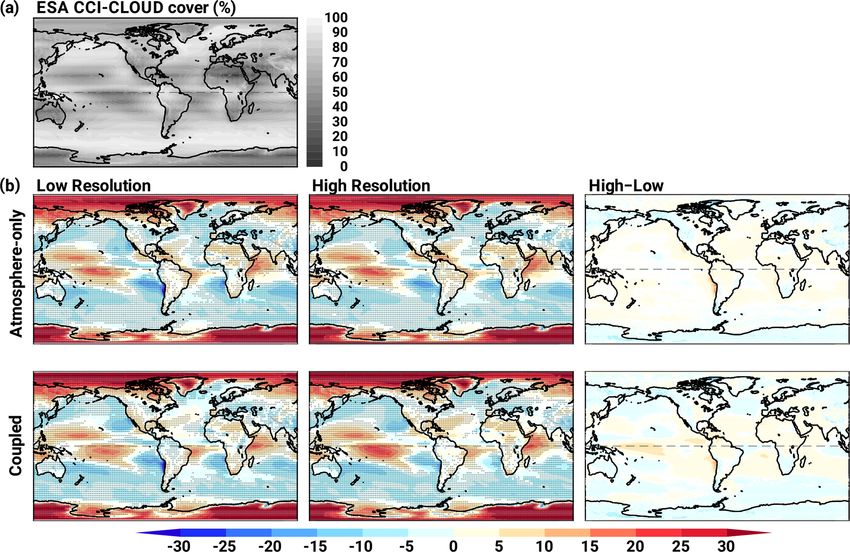
https://doi.org/10.5194/gmd-15-269-2022 Geosci. Model Dev., 15, 269–289, 2022276 E. Moreno-Chamarro et al.: Biases in HighResMIP climate models Figure 4. (a) ESA CCI-CLOUD cover (in %). (b) Multi-model ensemble mean bias in net cloud cover (in %) with respect to ESA CCI- CLOUD at low and high resolution (left and middle) and differences between the two resolutions (right), as in Fig. 1. Figure 5. (a) CERES-EBAF net cloud radiative effect (in W m−2 ). (b) Multi-model ensemble mean bias in net cloud radiative effect (in W m−2 ) with respect to CERES-EBAF at low and high resolution (left and middle) and differences between the two resolutions (right), as in Fig. 1. Geosci. Model Dev., 15, 269–289, 2022 https://doi.org/10.5194/gmd-15-269-2022
E. Moreno-Chamarro et al.: Biases in HighResMIP climate models                                                                       277

Figure 6. Multi-model ensemble mean bias in the zonally averaged zonal wind (in m s−1 ) with respect to ERA5 at low and high resolution
(a, d and b, e) and differences between the two resolutions (c, f), as in Fig. 1. Contours represent the ERA5 climatology (every 5 m s−1 ;
negative values, for easterlies, are dashed lines, and positive values, for westerlies, are solid lines).

cloud radiative effect (Table 2), whose biases are dominated           4     Biases in the tropics
by those over the tropics and high latitudes (Figs. S6–S9).
This contrasts with their relatively low global mean biases, a         4.1    Upwelling regions
clear sign of large error compensation between regions. The
HadGEM3-GC31 and MPI-ESM1-2 models both have large                     Only the coupled configurations show a distinct warm bias
global mean biases in cloud cover (respectively, excessively           in the eastern tropical oceans of a magnitude of up to 2–3 ◦ C
cloudy especially in the tropics and deficiently cloudy espe-          (Fig. 1) and of about 0.5 ◦ C on average (Table S1). This bias
cially in the subtropics and midlatitudes; Fig. S7); however,          is absent in the atmosphere-only models, as these are forced
these models have the smallest biases in net cloud radiative           by observed SSTs (Fig. 1). At LR, the bias extends over
effect. These results highlight important differences across           the eastern tropical South Atlantic and South Pacific from
models within the ensemble. Compared to previous gener-                the coast equatorward. In the Northern Hemisphere (NH)
ation CMIP5 models, the global bias in net cloud radiative             the warm bias is less evident in the models: off the Califor-
effect is lower in all the coupled models (Table 2; cf. Table 1        nian coast, only the CNRM-CM6-1, EC-Earth3P, and MPI-
in Calisto et al., 2014).                                              ESM1-2 models show a distinct warm bias (Fig. S3), whereas
   The increase in resolution from LR to HR has, on average,           off the northwest Africa, most models present a cold bias in-
a mixed effect on the global biases (Table 2). The tempera-            stead – likely the result of the strong cold bias over the sub-
ture and net cloud radiative effect biases are reduced partic-         polar region (discussed in Sect. 5.2).
ularly in the coupled models, related to improvements in the              Increased resolution leads to a reduction in the bias over
eastern tropical oceans (Sect. 4) and North Atlantic (Sect. 5)         the SH ocean basins of up to about 1 ◦ C (Fig. 1) and of about
mostly in the coupled versions of the HadGEM3-GC31 and                 0.3 ◦ C on average in the ensemble mean (Table S1). The
ECMWF-IFS models. The precipitation and cloud cover bi-                warm bias is largely reduced in both HadGEM3-GC31 HR
ases increase with increased resolution, especially the cloud          models, although using an eddy-rich ocean model (HH) leads
excess in the CNRM-CM6-1 and HadGEM3-GC31 models.                      to no further reduction compared to the eddy-present ocean
This increase in global precipitation biases at higher reso-           (HM) for the same ∼ 50 km atmosphere resolution (Fig. S3).
lution is consistent with previous literature (Vannière et al.,        For this model and bias in particular, the increase in atmo-
2020). In most cases, nonetheless, increased resolution has a          sphere resolution from a ∼ 200 to a ∼ 50 km model seems to
small impact on the global biases. Since the study of global           be more beneficial than the increase in the ocean from ∼ 100
biases hides large regional differences, we discuss these in           to ∼ 8 km (M. J. Roberts et al., 2019).
the following sections.                                                   As with many previous-generation GCMs, the surface
                                                                       warm bias is associated with an underestimation of the cloud
                                                                       cover of up to 10 %–20 % (Fig. 4) and of about 7 % on av-
                                                                       erage (Table S1) over the eastern subtropical ocean in the
                                                                       LR ensemble. The shape and magnitude of the cloud cover

https://doi.org/10.5194/gmd-15-269-2022                                                      Geosci. Model Dev., 15, 269–289, 2022
278 E. Moreno-Chamarro et al.: Biases in HighResMIP climate models
bias are similar in the atmosphere-only and coupled models, affects the LR coupled models over the central equatorial Pa-
which points to deficiencies in the atmosphere models as the cific (Fig. 1). In contrast to the Pacific, the precipitation bias
root cause. The CNRM-CM6-1 LR model shows the largest over the tropical Atlantic points to a southward-shifted ITCZ,
amplitude in the cloud cover bias of about 20 % on average with dry and wet biases to the north and south of the Equator,
(Table S1) and locally above 30 % (Figs. S6 and S7), fol- respectively, while over the Indian Ocean a wet precipitation
lowed by the MPI-ESM1-2 LR model, with a mean bias of bias extends over the western part of the basin and a dry one
about 17 % (Table S2); cloud cover biases over the upwelling over the Indian subcontinent (Fig. 2). Such differences be-
regions show nearly half the amplitude in the EC-Earth3P, tween ocean basins suggest that either different mechanisms
ECMWF-IFS, and HadGEM3-GC31 LR models (Table S2 are responsible for their biases or that each basin responds
and Figs. S6 and S7). Although the cloud cover bias persists differently to the same large-scale/global biases. Together,
into the atmosphere-only and coupled HR models, it is re- the tropical precipitation biases lead to a precipitation ex-
duced by about 10 % right along the South American western cess mainly over the SH in the LR coupled models (Fig. 3).
coast (Fig. 4). Increased resolution reduces the cloud cover All the areas with precipitation excess show positive bias in
bias over the eastern South Pacific and Atlantic in the MPI- cloud cover of up to about 10 %–20 % (Fig. 4).
ESM1-2 and HadGEM3-GC31 coupled models compared to In contrast to the LR coupled models, their atmosphere-
their atmosphere-only versions (Figs. S6 and S7). This high- only configurations show no clear double-ITCZ pattern
lights the importance of reducing the surface warm bias un- (Figs. 2 and 3). In the zonal mean, in fact, the excess in pre-
derneath and an improved atmosphere–ocean coupling. cipitation is relatively constant across all the tropics in the
The temperature and cloud biases can be connected atmosphere-only models (Fig. 3). This result suggests that
through the bias in the net cloud radiative effect (Fig. 5), the double ITCZ arises from misrepresented atmosphere–
which is positive (10–20 W m−2 ) along the western coasts ocean coupling, consistent with previous literature pointing
of the subtropical South Atlantic and North and South Pa- to simulated air–sea interactions and SST as key players in its
cific in the ensemble mean. The bias, which is dominated by development (Lin, 2007; Li and Xie, 2014; Oueslati and Bel-
the shortwave component (not shown), points to an exces- lon, 2015). The LR atmosphere-only models, instead, present
sive radiative surface warming linked to cloud cover deficit excessively wet (∼ 1.5–3 mm d−1 ; Fig. 2) and cloudy tropics
(Fig. 4). Increased resolution reduces the bias in the net cloud (∼ 10 %–20 %; Fig. 4), particularly over the western parts of
radiative effect by about 3 W m−2 on average (Table S1) all the ocean basins. These regions are where the ocean sur-
and by up to 10–15 W m−2 locally in the ensemble mean face temperature is the warmest, pointing to an excessively
(Fig. 5). This is largely because of the contributions of the strong precipitation response to the imposed SST field. It is
HadGEM3-GC31 and MPI-ESM1-2 models, especially in interesting to note that despite the different pattern in pre-
their coupled configuration and, to a smaller degree, in the cipitation biases over the tropics between the atmosphere-
EC-Earth3P and ECMWF-IFS models, with local reductions only and the coupled models, their cloud biases are very
of about 5 W m−2 (Figs. S8 and S9) as a result of the reduc- similar (compare top and bottom panels in Fig. 4b and be-
tion in the surface warm and cloud cover biases discussed tween Figs. S6 and S7). Areas with precipitation excess do
above. Contrasting with the other ensemble member, both the not systematically present positive cloud cover biases and
atmosphere-only versions and the HR coupled version of the vice versa. This suggests that, first, errors compensate across
MPI-ESM1-2 model show a negative bias in the net cloud cloud levels or types – convective cloud excess might result,
radiative effect right along the African and South American for example, in a deficit in low-level, stratiform clouds – and,
coasts over the upwelling areas (Figs. S8 and S9), linked to a second, the atmosphere–ocean coupling has a subsidiary im-
slight cloud overestimation (Figs. S6 and S7). pact on the cloud bias, which most likely arises from defi-
ciencies in the atmosphere model.
4.2 The double ITCZ Increased model resolution reduces the tropical precipita-
tion biases in the coupled models (Figs. 2 and 3), in agree-
The LR models suffer from large biases in tropical precipi- ment with previous literature (Vannière et al., 2020). In par-
tation (Fig. 2). These biases are similar in extent and magni- ticular, the double-ITCZ bias is especially reduced over the
tude to previous and contemporary models (CMIP3/5/6; cf. Pacific in the ECMWF-IFS, MPI-ESM1-2, and HadGEM3-
Fig. 2 in Tian and Dong, 2020). On average, the double ITCZ GC31 models and the southward-shifted ITCZ over the At-
emerges over the Pacific basin in the coupled models (Fig. 2), lantic in the HadGEM3-GC31 model (Fig. S5 and Table S2).
where the bias presents the characteristic pattern with pre- Over these two basins, however, the bias reduction is larger
cipitation deficit over the Equator and excess on the northern for the eddy-present HadGEM3-GC31 model than for the
and southern flanks by about ∓2 mm d−1 on average, respec- eddy-rich one (Fig. S5 and Table S2). Over both the Pacific
tively. This pattern can be identified in all the LR coupled and Atlantic, the reduction in the tropical precipitation bias
models, except for CNRM-CM6-1, in which the precipitation develops together with a reduction in the central equatorial
excess is predominantly on the southern flank. Associated Pacific cold bias of up to about 1 ◦ C and in the eastern tropi-
with the equatorial dry bias, a cold bias of up to 1–2 ◦ C also cal South Atlantic warm bias (Fig. 1), in agreement with pre-
Geosci. Model Dev., 15, 269–289, 2022 https://doi.org/10.5194/gmd-15-269-2022E. Moreno-Chamarro et al.: Biases in HighResMIP climate models 279
vious literature (Huang et al., 2007; Xu et al., 2014a; Siongco Bodas-Salcedo et al., 2019) and an overly strong net cloud
et al., 2015; Song and Zhang, 2019). By contrast, cloud bi- radiative effect (Fig. S9); these biases contrast with its weak
ases over these regions increase by about 3 % on average in SO warm bias (Fig. S3) and point to some form of com-
the ensemble mean and locally by up to 5 %–10 % with in- pensating errors (potentially due to the air–sea heat fluxes;
creased resolution in the coupled models (Fig. 4) and espe- Hyder et al., 2018; Williams et al., 2017) leading to reason-
cially in the CNRM-CM6-1, MPI-ESM1-2, and HadGEM3- able surface temperatures. These results agree with previous
GC31 models (Figs. S7 and Table S2). In most of the cou- studies relating the SO warm bias to the underestimation of
pled models, increased resolution leads to modest bias reduc- the albedo of clouds (Bodas-Salcedo et al., 2012, 2014). The
tions (overall smaller than the magnitude of the bias itself), LR coupled models also present a dry bias at midlatitudes
and thus the models still exhibit large biases in precipitation (Fig. 2). Similarly, they exhibit an equatorward shift in the
and cloud cover over the tropical Pacific and Indian oceans upper-level jet, even in models with a relatively small SO
(Figs. 2 and 4) and a clear excess in tropical precipitation warm bias, with too weak a zonal wind between the surface
(Fig. 3). and the tropopause at around 60◦ S and too strong a zonal
In the atmosphere-only models, bias reduction due to reso- wind at upper levels (∼ 200–300 hPa) to the Equator (Fig. 6),
lution in precipitation and clouds in the tropics is mostly neg- in agreement with previous studies (Ceppi et al., 2012).
ligible in the ensemble mean, and only the HadGEM3-GC31 Increased resolution has a mixed effect on the SO warm
and CNRM-CM6-1 models show a slight reduction over the bias and, although it seems to increase in the ensemble mean
western tropical North Pacific and tropical North Pacific, re- (Fig. 1), this varies substantially across models (Fig. S3 and
spectively (Figs. 2 and S4). This points to issues with the Table S3): the CNRM-CM6-1 model experiences a reduc-
atmospheric model physics, which remained unchanged be- tion in a cold bias over the Weddell Sea of up to about
tween LR and HR (Sect. 2), as the root of the precipitation 4 ◦ C; the EC-Earth3P warms along the Antarctic coast and
and cloud cover biases over the tropics. Improvements seen its widespread SO warm bias persists at HR; the ECMWF-
in the HR coupled models therefore arise from increased res- IFS model shows an increase in its temperature bias by about
olution/improvements in the ocean, better represented cou- 1.5 ◦ C on average and very strongly locally in the Weddell
pling, or both. Sea by over 5 ◦ C; the MPI-ESM1-2 shows a mean cool-
ing over the SO of about 0.5 ◦ C and becomes cold biased
especially to the west of the Antarctic Peninsula; and the
5 Biases in middle and high latitudes HadGEM3-GC31 model shows a reduction in its coastal cold
bias, developing instead a more widespread warm bias with
5.1 Southern Ocean local values of up to about 1–2 ◦ C – although the cold bias
over the Weddell Sea persists in the HadGEM3-GC31 eddy-
The SO warm bias does not appear in all the LR coupled rich model. In contrast to temperature, biases in cloud cover
models (Figs. 1 and S3). The EC-Earth3P and ECMWF-IFS and net cloud radiative effect remain relatively unchanged
models, which both use a combination of an IFS model and between LR and HR (Figs. 4 and 5). The CNRM-CM6-1
a NEMO model – albeit different versions (Sect. 2) – show a shows a 1 % reduction in its mean cloud cover bias over
mean SAT bias of about 1 ◦ C over the entire SO (Table S3) the SO, while the ECMWF-IFS and MPI-ESM1-2 models
with local values of up to 2–3 ◦ C (Fig. S3). By contrast, the show a 1 %–3 % increase over the SO (Table S3). Similarly,
CNRM-CM6-1, MPI-ESM1-2, and HadGEM3-GC31 mod- the ECMWF-IFS model shows a 1.5 W m−2 mean reduction,
els show a mean SO bias of about −1 ◦ C, but the patterns while the MPI-ESM1-2 model shows a 4 W m−2 mean in-
are more mixed, with successive regional warm and cold bi- crease in their net cloud radiative effect biases over the SO
ases that might result from a different spatial distribution in (Figs. S6–S9). Given the small reduction in the cloud cover
sea ice. Together with the SO warm bias, the LR coupled en- and net cloud radiative effect biases with increased resolu-
semble (and especially the CNRM-CM6-1, EC-Earth3P, and tion, the change in the temperature bias over the SO might
ECMWF-IFS models; Fig. S7) shows a mean underestima- be related to a change in the sensitivity of the HR coupled
tion of the midlatitude cloud cover by 5 %–10 % (Figs. 4, S7, models to the similar cloud and radiation biases or to devel-
and Table S3) and a positive mean bias in the net cloud radia- opment of further biases, for example, in the sea ice, mixed
tive effect of 5–15 W m−2 (Figs. 5, S9, and Table S3), which layer depth, air–sea heat fluxes, or the strength of the Antarc-
is dominated by the shortwave component (not shown). The tic Circumpolar Current (e.g., C. D. Roberts et al., 2018b).
MPI-ESM1-2 model shows the smallest (1 W m−2 on aver- Some of these biases might, in turn, be linked to the dis-
age; Table S3) and least widespread bias in its net cloud abling or not of the mesoscale eddy mixing at higher reso-
radiative effect over the SO (Fig. S9), which might explain lution (C. D. Roberts et al., 2018b), as discussed in Sect. 6.
its smaller surface temperature biases (Fig. S3). In contrast The dry bias over the SO remains unchanged (mean changes
to the other models, the HadGEM3-GC31 model shows a overall below 0.1 mm d−1 ) with increased resolution (Fig. 2).
positive bias in cloud cover over the SO (Fig. S7; related In agreement with previous studies, there is no obvious link-
to a recently introduced mixed-phase cloud parametrization; age between the magnitude of the SO bias and the double-
https://doi.org/10.5194/gmd-15-269-2022 Geosci. Model Dev., 15, 269–289, 2022280 E. Moreno-Chamarro et al.: Biases in HighResMIP climate models
ITCZ bias in the LR and HR coupled models (Hawcroft et Increased model resolution reduces the magnitude of the
al., 2017). Increased resolution deepens the magnitude of the cold bias by about 1 ◦ C on average (Table S4) and locally
zonal wind bias over the SH in all the models, although it has by up to 2–3 ◦ C in the ensemble mean (Fig. 1). There are,
little impact on the overall pattern (Fig. 6). however, important differences across the ensemble mem-
As for the atmosphere-only models, temperature biases bers (Fig. S2). The EC-Earth and CNRM-CM6-1 HR mod-
over most of the SO are negligible both at LR and HR els show relatively small local reductions in the cold bias by
(Fig. 1). The LR versions of the CNRM-CM6-1, EC-Earth3P, about 0.5–1 ◦ C over the central subpolar North Atlantic. The
ECMWF-IFS, and MPI-ESM1-2 models show a cold bias lack of a clear improvement in these two HR models might
of up to 2–4 ◦ C off the Antarctic coast, bias that is reduced be related to the unchanged ocean physics between the low
only in the CNRM-CM6-1 by 1–2 ◦ C at HR (Fig. S2); this and high resolutions (Sect. 2). The MPI-ESM1-2 shows no
coastal cold bias might reflect an issue in the response of the changes in the biases between resolutions over the subpo-
lower atmosphere to the imposed sea ice field, perhaps re- lar North Atlantic but a strong cooling of up to about 4 ◦ C
lated to assumed ice/snow thickness used in the land-surface over the Nordic Seas, likely related to misrepresented local
scheme to calculate skin temperature over ice. Biases in pre- sea ice. The lack of changes in the subpolar North Atlantic
cipitation, cloud cover, and cloud radiative effect are com- biases might be because both the LR and HR MPI-ESM1-
paratively similar to those in the coupled models and show 2 models use the same ocean resolution (0.4◦ ; Table 2) and
negligible improvements with resolution as well (Figs. 2–5). both present too zonal a North Atlantic Current (Müller et
It is interesting to note that all the atmosphere-only models al., 2018). Especially remarkable are the ECMWF-IFS and
show a rather zonally uniform positive bias in the net cloud HadGEM3-GC31 models, for which the cold bias is strongly
radiative effect of 5–15 W m−2 on average (Fig. S8 and Ta- reduced (Fig. S3). In the ECMWF-IFS model, this results
ble S3). Biases in the SH jet in atmosphere-only models are from a much more realistic AMOC heat transport and sea
similar but of smaller amplitude compared to those in the ice extent in the North Atlantic compared to the LR ver-
coupled models (Fig. 6). sion (C. D. Roberts et al., 2018b). In the HadGEM3-GC31,
the bias is reduced thanks to the improvement in the Gulf
5.2 The North Atlantic Stream/North Atlantic path and in the northward oceanic
heat transport with increased resolution (M. J. Roberts et al.,
All the LR coupled models show a cold bias over the cen- 2019; Grist et al., 2021). The increase in ocean resolution
tral subpolar North Atlantic and a warm one off the North from an eddy-present to an eddy-rich model leads to a more
American east coast, with local values of up to −5 and 2 ◦ C, accurate Gulf Stream representation (Moreno-Chamarro et
respectively, in the ensemble mean (Figs. 1 and S3). These al., 2021) and a reduced warm bias near the coast (Fig. S2;
temperature biases are absent in the atmosphere-only mod- M. J. Roberts et al., 2019).
els, which supports the notion that these are the result of the On average at HR, the cold bias over the subpolar North
misrepresentation of the Gulf Stream separation and path by Atlantic is replaced by a warm bias of up to about 2–3 ◦ C
the ocean model. The cold bias is especially strong in the over the Labrador Sea (Fig. 1). The warming of the en-
ECMWF-IFS model, where anomalies colder than −5 ◦ C tire subpolar North Atlantic is, in fact, one of the most re-
cover the large areas of the subpolar North Atlantic and markable differences at increased resolution in the ensem-
Nordic Seas (Fig. S3); this strong cold bias results from an ble mean. The warming is especially prevalent in the NEMO
unrealistically weak Atlantic meridional overturning circula- models at the 0.25◦ resolution, in which the warm bias is
tion (AMOC) and related heat transport, potentially related likely related to a stronger oceanic heat transport in the
to the lack of re-tuning compared to its HR version (see North Atlantic and reduced sea ice than at lower resolutions
Sect. 2 and C. D. Roberts et al., 2018b). The cold bias also (M. J. Roberts et al., 2020b), linked to too strong an ocean
extends northward into Arctic latitudes in the CNRM-CM6- deep mixing in the Labrador Sea (Koenigk et al., 2021). In
1 and HadGEM3-GC31 models, which points to a misrepre- the MPI-ESM1-2 models, by contrast, a warm bias is already
sentation of the Arctic sea ice in addition to the Gulf Stream present at LR and, together with the cold bias in the central
path and the poleward oceanic heat transport. The cold bias North Atlantic bias, remains unchanged at HR (Fig. S3). It
over the subpolar North Atlantic is accompanied by a dry is interesting to note that these two model versions share the
bias of up to about 1 mm d−1 (Fig. 2) and, in most cases, same ocean resolution (Table 1). These results highlight the
by a reduced cloud cover of up to about 10 % (Fig. 4). The importance of ocean resolution for the North Atlantic bias.
cold bias might also be related to the southward-shifted jet Changes in other biases due to resolution include a reduc-
in the NH in some models (Fig. 6) due to a southward shift tion in the dry bias over the subpolar North Atlantic (Fig. 2),
in the maximum of the horizontal temperature gradient (not likely related to the surface warming, and a deepening of the
shown); however, the bias in the NH jet might also be related bias in the NH upper-troposphere jet (Fig. 6), which might
to a southward shift in the ITCZ/Hadley Circulation (espe- be related to an intensification in eddy momentum transfer
cially in the Atlantic Basin; Fig. 2) and the associated inten- to the jet due to resolution (Willison et al., 2013) and/or to
sification of the subtropical jet. the changes in the vertical structure of the temperature bias
Geosci. Model Dev., 15, 269–289, 2022 https://doi.org/10.5194/gmd-15-269-2022E. Moreno-Chamarro et al.: Biases in HighResMIP climate models 281
across models. The change in the cloud cover bias in the en- the CNRM-CM6-1 HR model shows a modest reduction in
semble means is relatively small – of about ±5 % over the most of its biases, although it still exhibits some of the largest
entire North Atlantic – with no clear changes in the pattern biases in precipitation, cloud cover, net cloud radiative effect
(Figs. 3). over the tropics, and zonal winds at SH midlatitudes among
the ensemble. The EC-Earth3P HR model improves slightly
in the upwelling and subpolar North Atlantic regions but still
6 Discussion and conclusions shows large biases in tropical precipitation and a widespread
SO warm bias. The ECMWF-IFS HR model, the one with the
This paper examines whether increased horizontal resolu- finest atmospheric nominal resolution (∼ 40 km; Table 1),
tion alone reduces four well-known, long-standing climate shows a big reduction in the North Atlantic cold bias be-
biases in five global models developed within the PRIMAV- cause of a much more realistic Atlantic Ocean heat transport
ERA project. These biases are the warm eastern tropical compared to LR and a modest bias reduction in the tropical
oceans, the double ITCZ, the warm Southern Ocean (SO), precipitation and the eastern tropics; however, it also shows
and the cold North Atlantic. The analysis also considers an increase in the SO warm bias and no major changes in its
changes in global biases. We compare atmosphere-only and global cloud cover biases. The HadGEM3-GC31 HR models
fully coupled models to separate biases arising from poorly improve the most among the ensemble because all its biases,
resolved atmospheric and oceanic processes alone or from except for the warm SO, are reduced with increased reso-
atmosphere–ocean coupling. The increase in resolution in lution. This includes notable gains in the tropical South At-
the atmosphere and ocean goes from the traditional 200– lantic upwelling region, with a bias reduction in surface tem-
100 km grid to a 25–50 km one. The analysis also includes perature, cloud cover, and precipitation over the upwelling
an eddy-rich global coupled model at an 1/12◦ ocean reso- region, and in the North Atlantic. Last, the MPI-ESM1-2 HR
lution. Models are compared to observations and the ERA5 model improves in all the regions except for the North At-
reanalysis over the period 1980–2014. lantic, where the LR and HR, both with the same ocean res-
All the LR coupled models suffer from the above- olution, suffer from similar biases in the Gulf Stream path
mentioned four key biases, as in previous and contempo- and North Atlantic temperatures. These results illustrate how
rary generations (CMIP3/5/6; IPCC, 2013; Wang et al., 2014; strongly model-dependent the impact on the studied biases
Tian and Dong, 2020). Although increased resolution con- due to increased resolution can be.
tributes to reducing some of these biases, both globally When additional model configurations are available, the
and regionally, this is only in a few models and is model- benefit of bias reduction from increasing ocean resolution
dependent, for example, for surface temperature biases. In alone can be assessed. For the ECMWF-IFS model, in-
the ensemble mean, the warm eastern tropical ocean, the dou- creased ocean resolution from 1 to 0.25◦ reduces the North
ble ITCZ, and the cold North Atlantic biases are reduced in Atlantic, Arctic, and equatorial Pacific temperature biases
the coupled models at higher resolutions; by contrast, the SO but increases the SO warm biases (C. D. Roberts et al.,
warm bias increases or persists in some models, with small 2018b). For the HadGEM3-GC31 model, increased ocean
changes in the cloud cover and net cloud radiative effect bi- resolution of up to an eddy-rich one (0.08◦ ) improves the
ases aloft; finally, a new warm bias emerges in the Labrador Gulf Stream separation (M. J. Roberts et al., 2019) and rep-
Sea that might be related to excessive oceanic deep mixing resentation (Moreno-Chamarro et al., 2021), although the
in the coupled models using the NEMO ocean model at 1/4– eddy-rich resolution by itself has a modest impact on reduc-
1/12◦ resolution (Koenigk et al., 2021). Despite some im- ing surface temperature biases compared to the eddy-present
provements, large biases remain at higher resolutions, espe- (0.25◦ ; Fig. S3 and M. J. Roberts et al., 2019). For the MPI-
cially in precipitation and cloud cover over the tropics and in ESM1-2 model, the North Atlantic temperature and the Gulf
the midlatitude upper-tropospheric zonal wind, for which the Stream separation are also more realistic in an eddy-rich
benefit from resolution is rather modest. Our results are in ocean (∼ 0.1◦ ) compared to the LR and HR versions used
line with previous modeling work that suggests reductions in in our study (Gutjahr et al., 2019). These results thus suggest
biases due to increased resolution (e.g., Mertens et al., 2014; that an eddy-rich ocean resolution might be key to reduc-
Harlaß et al., 2018; Monerie et al., 2020; Vannière et al., ing North Atlantic and Southern Ocean temperature biases,
2020) or not at all, depending on the model and region (e.g., which is consistent with previous studies (e.g., Mertens et
Delworth et al., 2012; Menary et al., 2015; Raj et al., 2019; al., 2014; Xu et al., 2014b). Particularly important for such
Bador et al., 2020). The emergence of a consistent warm bias biases might be the treatment of the mesoscale eddy mixing
in the Labrador Sea at a high resolution poses the question of at the eddy-present resolution because mesoscale eddies be-
what new other biases might appear at increased resolution come smaller at higher latitudes and are therefore not fully
and highlights the difficult task of removing all the model resolved at the eddy-present resolution (0.25◦ ). Thus, for ex-
biases. ample, while the CNRM-CM6-1 (Voldoire et al., 2019b),
The ensemble means hide important differences across the EC-Earth3P (Haarsma et al., 2020), and MPI-ESM1-2 (Gut-
individual models. Compared to their respective LR versions, jahr et al., 2019) HR models, respectively, use a Smagorinsky
https://doi.org/10.5194/gmd-15-269-2022 Geosci. Model Dev., 15, 269–289, 2022You can also read