Detection of ship plumes from residual fuel operation in emission control areas using single-particle mass spectrometry
←
→
Page content transcription
If your browser does not render page correctly, please read the page content below

Atmos. Meas. Tech., 14, 4171–4185, 2021
https://doi.org/10.5194/amt-14-4171-2021
© Author(s) 2021. This work is distributed under
the Creative Commons Attribution 4.0 License.

Detection of ship plumes from residual fuel operation in emission
control areas using single-particle mass spectrometry
Johannes Passig1,2,3 , Julian Schade2,3 , Robert Irsig3,4 , Lei Li5,6 , Xue Li5,6 , Zhen Zhou5,6 , Thomas Adam1,7 , and
Ralf Zimmermann1,2,3
1 Joint Mass Spectrometry Centre, Helmholtz Zentrum München, 85764 Neuherberg, Germany
2 Joint Mass Spectrometry Centre, Analytical Chemistry, University Rostock, 18059 Rostock, Germany
3 Department Life, Light & Matter, University of Rostock, 18051 Rostock, Germany
4 Photonion GmbH, 19061 Schwerin, Germany
5 Institute of Mass Spectrometry and Atmospheric Environment, Jinan University, Guangzhou 510632, China
6 Guangzhou Hexin Instrument Co., Ltd, Guangzhou 510530, China
7 Universität der Bundeswehr München, 85577 Neubiberg, Germany

Correspondence: Johannes Passig (johannes.passig@uni-rostock.de)

Received: 5 December 2020 – Discussion started: 6 January 2021
Revised: 27 March 2021 – Accepted: 19 April 2021 – Published: 7 June 2021

Abstract. Ships are among the main contributors to global        the unique and stable signatures, the method is not affected
air pollution, with substantial impacts on climate and public    by urban background. With this study, we establish a route to-
health. To improve air quality in densely populated coastal      wards a novel monitoring protocol for ship emissions. There-
areas and to protect sensitive ecosystems, sulfur emission       fore, we present and discuss mass spectral signatures that in-
control areas (SECAs) were established in many regions of        dicate the particle age and thus the distance to the source. By
the world. Ships in SECAs operate with low-sulfur fuels, typ-    matching ship transponder data, measured wind data and air
ically distillate fractions such as marine gas oil (MGO). Al-    mass back trajectories, we show how real-time SPMS data
ternatively, exhaust gas-cleaning devices (“scrubbers”) can      can be evaluated to assign distant ship passages.
be implemented to remove SO2 from the exhaust, thus al-
lowing the use of cheap high-sulfur residual fuels. Compli-
ance monitoring is established in harbors but is difficult in
open water because of high costs and technical limitations.      1   Introduction
Here we present the first experiments to detect individual
ship plumes from distances of several kilometers by single-      Among the variety of air pollution sources, ships emit par-
particle mass spectrometry (SPMS). In contrast to most mon-      ticularly large amounts of sulfur, carbonaceous aerosols and
itoring approaches that evaluate the gaseous emissions, such     metals with substantial impacts on climate and public health
as manned or unmanned surveillance flights, sniffer tech-        (Corbett et al., 2007; Eyring et al., 2010; Viana et al., 2014;
nologies and remote sensing, we analyze the metal content of     Jonson et al., 2020). Between 60 000 and 400 000 annual
individual particles which is conserved during atmospheric       deaths by cardiopulmonary diseases and lung cancer as well
transport. We optimized SPMS technology for the evalua-          as 14 million cases of childhood asthma were attributed to
tion of residual fuel emissions and demonstrate their detec-     ship emissions (Sofiev et al., 2018). Mitigation strategies fo-
tion in a SECA. Our experiments show that ships with in-         cus on the sulfur aspect, e.g., by a global 0.5 % standard
stalled scrubbers can emit PM emissions with health-relevant     for ship fuels since 2020 and by implementation of sul-
metals in quantities high enough to be detected from more        fur emission control areas (SECAs, < 0.1 % S in fuel mass
than 10 km distance, emphasizing the importance of novel         since 2015) that currently comprise the Baltic Sea, the North
exhaust-cleaning technologies and cleaner fuels. Because of      Sea, and most of the US and Canadian coast. Legal alter-
                                                                 natives to the use of expensive distillate fuels in SECAs

Published by Copernicus Publications on behalf of the European Geosciences Union.
4172                                      J. Passig et al.: Detection of ship plumes from residual fuel operation using SPMS

include desulfurized “hybrid” blends of low-grade residual          et al. (2019, 2020) measured physical and chemical proper-
fuels (Lähteenmäki-Uutela et al., 2019) or the installation         ties of more than 150 ship plumes in the Baltic Sea from a
of exhaust-cleaning devices for SO2 -like flue gas scrubbers        distance of about 10 km, and Celik et al. (2020) characterized
(Winnes et al., 2018; Lehtoranta et al., 2019; Winnes et            252 ship plumes in the Mediterranean Sea and around the
al., 2020).                                                         Arabian Peninsula at distances up to 40 km from a ship-based
   Several studies investigated the effect of fuel composi-         measurement station. Such methods determine the presence
tion on ship emissions and their respective effects on cli-         of a ship plume mainly by an increase in particle number
mate (Lack et al., 2011; Sofiev et al., 2018; Yu et al., 2020;      and changes in its size distribution or by an increase in a
Corbin et al., 2019) and health (Winebrake et al., 2009; Oeder      marker substance in the particle ensemble. Dispersion mod-
et al., 2015). Beyond the SO2 emissions, the particle-phase         els of ship plumes showed rapid decrease in particle number
pollution is also specifically serious if low-grade heavy fuel      concentration within the first minutes after emission (Tian
oils (bunker fuels) are used (Moldanová et al., 2009; Sip-          et al., 2014; Celik et al., 2020). Therefore, particle number-
pula et al., 2014; Streibel et al., 2017; Di Wu et al., 2018).      based methods as well as particle integrating approaches are
Within the various health effects of such combustion parti-         limited to low background levels, and clear chemical indica-
cles, specific risks of acute cardiovascular effects were asso-     tors for ship plume presence combined with single-particle
ciated with water-soluble fractions of particle-bound metals        information may push the limits of stationary ambient mea-
(Ye et al., 2018). Of note, iron solubility is promoted by the      surements.
presence of sulfur (Fang et al., 2017), a situation that particu-      Established markers for aerosols from residual fuel com-
larly arises for ship emission particles. Implementation of the     bustion are combinations of vanadium, iron and nickel (Celo
sulfur regulations substantially decreased the use of residual      et al., 2015; Zhang et al., 2014). Single-particle mass spec-
fuels in SECAs (Jonson et al., 2019; Lähteenmäki-Uutela et          trometry (SPMS) can detect these particle-bound metals in
al., 2019). However, scrubber operation and combustion of           real time (Pratt and Prather, 2012; Passig and Zimmermann,
desulfurized residual fuels reduce PM emissions only par-           2021). Briefly, after optical sizing and introduction into vac-
tially (Fridell and Salo, 2016; Lehtoranta et al., 2019; Winnes     uum, particles are exposed to intense UV laser pulses that
et al., 2020), and there is vital interest in assessing the en-     form a microplasma (laser desorption/ionization, LDI). Both
vironmental and health effects (Winnes et al., 2018). Fur-          positive and negative ions are analyzed with respect to their
thermore, compliance monitoring and emission inventories            mass-to-charge ratio (m/z). Thus, the size and a chemical
would benefit from the ability to distinguish between these         profile from individual particles are obtained. SPMS studies
options for ship operation.                                         documented air pollution by regional transport of emissions
   Compliance monitoring on short distances is typically            from harbors and shipping lanes (Reinard et al., 2007; Ault
based on gas-phase measurements of CO2 and SO2 in the               et al., 2009; Arndt et al., 2017; Gaston et al., 2013; Liu et
plumes of passing ships in harbors or at bridges (Kattner           al., 2017; Wang et al., 2019). Also, individual ship plumes
et al., 2015; Mellqvist et al., 2017b; Zhang et al., 2019).         were analyzed by in-port studies (Healy et al., 2009; Ault et
However, these places are known to be monitored, and on-            al., 2010; Xiao et al., 2018), demonstrating that SPMS can
board checks also occur frequently (Lähteenmäki-Uutela et           distinguish between residual fuel combustion and distillate
al., 2019). Plume analysis in open water requires expen-            fuel operation, predominantly by the metal signatures. All
sive surveillance flights (Beecken et al., 2014; Van Roy and        these studies were performed outside SECA zones, and, for
Scheldemann, 2016). Unmanned aerial vehicles can reduce             the individual plume analyses, on short distances to the ships.
these costs but have limitations in cruising range, payload            With the present study, we apply SPMS with resonant ion-
and weather conditions (Zhou et al., 2020). Optical sensing         ization of iron (Passig et al., 2020) for the detection of indi-
technologies that have been utilized to monitor ship plumes         vidual ship plumes from the distance to evaluate residual fuel
on distances of a few kilometers comprise light detection and       combustion in SECAs, also for ships equipped with scrub-
ranging (lidar), ultraviolet cameras and multi-axis differen-       bers. We show that this approach is independent of back-
tial optical absorption spectroscopy (MAX-DOAS) (Balzani            ground air pollution, and we discuss the limits of detection
Lööv et al., 2014; Seyler et al., 2017).                            over large distances. By examining indicators for particle
   Particles often preserve source-specific chemical signa-         ageing and the effects of inaccuracies in wind field deter-
tures while being transported by the wind over large dis-           mination, we pave the way for future open-sea monitoring of
tances. Field studies on particulate matter (PM) from ship          ship plumes using SPMS.
plumes can be performed by following ships at some hun-
dreds of meters to a few kilometers’ distance (Chen, 2005;
Lack et al., 2009; Petzold et al., 2008; Berg et al., 2012).
A different approach to characterize ship plumes is by sta-
tionary ambient measurements downwind of shipping lanes
while recording the ship transponder data (automatic identifi-
cation system, AIS) (Diesch et al., 2013). Recently, Ausmeel

Atmos. Meas. Tech., 14, 4171–4185, 2021                                              https://doi.org/10.5194/amt-14-4171-2021
J. Passig et al.: Detection of ship plumes from residual fuel operation using SPMS                                          4173

2     Experimental                                                et al., 1999), extracted from the open-source toolkit FATES
                                                                  (Flexible Analysis Toolkit for the Exploration of SPMS data)
2.1    Single-particle mass spectrometer and sampling             (Sultana et al., 2017) with a learning rate of 0.05, a vigilance
                                                                  factor of 0.8 and 20 iterations. Ion peak assignments corre-
The SPMS instrument was manufactured by Hexin In-                 spond to the most likely ion at a given mass (m/z). It should
struments Ltd., Guangzhou, China, and Photonion GmbH,             be noted that SPMS obtains numbers of particles with partic-
Schwerin, Germany (Li et al., 2011; Zhou et al., 2016). It        ular chemical signatures, not the mass concentration of these
consists of a dual-polarity mass spectrometer in Z-TOF ge-        components.
ometry (Pratt et al., 2009), an aerodynamic lens inlet and
75 mW continuous-wave lasers (wavelength λ = 532 nm),             2.3    Meteorological and ship transponder data
ellipsoidal mirrors and photomultipliers for particle detec-
tion and sizing. The instrument is equipped with a KrF-           Air trajectories were calculated using the interactive
excimer laser (λ = 248.3 nm, PhotonEx, Photonion GmbH,            HYSPLIT web tool from the National Oceanic and Atmo-
Germany). The used wavelength is well-suited for resonance-       spheric Administration model GDAS with 0.5◦ resolution
enhanced laser desorption/ionization (LDI) of iron (Passig        (http://www.ready.noaa.gov/HYSPLIT.php, last access:
et al., 2020). Setting the lens (f = 200 mm) to an off-focus      24 March 2021) (Stein et al., 2015). Hourly wind data were
position of 7 mm with respect to the particle beam, the           obtained from the web archive of a local meteorological
spot size was about 150 × 300 µm and the resulting inten-         station that belongs to Germany’s National Meteorolog-
sity 5 GW cm−2 at 6 mJ pulse energy. The off-focus posi-          ical Service, 12 km north of the sampling site and close
tion in conjunction with the flat-top profile of the excimer      to the harbor exit (https://www.dwd.de/DE/leistungen/
laser beam allows hit rates of around 50 % (particles produc-     klimadatendeutschland/klarchivstunden.html#buehneTop,
ing mass spectra vs. optically detected particles) (Schade et     last access: 12 November 2020). AIS data for all ships
al., 2019; Passig et al., 2020).                                  sailing between 54◦ N, 11.5◦ E and 55.5◦ N, 16◦ E in the
   The setup was housed in the southern periphery of the          measurement period (26 June–2 July 2018) were acquired
city of Rostock (population 210 000) contributing urban           from the German Federal Waterways and Shipping Adminis-
background aerosols in between the sampling site and the          tration in anonymized form, analyzed and filtered by custom
coast. Possible regional aerosol sources comprise the ur-         software on the Matlab platform.
ban area of Rostock, forests in the northeasterly direction
and farmland in the surrounding area; see Fig. 1. Ambi-           3     Results and discussion
ent air was sampled directly on the roof of the laboratory
building (54◦ 040 41.500 N, 12◦ 060 30.600 E), about 35 m above   3.1    Chemical profile of residual fuel emission particles
sea level. Because the study focuses on particles from dis-
tant sources, the sampling was optimized for larger particles     During 26 June–2 July 2018, a total number of 290 144 par-
0.5 µm in size at the expense of efficiency for smaller par-      ticles were detected by the SPMS instrument, and 162 288
ticles, such as local traffic emissions. Therefore, an aerosol    particles yielded mass spectra and were sized and chemically
concentrator, originally designed for particles above 2 µm in     analyzed. The ART-2a algorithm produced 715 particle clus-
size, was used (model 4240, MSP Corp., USA) (Romay et             ters, whereof the top 300 clusters accounting for > 90 % of
al., 2002). The multi-stage virtual impactor of this device       the particles were visually inspected. Similar clusters based
concentrates particles from the 300 L min−1 intake airflow        on the ion signal of key species were grouped by hand into
into a 1 L min−1 carrier gas stream, from which 0.1 L min−1       six general categories. The mass spectra of the six general
were finally guided into the SPMS instrument. The real con-       particle classes can be found in the Supplement, Fig. S1, as
centration factor for ambient air particles around 0.5 µm in      well as the discussion on it. Here we focus on the class of
size was approximately 10 : 1, as estimated in previous ex-       ship emission particles.
periments (Passig et al., 2020). Corrections of the inlet effi-      The combination of signals from the transition metals V,
ciency have not been applied.                                     Fe and Ni is a well-documented marker for particles from
                                                                  residual fuel combustion on ships (Healy et al., 2009; Ault et
2.2    Analysis of single-particle mass spectra                   al., 2010; Xiao et al., 2018; Furutani et al., 2011; Reinard
                                                                  et al., 2007); see Fig. 2 for the mass spectrum. The rela-
Using custom software on the Matlab platform (MathWorks           tive peak intensities do not reflect the mass concentration
Inc.), mass spectra were computed from time-of-flight data        of these species, and further metals such as Zn and Cu are
considering peak area within nominal mass resolution. Pos-        less frequently detected in SPMS, despite their high con-
itive and negative mass spectra including the metal signa-        centration in the fuels and particles (Viana et al., 2009;
tures were separately normalized, and missing negative ion        Popovicheva et al., 2012; Moldanová et al., 2009; Streibel
spectra were set to zero. We classified the particles using       et al., 2017; Corbin et al., 2018). In previous studies on ship
the adaptive resonance theory neural network, ART-2a (Song        emissions, vanadium signals dominated largely over Fe and

https://doi.org/10.5194/amt-14-4171-2021                                            Atmos. Meas. Tech., 14, 4171–4185, 2021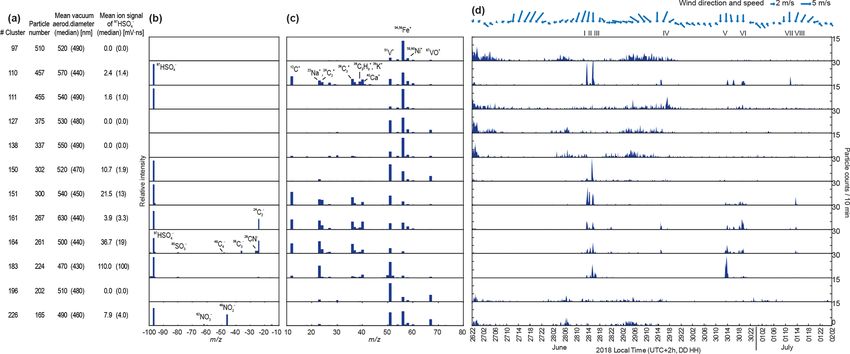
4174 J. Passig et al.: Detection of ship plumes from residual fuel operation using SPMS
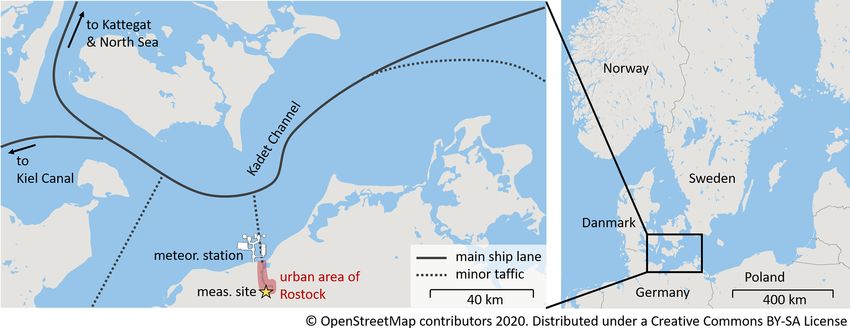
Figure 1. Overview map of the region illustrating the major ship lanes and the position of the measurement site and the meteorological
station providing the wind data. A more detailed map can be found in Fig. 5.
Ni peaks (Healy et al., 2009; Ault et al., 2010) and were 3.2 Temporal profile of residual fuel emission particles
partly treated as a singular marker (Xiao et al., 2018). Of
note, the KrF-excimer laser used in our experiment reso-
The measurements were performed during a period of rel-
nantly ionizes particle-bound Fe, enabling a more efficient
atively calm summer weather with light to moderate winds
and secure detection of iron (Passig et al., 2020). This al-
from mostly northern to eastern directions, representing
lows us to strengthen the assignment by counting only par-
a typical scenario for a northern European coastal region
ticle clusters to the V–Fe–Ni class that show either the com-
during summer. The mean PM2.5 mass was 4.0 µg cm−3
plete peak pattern of 51 V+ , 56 Fe+ , 58 Ni+ , 67 VO+ or 51 V+ ,
54 Fe+ , 56 Fe+ , 67 VO+ . and the mean particle number density was 44 cm−3 (0.25–
32 µm), as measured by a monitoring station near the coast-
Beyond the transition metals from residual fuel combus-
line (Grimm EDM-180, http://www.lung.mv-regierung.de/
tion, the V–Fe–Ni particles reveal Ca+ ions that can be at-
umwelt/luft/akt_wahl.htm, last access: 25 March 2021). Fig-
tributed to additives of lubrication oil (Toner et al., 2006;
ure 3a lists the regions passed by the air masses within the
Spencer et al., 2006), minor signals from elemental carbon
last 24 h before arriving at the sampling site, while the back
(EC) and organic carbon (OC) as well as a particularly in-
trajectories are shown in Fig. S4. The last hour of air trans-
tense 97 HSO− 4 peak. Considering a strong
97 HSO− signal
4 port before arriving at the site can be determined from the lo-
also from other particle classes (compare Fig. S1), the sul-
cal wind data. Air masses crossing the heavily trafficked ship
fate can be primary and secondary.
lanes > 20 km north of the coast (see Fig. 1) enter the site,
Apart from the sea salt, the particles of all classes show
passing the urban area of Rostock. The wind data (Fig. 3b)
comparable sizes, peaking around 400–500 nm; see Fig. S1a.
reveal a pronounced land/onshore circulation, with regular
One explanation lies in the setup: the optical detection of par-
northern winds in the afternoon and light winds from dif-
ticles based on Mie scattering drops rapidly, approaching the
ferent directions in the night and morning hours. Figure 3c
Rayleigh limit around 150 nm (for a 532 nm scattering wave-
shows time series of the particle numbers within the general
length) (Gaie-Levrel et al., 2012). Furthermore, the aerosol
particle classes, while Fig. 3d shows their relative contribu-
concentrator is optimized for particles of 2.5–10 µm in size
tion to total particle numbers, both with 10 min resolution.
(Romay et al., 2002). While detailed data on its performance
In the following, we discuss only the mass spectra and time
for small particles are not available, we could estimate an
series of V–Fe–Ni particles; for all other classes we refer
approximately 10-fold concentration for 0.5 µm particles and
to the Supplement. The V–Fe–Ni particles (Fig. 3e) resem-
particle losses of at least 50 % below 0.5 µm in a previous
ble the temporal profile of the EC–OC particles, however,
study (Passig et al., 2020). Beyond the instrumental aspect,
with additional transient features that have a width of ap-
particles in the accumulation mode can be dominant if local
proximately 20–60 min and occur only during wind from the
emissions are of minor importance or if they rapidly grow,
north. As is apparent from Fig. 3d, the V–Fe–Ni class con-
e.g., by condensation of secondary material (Seinfeld and
tributes only a small fraction to total particle numbers, while
Pandis, 2016).
during the transient events they account for 10 %–20 %.
In order to give an estimate of the benefit of resonant Fe
ionization, we performed laboratory experiments on a re-
search ship engine. Herein, we compared the SPMS spec-
tra and the fraction of particles showing metal signatures for
Atmos. Meas. Tech., 14, 4171–4185, 2021 https://doi.org/10.5194/amt-14-4171-2021
J. Passig et al.: Detection of ship plumes from residual fuel operation using SPMS                                                       4175

Figure 2. Average anion mass spectra (a) and cation mass spectra (b) of residual fuel emission particles. The other particle classes are shown
in Fig. S1, and the top 300 particle clusters from ART-2a analysis are shown in Figs. S5 and S6.

Figure 3. (a) Air mass origin (top row: > 12 h, bottom row < 12 h) according to the HYSPLIT back-trajectory analysis (Fig. S4). (b) Mea-
sured wind data from the meteorological station at the harbor exit, 12 km north of the measurement site. (c) The time series of particle counts
from the general particle classes shows regional/long-range transported air pollution (26–29 June) and night-time secondary organic aerosol
formation (29 June–2 July); see the Supplement for a detailed discussion. (d) The same data as (c) but normalized to total particle counts
illustrate the contribution of each particle type. (e) The temporal behavior of V–Fe–Ni particles (black) from residual fuel combustion reveals
transient events (ship plumes I–VIII) and smooth background signals, predominantly during onshore winds. Apart from the short events,
their contribution to total particle numbers is low. The plumes can also be recognized by evaluating only the presence of 51 V+ and 67 VO+
(grey area, relative peak area of 51 V+ > 5 % and 67 VO+ > 0 %), however with some false positive results from interference with fragments,
especially during events with high counts of organic aerosols.

the resonant Fe ionization at 248 nm versus the more com-                 with further atomic absorption lines of the metals (Passig et
mon SPMS wavelength at 266 nm. The results are shown in                   al., 2020).
Fig. S3. Although these are no ambient air experiments on                    The particle identification via ART-2a clustering that rec-
real plumes, the results indicate an ≈ 15 times more frequent             ognizes the full pattern of V, Ni and Fe can be evaluated by
detection of Fe at 248 nm, which roughly corresponds to the               a comparison with an ion-marker screening for only 51 V+
Fe enhancements found in the ambient air study (Passig et                 and 67 VO+ , as shown by the grey area in Fig. 3e. 51 V+
al., 2020). Of note, V is ≈ 2 times and Ni ≈ 4 times more fre-            and 67 VO+ may interfere with major organic fragments (and
quently detected; see Fig. S3. An explanation can be found                56 Fe+ with 56 CaO+ ), as apparent for periods with high con-

in the relatively broad laser spectrum at 248 nm overlapping              tributions from organic particles in Fig. 3. Higher signal

https://doi.org/10.5194/amt-14-4171-2021                                                     Atmos. Meas. Tech., 14, 4171–4185, 2021

4176                                     J. Passig et al.: Detection of ship plumes from residual fuel operation using SPMS

thresholds for marker ions can mitigate that problem at the        mented (Neubauer et al., 1997; Dall’Osto et al., 2006). Hatch
cost of sensitivity.                                               et al. (2014) found that laser absorption and particle ablation
                                                                   in LDI are reduced from coatings of secondary species, fi-
3.3    Background particles and particles from transient           nally affecting mass spectra for both polarities.
       events                                                         Previous studies on ship emission particles have discussed
                                                                   the lack of negative ion mass spectra (Ault et al., 2009), the
To elucidate the sources and atmospheric processing of the         balance between sulfate and nitrate (Liu et al., 2017) or solely
V–Fe–Ni particles, we separately analyzed the mass spec-           the presence of nitrate signals (Wang et al., 2019) as indica-
tra and temporal behavior of the 12 most abundant clusters         tors of atmospheric ageing. However, a suppression of pos-
out of the total 15 clusters assigned to the V–Fe–Ni class.        itive ions through ageing was not reported in these studies,
Figure 4a lists the clusters according to their labels in the      although the mass spectra of substantially aged ship particles
full cluster analysis (first row) in the order of their respec-    shown by Ault et al. (2009) also reveal a low relative intensity
tive particle counts (second row). The average mass spectra        of EC, OC, Ca+ and Na+ compared to the freshly emitted
of the clusters (Fig. 4b and c) show signals from EC, OC,          particles documented by in-port studies (Healy et al., 2009;
Ca+ and Na+ as well as the metal signatures. Generally, all        Ault et al., 2010; Liu et al., 2017; Xiao et al., 2018). Gen-
clusters with negative ion spectra reveal a dominant 97 HSO−  4    erally, the formation of negative ions by electron capture re-
peak (with additional EC signals for clusters 161 and 164 and      quires previous generation of positive ions and is therefore
nitrate for cluster 226).                                          more prone to suppression effects. In consequence, the rel-
   Time series of the particle clusters are depicted in Fig. 4d.   ative heights of positive ion peaks apart from the transition
An important finding here is that the cluster algorithm was        metals should be considered a further estimate for the amount
exclusively applied to chemical particle data, but it also         of atmospheric ageing of ship particles. The respective mass
yielded two distinct groups according to the particle’s tem-       spectral indicators for ageing of V–Fe–Ni particles are sum-
poral behavior, as discussed in the following. The first group     marized in Table 1.
of V–Fe–Ni particles, comprising the clusters 97, 111, 127,
138, 196 and 226, shows rather smooth time series, compa-
                                                                   3.4   Metal signatures of V–Fe–Ni particles
rable to the EC–OC class in Fig. 3c. The mass spectra of
this group reveal either no negative ions or comparably small
signals from sulfate (fourth row in Fig. 4a) or secondary ni-      In contrast to anions and EC, OC as well as alkali cations, the
trate (cluster 226). Also, the positive ion signals apart from     transition metal signals are more stable and remain also after
transition metals are weak. The smooth temporal behavior           long-range transport (Furutani et al., 2011; Ault et al., 2009).
(Fig. 4d) gives rise to the term “background group”. These         A difference to all previous SPMS studies on ship emis-
particles are predominantly observed during phases of light        sions is the strong Fe+ signal and the remarkable Ni+ signal
onshore winds, also from northwesterly directions, where           in most particles. Therefore, it appears feasible to evaluate
heavily trafficked ship routes towards the North Sea and the       whether V/Fe signal ratios may be indicative for a specific
Atlantic Ocean are located. Such particles most likely origi-      source, e.g., as a result of different fuel composition (Viana et
nate from distant shipping lanes.                                  al., 2009). However, from Fig. 4c and d, it becomes apparent
   The second group identified by mass spectral signatures         that the same transient events or sources contribute particle
contributes the transient events and is formed by the clus-        clusters with very different V/Fe ratios. On the other hand,
ters 110, 150, 151, 161, 164 and 183. All of these particle        these ratios do not differ much among the plumes, as sum-
clusters show negative ions and, with the exception of cluster     marized in Table 2. Only plume V stands out by higher V+
150, also remarkable signals of EC, OC, Ca+ and Na+ in the         signals in relation to the other metals and also by a particu-
positive ion mass spectra. We term these particles the “tran-      larly high sulfate signal.
sient group”, as their temporal behavior points to individual,        In general, background particles tend to show higher Fe
less distant sources. Cluster 111 combines both properties.        and lower V signals compared to the transient group, but due
Because of the biased aerosol concentration and sampling           to a number of exceptions (clusters 110 and 196), we can-
in our study, the particle size distribution is rather uniform     not draw clear conclusions here. Note that the LDI signal
and allows no differentiation between local and distant emis-      strength in SPMS does not necessarily indicate the compo-
sions.                                                             nent’s mass concentration. Beyond the transition metals, Ca+
   The main difference between the two groups is the limited       signals appear in all clusters of the transient group. Strong
number of negative ion signals and the weaker positive signa-      calcium signals from lubrication oil additives were fre-
tures from EC, OC, Ca+ and Na+ for the background parti-           quently observed in SPMS studies on diesel engines (Toner
cles. The absence of negative ion signals in SPMS was com-         et al., 2008; Shields et al., 2007), mainly because of its low
monly associated with water uptake during aerosol ageing           ionization potential, and calcium was also found in particu-
(Neubauer et al., 1998; Moffet et al., 2008; Ault et al., 2010),   late emissions from ships using residual fuels (Moldanová et
but suppression effects on positive ions were also docu-           al., 2009; Streibel et al., 2017).

Atmos. Meas. Tech., 14, 4171–4185, 2021                                             https://doi.org/10.5194/amt-14-4171-2021
J. Passig et al.: Detection of ship plumes from residual fuel operation using SPMS 4177
Figure 4. Results of the ART-2a clustering for 12 of the 15 clusters showing signatures of residual fuel combustion. (a) Cluster number
according to their labels in the full cluster analysis (see the Supplement), particle number, vacuum aerodynamic diameter and average sulfate
signal of the clusters. (b) Weight matrices (spectra of the cluster center) of negative ions and (c) positive ions corresponding to average
mass spectra. (d) Top: measured wind data and ship plume numbers; bottom: time series of particle counts with 10 min resolution. Note the
different y-axis scales. While only mass spectral data were considered in the clustering algorithm, the time series of the resulting clusters
also reveal two distinct groups: the transient group with bipolar mass spectra and short events as well as the background group with dominant
metal signatures and smooth time series.
Table 1. Mass spectral signatures that indicate the degree of ageing for particles from residual fuel combustion.
Neg. ion mass spectra Pos. ion mass spectra References
Freshly emitted EC, high-sulfur fuels: V–Fe–Ni, EC, OC, Na, Ca Ault et al. (2010), Healy et al. (2009),
−80 SO− , Xiao et al. (2018), Liu et al. (2017)
3
dominant −97 HSO− 4
Moderately aged, −97 HSO− , V–Fe–Ni, smaller EC, OC, Na, Ca Liu et al. (2017), Arndt et al. (2017),
4
local – regional secondary nitrate Gaston et al. (2013), Wang et al. (2019),
this work
Substantially aged, No signals or secondary Dominant V–Fe–Ni Ault et al. (2009), Furutani et al. (2011),
regional – long-range sulfate, nitrate, Arndt et al. (2017), this work
methanesulfonate
3.5 Sulfate signals that are not correlated with the number of V–Fe–Ni parti-
cles. However, for some of the transients from V–Fe–Ni par-
As is apparent from the fourth row in Fig. 4a, there are ticles, we find coinciding features of sulfate levels within the
considerable differences in sulfate signals, both between the full particle ensemble. Comparison with the sulfate ion yield
clusters of the transient group and between the plumes; see from only V–Fe–Ni particles (brown) reveals that this parti-
Table 2. Although sulfate can also be secondary, fresh plumes cle type contributes the main fraction of sulfate during these
from sulfur-rich fuel combustion have particular high sul- incidents.
fate contents from gas-particle conversion of SO2 (Murphy et
al., 2009; Ault et al., 2010; Healy et al., 2009). In this regard, 3.6 Assignment to ships
the temporal trend of the sulfate ion yield from all particles
is plotted in Fig. 5b (yellow area), while the time series of all Land-based sources can be excluded for the transient group
V–Fe–Ni particles are again shown in Fig. 5a for compari- particles, because there are no refineries or chemical indus-
son. The sulfate yield shows slightly elevated background for try plants in the town, and the local coal power plant was
marine air during northern winds and some smaller features not in operation during measurements. There are two pos-
https://doi.org/10.5194/amt-14-4171-2021 Atmos. Meas. Tech., 14, 4171–4185, 20214178 J. Passig et al.: Detection of ship plumes from residual fuel operation using SPMS
Table 2. Ship plumes according to Figs. 3, 4 and 5, their main properties as well as the median of relative signal ratios for metals and sulfate
signals.
Ship Peak time Plume Number of Particle Peak area Peak area Peak area 97 HSO−
4
plume duration characterized size ratio ratio ratio signal/particle
(min) particles (nm) V/(V + Fe) V/(V + Ni) Fe/(Fe + Ni) (mV ns)
I 28 June 13:45 45 182 450 0.55 0.64 0.57 0.23
II 28 June 14:30 45 103 470 0.69 0.85 0.70 0.73
III 28 June 15:30 45 276 450 0.56 0.73 0.70 0.33
IV 29 June 15:15 60 119 470 0.48 0.58 0.59 0.40
V 30 June 13:30 45 138 410 0.76 0.88 0.69 2.20
VI 30 June 19:30 45 126 420 0.53 0.59 0.56 0.50
VII 1 July 11:45 30 24 330 0.53 0.56 0.52 1.76
VIII 1 July 14:00 30 37 410 0.60 0.62 0.54 2.51
Figure 5. (a) Time series of V–Fe–Ni particles (same as Fig. 3e). (b) Yellow area: the ion yield of HSO−
4 normalized to the particle number
per 10 min reveals coinciding sulfate events for some of the V–Fe–Ni features. The majority of sulfate is detected on the V–Fe–Ni particles
themselves (brown area). Most of these particles belong to cluster 183 in Fig. 4.
sible source regions of V–Fe–Ni particles: the main ship- A and B), being equipped with scrubbers and using batter-
ping lane (Kadet channel, > 50 000 passages per year), about ies for in-port manoeuvring. The diesel engines are started at
40 km north of the sampling site, and the harbor of Ros- the harbor exit, directly east of the meteorological station and
tock (≈ 7000 approaches, 75 % ferries and roll-on-roll-off 12 km north of the measurement site; see the enlarged view
ships), located about 10 km north of the site; see Fig. 6a. in Fig. 6a. On the way back, the engines are stopped at the
The complete Baltic Sea is a SECA, with a 0.1 % limit for same position. The typical turnaround times between two de-
sulfur in fuel mass. Several studies assessed the compliance partures are 2 h and 15 min, matching the delay between two
of ships to more than 95 % (International Transport Forum major transient events during afternoon on 28 and 30 June;
Policy Papers, 2016; Lähteenmäki-Uutela et al., 2019). Thus, see Fig. 4d.
it appears unlikely to detect many ship plumes from opera- For the period with northerly wind on 28 June, the times
tion with conventional high-sulfur bunker fuel within about when the ferries pass the harbor exit, where the engines are
36 h with northern wind in our study. However, an increas- typically started and stopped, are derived from AIS data; see
ing number of ships is currently equipped with scrubbers Fig. 6b. These passages of the harbor exit are followed by
(Winnes et al., 2018), efficiently removing SO2 from the ex- strong events of particles from the transient group with a de-
haust with moderate effects on the PM emissions (Fridell and lay of 45–60 min, in agreement with the wind speed of about
Salo, 2016; Lehtoranta et al., 2019). Several ships with scrub- 4 m s−1 . There was a further ferry “C” with a scrubber (no
bers regularly approach the port of Rostock. The ferry route hybrid), approaching Rostock around 12:45 and leaving the
to Denmark is operated with a pair of hybrid ferries (ferry port at 14:30, whose signals interfere with ferries A and B.
Atmos. Meas. Tech., 14, 4171–4185, 2021 https://doi.org/10.5194/amt-14-4171-2021J. Passig et al.: Detection of ship plumes from residual fuel operation using SPMS 4179 Figure 6. Assignment of transient particle events to distant ship passages. (a) For the first transients, observed on 28 June during a period of northern wind, the HYSPLIT trajectories indicate transport of particles from distant sea areas to the sampling site (star). However, the measured wind directions (blue arrows) in conjunction with ship transponder data reveal ferries with scrubbers as the probable source. (b) Time series of particles from the transient group during northern winds on 28 June. The particle events follow the approach and departure times of the ferries (arrows) with a delay of about 45 min during optimum wind directions. (c) On 29 June, the wind direction is north- northeast, and only one weak transient event appears (see Fig. 4). However, a broader feature of aged V–Fe–Ni particles at 15:00 indicates a distant source, and ferry C is underway in the Kadet channel in the respective time frame (and six further ships). The difference between trajectories and measured wind data emphasizes the importance of accurate meteorological data in potential future monitoring systems. For earlier and later departures and arrivals, the wind direc- wind data, the group of transient particle events on 28 June tion was unfavorable on this day. is in agreement with AIS data from the ferries. From the HYSPLIT back trajectories, shown by the red On the next day (29 June), there is no transient feature and blue lines in Fig. 6a, it appears unlikely that the V–Fe–Ni of comparable intensity, because the wind turned rapidly to particle transients stem from the harbor area, as they indicate northeast. However, a broader event lasting about 1 h around distant source regions further east. However, there is sub- 15:00 can be noticed for particles of cluster 111 (Fig. 4). This stantial difference between the trajectories and the measured cluster shows a different chemical profile, with solely sulfate wind data; see blue arrows in Fig. 6. Using the measured in negative mode and marginal signals of EC, OC and alkali https://doi.org/10.5194/amt-14-4171-2021 Atmos. Meas. Tech., 14, 4171–4185, 2021
4180                                     J. Passig et al.: Detection of ship plumes from residual fuel operation using SPMS

metals in positive mode, which we associated with ageing           tion oil contains metals from previous residual fuel operation
and a more distant source; see Sect. 3.3. Both the trajectories    that can consequently be emitted in small amounts also dur-
as well as the measured wind data shown in Fig. 6c reveal          ing operation in SECAs, as shown by our measurements on a
a northeasterly direction, guiding air masses from the east-       research ship engine; see the Supplement. Recently, Zanatta
ern Kadet channel to the site. Among six cargo ships, ferry C      et al. (2020) also found a limited number of V–Fe particles in
passed this stretch between 12:30 and 14:00 on its way from        the marine boundary layer along ship lanes in the Baltic Sea
a different harbor to Sweden. This ferry is also equipped with     using an aircraft-based SPMS.
a scrubber and therefore legally operated with heavy fuel oil,        Our analysis of AIS data revealed that a total number of
contributing a possible source of the detected V–Fe–Ni par-        470 cargo ships, tankers and passenger ships of all sizes were
ticles. Its position at 13:00 is indicated in Fig. 6c, while the   sailing the major ship lane during our measurement period.
hybrid ferries A and B were in the harbor (engines off) in         It should be noted that the ships running on distillate fuels
the relevant time between 14:00 and 15.00 and can therefore        such as MGO cannot be separated from other fuel combus-
be excluded as a source. Therefore, it appears likely that the     tion sources by our approach. Considering the typical com-
event of cluster 111 on 29 June at 15:00 results from regional     pliance rate and the small number of ships with scrubbers,
transport from the Kadet channel (> 30 km distance). In con-       it can be estimated that less than 10 % of the particles from
junction with the strong transient signals from 28 June, this      ships are V–Fe–Ni particles. Consequently, a substantial frac-
suggests that long-range detection of residual fuel operation      tion of the EC–OC particles may also stem from ships, which
might be possible if the wind field is captured correctly and      is supported by the increased number of EC–OC particles
if the traffic is not too dense.                                   during onshore winds; see Fig. 3.
    On 30 June, during straight northerly winds, Fig. 4d shows
several transient V–Fe–Ni particle events, including a small
dual-peak pattern for cluster 110 with 2 h 15 min delay,           4   Conclusions
matching AIS-derived departures of ferries A and B, respec-
tively. The time series of sulfate signals in Fig. 5b reveals a    With the present study, we demonstrated the chemical de-
strong increase that is mainly contributed by particles from       tection of individual ship plumes from more than 10 km dis-
cluster 183; compare Fig. 4. The event coincides with de-          tance. It could be shown that ships with installed scrubbers
parture of ferry A and may be associated with scrubber mal-        can also be detected by their PM emissions, indicating that
function or delayed onset of its operation. High sulfate emis-     the emissions of toxic transition metals from residual fuel
sions from ships with installed scrubbers have previously          combustion are not sufficiently abated by scrubbers. This
been reported (Mellqvist et al., 2017b, a). However, a dif-        emphasizes the need for additional cleaning technologies
ferent source, such as a further passing ship, cannot be ex-       and cleaner fuels. By using chemical indicators on a single-
cluded.                                                            particle basis for the presence of ship plumes, we extended
    The background particle signals can be associated with         the approach to perform stationary measurements at some
general ship traffic, which is also supported by their increase    distance downwind of shipping lanes (Ausmeel et al., 2019;
during wind from the western Baltic Sea and the North Sea.         Celik et al., 2020). Of note, this renders the method indepen-
The high levels at the beginning of the measurements fol-          dent of background aerosols as long as source-specific and
lowed a period of air mass stagnation in the western Baltic        detectable markers exist. We analyzed mass spectral signa-
Sea, where emissions have probably been enriched. Ships            tures for ageing of particles from residual fuel combustion
can emit V–Fe–Ni particles for three reasons: (I) under op-        and recommend considering the suppression of positive ions
eration with residual fuels by using scrubbers or (II) if non-     apart from transition metals as an additional ageing indicator
compliant fuels or (III) desulfurized hybrid fuels are used.       for this particle class. Our results furthermore suggest that
Antturi et al. (2016) estimated that only 136 of about 5000        the signal ratio between transition metals is not a suitable
ships sailing in the Baltic Sea had installed a scrubber, and      marker for individual ship assignment with SPMS.
the large majority of ships use distillate fuels such as MGO.         From analysis of transient particle events, wind data and
Therefore, a further source is conceivable: as shown in Fig. 4,    ship transponder signals, it becomes apparent that accuracy
all particle clusters that belong to the transient group show      in wind data, possible mixing of different plumes during high
calcium signals from lubrication oil. While the size dis-          traffic and prevailing wind directions are key limiting factors
tribution of freshly emitted soot particles from diesel en-        rather than chemical detection limits or background air pollu-
gines peaks well below 100 nm (Streibel et al., 2017; Oeder        tion. Consequently, SPMS-based monitoring systems should
et al., 2015), the majority of particles in the accumulation       acquire local wind data, and small-scale plume dispersion
modes show signatures of lube oil (Lyyränen et al., 1999;          models should be integrated (Matthias et al., 2018; Badeke et
Sakurai et al., 2003; Toner et al., 2006). Because many ships      al., 2021). The possible operation time is mainly limited by
run on residual fuels outside the SECAs and switch to low-         the prevailing wind directions, which should be perpendicu-
sulfur distillates when entering them (Van Roy and Schelde-        lar to the ship lane to avoid plume mixing and straight to the
mann, 2016; Lähteenmäki-Uutela et al., 2019), their lubrica-       monitoring site. However, this limitation can be overcome by

Atmos. Meas. Tech., 14, 4171–4185, 2021                                             https://doi.org/10.5194/amt-14-4171-2021
J. Passig et al.: Detection of ship plumes from residual fuel operation using SPMS 4181
installation of two monitoring stations. Favorable places are health and Virtual Institute of Complex Molecular Systems in Envi-
opposite sides of straits covering the main wind directions, ronmental Health, HICE).
at islands near major shipping routes and waterways to large
ports. Mobile ship-based units could complement such mon-
itoring networks. Review statement. This paper was edited by Markus Rapp and re-
While our approach can detect ship plumes from resid- viewed by two anonymous referees.
ual fuel operation, it is not applicable for monitoring of ship
emissions from distillate fuels, because in its present form,
it does not unambiguously separate ships running on MGO References
from land-based traffic emissions. Novel markers for ship
emissions beyond the metal signatures have been identified, Antturi, J., Hänninen, O., Jalkanen, J.-P., Johansson, L., Prank, M.,
including source-specific signatures of polycyclic aromatic Sofiev, M., and Ollikainen, M.: Costs and benefits of low-sulphur
hydrocarbons (PAHs) (Czech et al., 2017a, b). Recent de- fuel standard for Baltic Sea shipping, J. Environ. Manag., 184,
velopments in SPMS allow us to acquire detailed PAH pro- 431–440, https://doi.org/10.1016/j.jenvman.2016.09.064, 2016.
files from individual particles (Passig et al., 2017; Schade et Arndt, J., Sciare, J., Mallet, M., Roberts, G. C., Marchand,
N., Sartelet, K., Sellegri, K., Dulac, F., Healy, R. M., and
al., 2019), and therefore they open a perspective towards a
Wenger, J. C.: Sources and mixing state of summertime back-
comprehensive monitoring protocol for ship emissions and ground aerosol in the north-western Mediterranean basin, At-
individual plumes. mos. Chem. Phys., 17, 6975–7001, https://doi.org/10.5194/acp-
17-6975-2017, 2017.
Ault, A. P., Moore, M. J., Furutani, H., and Prather, K. A.: Impact of
Data availability. Data are available on request from Johannes Pas- Emissions from the Los Angeles Port Region on San Diego Air
sig (johannes.passig@uni-rostock.de). Quality during Regional Transport Events, Environ. Sci. Tech-
nol., 43, 3500–3506, https://doi.org/10.1021/es8018918, 2009.
Ault, A. P., Gaston, C. I., Wang, Y., Dominguez, G., Thiemens,
Supplement. The supplement related to this article is available on- M. H., and Prather, K. A.: Characterization of the single par-
line at: https://doi.org/10.5194/amt-14-4171-2021-supplement. ticle mixing state of individual ship plume events measured at
the Port of Los Angeles, Environ. Sci. Technol., 44, 1954–1961,
https://doi.org/10.1021/es902985h, 2010.
Author contributions. JP designed the experiments, analyzed data, Ausmeel, S., Eriksson, A., Ahlberg, E., and Kristensson, A.: Meth-
prepared the figures and wrote the manuscript with contributions ods for identifying aged ship plumes and estimating contri-
from all the authors. JS and RI developed software and performed bution to aerosol exposure downwind of shipping lanes, At-
the experiments. LL, XL and ZZ provided the SPMS instrument. mos. Meas. Tech., 12, 4479–4493, https://doi.org/10.5194/amt-
TA and RZ assisted with technical support, data interpretation and 12-4479-2019, 2019.
manuscript writing. Ausmeel, S., Eriksson, A., Ahlberg, E., Sporre, M. K., Spanne, M.,
and Kristensson, A.: Ship plumes in the Baltic Sea Sulfur Emis-
sion Control Area: chemical characterization and contribution to
Competing interests. The authors declare that they have no conflict coastal aerosol concentrations, Atmos. Chem. Phys., 20, 9135–
of interest. 9151, https://doi.org/10.5194/acp-20-9135-2020, 2020.
Badeke, R., Matthias, V., and Grawe, D.: Parameterizing the verti-
cal downward dispersion of ship exhaust gas in the near field, At-
mos. Chem. Phys., 21, 5935–5951, https://doi.org/10.5194/acp-
Acknowledgements. Instrumental and technical support was pro-
21-5935-2021, 2021.
vided by Photonion GmbH, Schwerin, Germany. We thank the
Balzani Lööv, J. M., Alfoldy, B., Gast, L. F. L., Hjorth, J., Lagler,
German Federal Waterways and Shipping Administration for pro-
F., Mellqvist, J., Beecken, J., Berg, N., Duyzer, J., Westrate, H.,
viding AIS data, Germany’s National Meteorological Service
Swart, D. P. J., Berkhout, A. J. C., Jalkanen, J.-P., Prata, A. J., van
“Deutscher Wetterdienst” for wind data and the State Agency for
der Hoff, G. R., and Borowiak, A.: Field test of available methods
the Environment, Nature Conservation and Geology Mecklenburg-
to measure remotely SOx and NOx emissions from ships, Atmos.
Vorpommern for PM2.5 data. The authors are grateful for the
Meas. Tech., 7, 2597–2613, https://doi.org/10.5194/amt-7-2597-
NOAA Air Resources Laboratory (ARL) for the provision of the
2014, 2014.
HYSPLIT transport and dispersion model and READY website
Beecken, J., Mellqvist, J., Salo, K., Ekholm, J., and Jalkanen, J.-
(https://www.ready.noaa.gov, last access: 20 November 2020) used
P.: Airborne emission measurements of SO2 , NOx and particles
in this publication.
from individual ships using a sniffer technique, Atmos. Meas.
Tech., 7, 1957–1968, https://doi.org/10.5194/amt-7-1957-2014,
2014.
Financial support. This research has been supported by the Berg, N., Mellqvist, J., Jalkanen, J.-P., and Balzani, J.: Ship
Deutsche Forschungsgemeinschaft (grant no. ZI 764/6-1), the Bun- emissions of SO2 and NO2 : DOAS measurements from
desministerium für Wirtschaft und Energie (grant no. ZF4402101 airborne platforms, Atmos. Meas. Tech., 5, 1085–1098,
ZG7), and the Helmholtz-Gemeinschaft (International Lab Aero- https://doi.org/10.5194/amt-5-1085-2012, 2012.
https://doi.org/10.5194/amt-14-4171-2021 Atmos. Meas. Tech., 14, 4171–4185, 20214182 J. Passig et al.: Detection of ship plumes from residual fuel operation using SPMS Celik, S., Drewnick, F., Fachinger, F., Brooks, J., Darbyshire, Fuel and Diesel Oil Combustion in a Typical Container Ship: E., Coe, H., Paris, J.-D., Eger, P. G., Schuladen, J., Tadic, I., Characteristics and Toxicity, Environ. Sci. Technol., 52, 12943– Friedrich, N., Dienhart, D., Hottmann, B., Fischer, H., Crow- 12951, https://doi.org/10.1021/acs.est.8b04471, 2018. ley, J. N., Harder, H., and Borrmann, S.: Influence of vessel Diesch, J.-M., Drewnick, F., Klimach, T., and Borrmann, S.: In- characteristics and atmospheric processes on the gas and par- vestigation of gaseous and particulate emissions from vari- ticle phase of ship emission plumes: in situ measurements in ous marine vessel types measured on the banks of the Elbe the Mediterranean Sea and around the Arabian Peninsula, At- in Northern Germany, Atmos. Chem. Phys., 13, 3603–3618, mos. Chem. Phys., 20, 4713–4734, https://doi.org/10.5194/acp- https://doi.org/10.5194/acp-13-3603-2013, 2013. 20-4713-2020, 2020. Eyring, V., Isaksen, I. S., Berntsen, T., Collins, W. J., Cor- Celo, V., Dabek-Zlotorzynska, E., and McCurdy, M.: Chem- bett, J. J., Endresen, O., Grainger, R. G., Moldanova, J., ical Characterization of Exhaust Emissions from Selected Schlager, H., and Stevenson, D. S.: Transport impacts on atmo- Canadian Marine Vessels: The Case of Trace Metals sphere and climate: Shipping, Atmos. Environ., 44, 4735–4771, and Lanthanoids, Environ. Sci. Technol., 49, 5220–5226, https://doi.org/10.1016/j.atmosenv.2009.04.059, 2010. https://doi.org/10.1021/acs.est.5b00127, 2015. Fang, T., Guo, H., Zeng, L., Verma, V., Nenes, A., and We- Chen, G., Huey, L. G., Trainer, M., Nicks, D., Corbett, J., Ryerson, ber, R. J.: Highly Acidic Ambient Particles, Soluble Met- T., Parrish, D., Neuman, J. A. Nowak, J., Tanner, D., Holloway, als, and Oxidative Potential: A Link between Sulfate and J., Brock, C., Crawford, J., Olson, J. R., Sullivan, A., Weber, Aerosol Toxicity, Environ. Sci. Technol., 51, 2611–2620, R., Schauffler, S., Donnelly, S., Atlas, E., Roberts, J., Flocke, F., https://doi.org/10.1021/acs.est.6b06151, 2017. Hübler, G., and Fehsenfeld, F.: An investigation of the chemistry Fridell, E. and Salo, K.: Measurements of abatement of of ship emission plumes during ITCT 2002, J. Geophys. Res., particles and exhaust gases in a marine gas scrub- 110, D10S90, https://doi.org/10.1029/2004JD005236, 2005. ber, Proceedings of the IMechE, 230, 154–162, Corbett, J. J., Winebrake, J. J., Green, E. H., Kasibhatla, P., https://doi.org/10.1177/1475090214543716, 2016. Eyring, V., and Lauer, A.: Mortality from Ship Emissions: Furutani, H., Jung, J., Miura, K., Takami, A., Kato, S., Kajii, A Global Assessment, Environ. Sci. Technol., 41, 8512–8518, Y., and Uematsu, M.: Single-particle chemical characteriza- https://doi.org/10.1021/es071686z, 2007. tion and source apportionment of iron-containing atmospheric Corbin, J. C., Mensah, A. A., Pieber, S. M., Orasche, J., Michalke, aerosols in Asian outflow, J. Geophys. Res., 116, D18204, B., Zanatta, M., Czech, H., Massabò, D., Buatier de Mongeot, https://doi.org/10.1029/2011JD015867, 2011. F., Mennucci, C., El Haddad, I., Kumar, N. K., Stengel, B., Gaie-Levrel, F., Perrier, S., Perraudin, E., Stoll, C., Grand, N., Huang, Y., Zimmermann, R., Prévôt, A. S. H., and Gysel, M.: and Schwell, M.: Development and characterization of a sin- Trace Metals in Soot and PM2.5 from Heavy-Fuel-Oil Combus- gle particle laser ablation mass spectrometer (SPLAM) for tion in a Marine Engine, Environ. Sci. Technol., 52, 6714–6722, organic aerosol studies, Atmos. Meas. Tech., 5, 225–241, https://doi.org/10.1021/acs.est.8b01764, 2018. https://doi.org/10.5194/amt-5-225-2012, 2012. Corbin, J. C., Czech, H., Massabò, D., Mongeot, F. B. de, Jakobi, Gaston, C. J., Quinn, P. K., Bates, T. S., Gilman, J. B., Bon, D. M., G., Liu, F., Lobo, P., Mennucci, C., Mensah, A. A., Orasche, J., Kuster, W. C., and Prather, K. A.: The impact of shipping, agri- Pieber, S. M., Prévôt, A. S. H., Stengel, B., Tay, L.-L., Zanatta, cultural, and urban emissions on single particle chemistry ob- M., Zimmermann, R., El Haddad, I., and Gysel, M.: Infrared- served aboard the R/V Atlantis during CalNex, J. Geophys. Res., absorbing carbonaceous tar can dominate light absorption by 118, 5003–5017, https://doi.org/10.1002/jgrd.50427, 2013. marine-engine exhaust, npj Climate and Atmospheric Science, Hatch, L. E., Pratt, K. A., Huffman, J. A., Jimenez, J. 2, 12, https://doi.org/10.1038/s41612-019-0069-5, 2019. L., and Prather, K. A.: Impacts of Aerosol Aging on Czech, H., Schnelle-Kreis, J., Streibel, T., and Zimmer- Laser Desorption/Ionization in Single-Particle Mass mann, R.: New directions: Beyond sulphur, vanadium and Spectrometers, Aerosol Sci. Technol., 48, 1050–1058, nickel – About source apportionment of ship emissions in https://doi.org/10.1080/02786826.2014.955907, 2014. emission control areas, Atmos. Environ., 163, 190–191, Healy, R. M., O’Connor, I. P., Hellebust, S., Allanic, A., Sodeau, https://doi.org/10.1016/j.atmosenv.2017.05.017, 2017a. J. R., and Wenger, J. C.: Characterisation of single particles Czech, H., Stengel, B., Adam, T., Sklorz, M., Streibel, T., from in-port ship emissions, Atmos. Environ., 43, 6408–6414, and Zimmermann, R.: A chemometric investigation of aro- https://doi.org/10.1016/j.atmosenv.2009.07.039, 2009. matic emission profiles from a marine engine in compari- International Transport Forum Policy Papers: Reducing son with residential wood combustion and road traffic: Im- Sulphur Emissions from Ships: The Impact of Interna- plications for source apportionment inside and outside sul- tional Regulation, Organisation for Economic Coopera- phur emission control areas, Atmos. Environ., 167, 212–222, tion and Development (OECD) iLibrary, ISSN: 24108871, https://doi.org/10.1016/j.atmosenv.2017.08.022, 2017b. https://doi.org/10.1787/24108871, 2016. Dall’Osto, M., Harrison, R. M., Beddows, D. C. S., Freney, Jonson, J. E., Gauss, M., Jalkanen, J.-P., and Johansson, L.: Effects E. J., Heal, M. R., and Donovan, R. J.: Single-Particle of strengthening the Baltic Sea ECA regulations, Atmos. Chem. Detection Efficiencies of Aerosol Time-of-Flight Mass Phys., 19, 13469–13487, https://doi.org/10.5194/acp-19-13469- Spectrometry during the North Atlantic Marine Boundary 2019, 2019. Layer Experiment, Environ. Sci. Technol., 40, 5029–5035, Jonson, J. E., Gauss, M., Schulz, M., Jalkanen, J.-P., and https://doi.org/10.1021/es050951i, 2006. Fagerli, H.: Effects of global ship emissions on European Di Wu, Li, Q., Ding, X., Sun, J., Li, D., Fu, H., Teich, M., Ye, X., air pollution levels, Atmos. Chem. Phys., 20, 11399–11422, and Chen, J.: Primary Particulate Matter Emitted from Heavy https://doi.org/10.5194/acp-20-11399-2020, 2020. Atmos. Meas. Tech., 14, 4171–4185, 2021 https://doi.org/10.5194/amt-14-4171-2021
You can also read