Comparing modified substrate-induced respiration with selective inhibition (SIRIN) and N2O isotope approaches to estimate fungal contribution to ...
←
→
Page content transcription
If your browser does not render page correctly, please read the page content below
Biogeosciences, 18, 4629–4650, 2021
https://doi.org/10.5194/bg-18-4629-2021
© Author(s) 2021. This work is distributed under
the Creative Commons Attribution 4.0 License.

Comparing modified substrate-induced respiration with
selective inhibition (SIRIN) and N2O isotope approaches
to estimate fungal contribution to denitrification in
three arable soils under anoxic conditions
Lena Rohe1,2,3 , Traute-Heidi Anderson2 , Heinz Flessa2 , Anette Goeske2 , Dominika Lewicka-Szczebak2,4 ,
Nicole Wrage-Mönnig5 , and Reinhard Well2
1 Department   of Soil System Science, Helmholtz Centre for Environmental Research – UFZ, Theodor-Lieser Str. 4,
06120 Halle, Germany
2 Thünen Institute of Climate-Smart Agriculture, Bundesallee 65, 38116 Braunschweig, Germany
3 Department of Crop Sciences, Institute of Grassland Science, University of Göttingen, von-Siebold-Str. 8,

37075 Göttingen, Germany
4 Institute of Geological Sciences, University of Wrocław, pl. M. Borna 9, 50-204 Wrocław, Poland
5 Grassland and Fodder Sciences, Agricultural and Environmental Faculty, University of Rostock, Justus-Liebig-Weg 6,

18059 Rostock, Germany

Correspondence: Lena Rohe (lena.rohe@ufz.de)

Received: 22 July 2020 – Discussion started: 1 September 2020
Revised: 31 May 2021 – Accepted: 16 June 2021 – Published: 12 August 2021

Abstract. The coexistence of many N2 O production path-             estimate the effect of N2 O reduction on the N2 O produced,
ways in soil hampers differentiation of microbial pathways.         while two other variants were performed under natural iso-
The question of whether fungi are significant contributors to       topic conditions with and without acetylene.
soil emissions of the greenhouse gas nitrous oxide (N2 O)              All three approaches revealed a small contribution of fun-
from denitrification has not yet been resolved. Here, three         gal denitrification to N2 O fluxes (fFD ) under anaerobic con-
approaches to independently investigate the fungal fraction         ditions in the soils tested. Quantifying the fungal fraction
contributing to N2 O from denitrification were used simul-          with modified SIRIN was not successful due to large amounts
taneously for, as far as we know, the first time (modi-             of uninhibited N2 O production. In only one soil could fFD
fied substrate-induced respiration with selective inhibition        be estimated using modified SIRIN, and this resulted in
(SIRIN) approach and two isotopic approaches, i.e. end-             28 ± 9 %, which was possibly an overestimation, since re-
member mixing approach (IEM) using the 15 N site prefer-            sults obtained by IEM and SP/δ 18 O Map for this soil resulted
ence of N2 O produced (SPN2 O ) and the SP/δ 18 O mapping ap-       in fFD of below 15 % and 20 %, respectively. As a conse-
proach (SP/δ 18 O Map)). This enabled a comparison of meth-         quence of the unsuccessful SIRIN approach, estimation of
ods and a quantification of the importance of fungal denitri-       fungal SPN2 O values was impossible.
fication in soil.                                                      While all successful methods consistently suggested a
   Three soils were incubated in four treatments of the SIRIN       small or missing fungal contribution, further studies with
approach under anaerobic conditions to promote denitrifica-         stimulated fungal N2 O fluxes by adding fungal C substrates
tion. While one treatment without microbial inhibition served       and an improved modified SIRIN approach, including al-
as a control, the other three treatments were amended with          ternative inhibitors, are needed to better cross-validate the
inhibitors to selectively inhibit bacterial, fungal, or bacterial   methods.
and fungal growth. These treatments were performed in three
variants. In one variant, the 15 N tracer technique was used to

Published by Copernicus Publications on behalf of the European Geosciences Union.
4630                              L. Rohe et al.: Inhibitor and N2 O isotope approaches to investigate fungal denitrification

1   Introduction                                                     difficulties of this method may be to achieve complete in-
                                                                     hibition of selective groups (Ladan and Jacinthe, 2016) and
The greenhouse gas nitrous oxide (N2 O) contributes to               to avoid shifts in the structure of microbial communities as
global warming and to the depletion of the ozone layer in            a response to pre-incubation or the duration of experiments.
the stratosphere (Crutzen, 1970; IPCC, 2013). The largest            Another opportunity to distinguish between N2 O from bacte-
anthropogenic N2 O emissions originate from agricultural             rial and fungal denitrification and other pathways is the anal-
soils and are mainly produced during microbial nitrifica-            ysis of the isotopic composition of N2 O. Especially the iso-
tion, nitrifier denitrification and denitrification (Firestone       topomer ratios of N2 O (i.e. N2 O molecules with the same
and Davidson, 1989; Bremner, 1997; IPCC, 2013; Wrage-                bulk 15 N isotopic enrichment but different positions of 15 N in
Mönnig et al., 2018). In order to find mitigation strategies         the linear N2 O molecule; Ostrom and Ostrom, 2017) in pure
for N2 O emissions from arable soils, it is important to under-      culture studies showed differences in N2 O of bacterial and
stand N2 O sources and sinks and thus improve knowledge              fungal denitrification (Sutka et al., 2006, 2008; Frame and
about the production pathways and the microorganisms in-             Casciotti, 2010; Rohe et al., 2014a, 2017). Isotopomer ra-
volved.                                                              tios of N2 O can be expressed as 15 N site preference (SPN2 O ),
   Denitrification describes the stepwise reduction of nitrate       i.e. the difference between δ 15 N of the central and terminal
(NO−  3 ) to dinitrogen (N2 ), with the intermediates nitrite        N position of the asymmetric N2 O molecule (Toyoda and
(NO−  2 ), nitric oxide (NO) and N2 O (Knowles, 1982). For a         Yoshida, 1999). The SPN2 O values of N2 O of six pure fun-
long time, it was believed that solely bacteria are involved in      gal cultures was between 16 ‰ and 37 ‰ (Sutka et al., 2008;
N2 O formation during denitrification (Firestone and David-          Rohe et al., 2014a, 2017; Maeda et al., 2015), whereas sev-
son, 1989); however, several fungi are also capable of deni-         eral bacterial cultures produced N2 O with SPN2 O values be-
trification (Bollag and Tung, 1972; Shoun et al., 1992). Pure        tween −7.5 ‰ and +3.5 ‰ during denitrification (Toyoda
culture studies have indicated that although only some fun-          et al., 2005; Sutka et al., 2006; Rohe et al., 2017). While
gal species (e.g. Fusarium strains) are performing respira-          it is generally assumed that SPN2 O values of N2 O produced
tory denitrification, these may produce substantial amounts          by pure fungal cultures during denitrification are transferable
of N2 O (Higgins et al., 2018; Keuschnig et al., 2020). N2 O         to N2 O produced by fungal soil communities, this has not
produced by fungi may thus contribute largely to N2 O from           yet been proven. Until now, studies reporting possible ranges
denitrification in soil, since fungi dominate the biomass in         of fungal contributions to N2 O fluxes from soil have been
soil (up to 96 %) compared to bacteria in general (Ruzicka           based on SPN2 O values of pure cultures (Köster et al., 2013b;
et al., 2000; Braker and Conrad, 2011). A respiratory fungal-        Zou et al., 2014; Lewicka-Szczebak et al., 2017, 2014; Sen-
to-bacterial (F : B) ratio of 4 is typical of arable soils (Ander-   bayram et al., 2018, 2020), but uncertainty in this approach
son and Domsch, 1975; Blagodatskaya and Anderson, 1998).             has arisen from the large ranges of fungal SPN2 O values
Secondly, due to a lacking N2 O reductase (Nos) (Shoun et al.,       (Sutka et al., 2008; Maeda et al., 2015; Rohe et al., 2017).
1992, 2012; Higgins et al., 2018), N2 O is the major end             It would thus be useful to constrain fungal SPN2 O values for
product of fungal denitrification. However, although there are       a specific soil or soil type.
methodological approaches to disentangling sources of N2 O,              The SPN2 O value of N2 O produced by pure bacterial cul-
it is still challenging to clearly attribute N2 O emitted from       tures during nitrification is approximately 33 ‰ and thus in-
soil to bacterial or fungal denitrification.                         terferes with that of fungal denitrification (Sutka et al., 2006,
   One approach to differentiate between N2 O produced by            2008; Rohe et al., 2014a). This demonstrates the difficulty
fungi and bacteria during denitrification comprises the ad-          of using solely SPN2 O values as an indicator for different
dition of two antibiotics to soil incubation experiments,            organism groups contributing to N2 O production from soil,
i.e. streptomycin and cycloheximide to inhibit bacterial or          where different pathways may co-occur. Based on the above-
fungal protein biosynthesis, i.e. growth, respectively. This         cited ranges for the isotopomer end-members of fungal and
method is known as substrate-induced respiration with se-            bacterial denitrification and assuming that only fungal and
lective inhibition (SIRIN) and was originally developed to           bacterial denitrification are responsible for N2 O production,
determine the bacterial or fungal contribution to CO2 respi-         the fraction of fungal N2 O can be calculated using the iso-
ration (Anderson and Domsch, 1975). A few studies used a             tope end-member mixing approach (IEM) with SPN2 O values
modification of this method for N2 O analysis (Laughlin and          of N2 O produced in soil (SPprod ), provided N2 O reduction
Stevens, 2002; Crenshaw et al., 2008; Blagodatskaya et al.,          does not occur (Ostrom et al., 2010; Ostrom and Ostrom,
2010; Long et al., 2013) and found a greater decrease in             2011). If there is a N2 O reduction, SPN2 O and also δ 15 N
N2 O production with fungal than with bacterial growth in-           and δ 18 O values of produced N2 O (δ 15 Nbulk          18
                                                                                                                  N2 O and δ ON2 O ,
hibition (i.e. 89 % vs. 23 % decrease, respectively; Laughlin        respectively) are affected by isotopic fractionation (Ostrom
and Stevens, 2002). This indicated that fungi might dominate         et al., 2007; Ostrom and Ostrom, 2011). This means that the
N2 O production (Laughlin and Stevens, 2002; McLain and              14 N16 O bond of N O is preferentially broken compared to
                                                                                          2
Martens, 2006; Crenshaw et al., 2008; Blagodatskaya et al.,          14 N18 O or 15 N16 O, resulting in N O that is isotopically en-
                                                                                                          2
2010; Long et al., 2013; Chen et al., 2014, 2015). However,          riched in 15 N and 18 O and shows larger SPN2 O values com-

Biogeosciences, 18, 4629–4650, 2021                                                     https://doi.org/10.5194/bg-18-4629-2021
L. Rohe et al.: Inhibitor and N2 O isotope approaches to investigate fungal denitrification 4631
pared to N2 O from denitrification without the reduction step in the same soil, and their accuracy and possible bias re-
(Popp et al., 2002; Ostrom et al., 2007). main unknown. A better knowledge of the comparability of
In controlled laboratory experiments, the N2 O reduction the methods would enable comparison of results of studies
to N2 can be inhibited using acetylene (C2 H2 ) during anaer- using different methods and thus further improve our under-
obic incubation experiments (Yoshinari and Knowles, 1976; standing of processes of N2 O production. It would also reveal
Groffman et al., 2006; Well and Flessa, 2009; Nadeem et al., weaknesses of approaches and might lead to the development
2013). Hence, C2 H2 inhibition might be suitable to quantify of better methods.
SPprod values in soils exhibiting significant N2 O reduction Therefore, this study aims at (i) determining the fun-
and would thus allow quantification of fungal N2 O fluxes gal contribution to N2 O production by denitrification under
based on SPprod values. However, problems due to incom- anoxic conditions and glucose addition using three arable
plete inhibition of N2 O reduction and unwanted inhibition soils and three approaches (modified SIRIN, IEM and the
of other pathways may occur (Wrage et al., 2004a, b). An- SP/δ 18 O Map) and to assess their usefulness in soil stud-
other possibility of quantifying N2 O reduction to N2 dur- ies and thus assess factors of potential bias of the meth-
ing denitrification is also possible with 15 N-tracing exper- ods and (ii) estimating the SPN2 O values from fungal soil
iments using 15 N-enriched substrates and analysing 15 N2 communities and thus evaluating the transferability of the
fluxes (Well et al., 2006; Lewicka-Szczebak et al., 2014). pure culture range of the fungal SPN2 O end-member val-
The 15 N tracer approach also enables us to distinguish be- ues. We hypothesized that the fungal fraction contributing
tween N2 O from fungal denitrification and co-denitrification; to N2 O from denitrification in different soils using a modi-
i.e. a hybrid N2 O is formed using one N atom from NO− 2 fied SIRIN approach and isotopic methods will be correlated
and one N atom from compounds like azide or ammonium but not exactly matched due to limited inhibitability of mi-
(NH+ 4 ) for N2 O production (Tanimoto et al., 1992; Laughlin crobial communities and variability in SPN2 O end-member
and Stevens, 2002; Rohe et al., 2017; Spott et al., 2011). values. Furthermore, successful application of the modified
N2 O reduction can be quantified using N2 O natural abun- SIRIN approach with the determined fungal fraction con-
dance isotopic signatures, which also enables simultaneous tributing to N2 O from denitrification will yield fungal SPN2 O
differentiation of selected pathways. Here, the isotope map- end-member values within the range of values previously re-
ping approach uses isotope fractionation factors together ported in the literature.
with δ 15 N values of precursors (δ 15 NNOx ) as well as δ 15 Nbulk
N2 O
and SPN2 O values of N2 O produced (Toyoda et al., 2011). Re-
cently, this isotope mapping approach was further developed 2 Materials and methods
(SP/δ 18 O Map) using δ 18 ON2 O and SPN2 O values and δ 18 O
values of precursors (Lewicka-Szczebak et al., 2017) and dif- 2.1 Soil samples
ferent slopes of N2 O reduction and mixing lines in the δ 18 O–
SP isotope plot. While SPN2 O values are independent of iso- All experiments were conducted with three arable soils dif-
topic signatures of the precursors, δ 15 Nbulk 18
N2 O and δ ON2 O re- fering in texture, Corg content, C / N ratio and pH. Thus
sult from the isotopic signature of the precursor and isotopic it was assumed that the soils harbour different denitrifying
fractionation during N2 O production (Toyoda et al., 2005; communities, i.e. different fractions of bacteria and fungi
Frame and Casciotti, 2010). Regarding δ 18 ON2 O , a complete contributing to denitrification. One of the soils was sampled
exchange of oxygen (O) between NO− 3 and soil water can during a second season to evaluate if the fungal fraction con-
be assumed, and consequently, one can use the δ 18 O val- tributing to N2 O production is soil-specific or can be subject
ues of soil water for interpretation of δ 18 ON2 O values (Kool to seasonal change in microbial communities. As this soil
et al., 2009; Snider et al., 2009; Lewicka-Szczebak et al., was sampled at two different time points, we conducted four
2016). However, interpretation of δ 18 ON2 O values from dif- experiments and named the different experiments “Soil 1.1”,
ferent microbial groups may be more complex due to incom- “Soil 1.2”, “Soil 2” and “Soil 3”: Soil 1.1 and Soil 1.2 with
plete O exchange because variations in the extent of O ex- loamy sand (Soil 1) sampled in June 2011 and in Decem-
change between water and N oxides affect the final δ 18 ON2 O ber 2012, respectively; Soil 2 with sand sampled in January
value (Garber and Hollocher, 1982; Aerssens et al., 1986; 2013; and Soil 3 with silt loam sampled in December 2012
Kool et al., 2007; Rohe et al., 2014b, 2017). Importantly, fun- (Table 1).
gal and bacterial N2 O showed different ranges for δ 18 ON2 O Soil samples of the upper 30 cm were collected in plastic
values; hence this isotopic signature may also be helpful in bags aerated via cotton wool stoppers and stored at 6 ◦ C for
differentiation of these pathways (Lewicka-Szczebak et al., maximally 2 months. To obtain information about the initial
2016). This SP/δ 18 O Map approach thus allows for an esti- soil status, the mineral nitrogen content (Nmin ) of soil sam-
mation of the contributions of N2 O reduction and admixture ples was determined before and after fertilization by extract-
of fungal N2 O. ing NO− +
3 and NH4 with 0.01 M calcium chloride dihydrate
So far, the described methods for distinguishing between (CaCl2 · 2 H2 O) according to ISO 14255 and analysing NO− 3
fungal and bacterial N2 O emission have not been compared and NH+ 4 concentrations in the extracts with a continuous-
https://doi.org/10.5194/bg-18-4629-2021 Biogeosciences, 18, 4629–4650, 20214632 L. Rohe et al.: Inhibitor and N2 O isotope approaches to investigate fungal denitrification
Table 1. Soil characteristics of three arable soils from Germany used for incubation experiments (Soil) (standard deviation in brackets).
Except for NH+ − 15 18
4 and NO3 , soil characteristics (C, N, pH, δ NNOx and δ ONOx ) of loamy sand were only analysed once for samples
collected in 2012. WRB: World Reference Base for Soil Resources.
Soil Soil Soil type Location C content N content NH+4 NO−3 pH δ 15 NNOx δ 18 ONOx F : Bf Biomassg
(Year) texture (WRB) [%] [%] [mg N kg−1 ] [mg N kg−1 ] (CaCl2 ) [‰]e [‰]e [µg C g−1 dw
soil]
1.1 Loamy Haplic Braunschweiga – – 1.0 11.0 – – – 2.6 234
(2011) sand Luvisol (0.4) (0.3)
1.2 1.43 0.10 0.4 14.1 5.67 3.98 −4.82 – –
(2012) (< 0.01) (< 0.01) (< 0.1) (2.1)
2 Sand Gleyic Wennebostelb 2.31 0.14 1.9 (0.2) 6.6 (0.2) 5.54 0.73 −2.68 2.6 161
(2013) Podzol (0.04) (< 0.01)
3 Silt Haplic Göttingenc 1.62 0.13 n.d.d 22.7 7.38 4.18 2.32 4.9 389
(2013) loam Luvisol (0.02) (< 0.01) (< 0.1)
a Experimental station of the Friedrich-Löffler Institute, Braunschweig, Germany. b Private agricultural field north of Hanover, water protection area Fuhrberger Feld, Germany. c Reinshof Experimental Farm, University of
Göttingen, Göttingen, Germany. d Not detectable (i.e. below detection limit of 0.06 mg kg−1 of NH+ e − f
4 -N). Isotopic values of natural soil NO3 using the denitrifier method (Casciotti et al., 2002). Respiratory
fungal-to-bacterial (F : B ) ratio analysed by SIRIN method (Anderson and Domsch, 1973, 1975) in a pre-experiment in 2010. g Respiratory biomass analysed by CO2 production from substrate-induced respiration (SIR)
method (Anderson and Domsch, 1978) in a pre-experiment in 2010.
flow analyser (Skalar, Germany) directly after sample col- mation about optimal substrate and inhibitor concentrations
lection. Other soil characteristics (C and N content, soil pH for substrate-induced respiration with growth inhibition. The
value, isotopic values of soil NO− −
3 and NO2 ) were anal- pre-experiments of the present study were conducted in two
ysed with samples of Soil 1.2, Soil 2 and Soil 3. Total con- steps as described in the original methods, i.e. CO2 pro-
tents of C and N in soil samples were analysed by dry com- duction under oxic conditions was analysed to estimate the
bustion of ground samples (LECO TruSpec, Germany). The substrate-induced respiration by the SIR method (Anderson
soil pH was measured in 0.01 M CaCl2 . The δ 15 N and δ 18 O and Domsch, 1978) and the substrate-induced respiration
values of NO− − 15 18
3 and NO2 (δ NNOx and δ ONOx , respec- with selective inhibition by the SIRIN method (Anderson and
tively) in soil extracts (with 0.01 M calcium chloride dihy- Domsch, 1975), as follows.
drate; CaCl2 · 2 H2 O) were analysed by the bacterial denitri- In a first pre-experiment (Fig. 1), the SIR method (An-
fier method (Casciotti et al., 2002) (Table 1). derson and Domsch, 1978) was used to obtain information
The three soils were also sampled in summer 2010 for pre- about the amount of respiratory biomass in soil under oxic
experiments to gain information on the respiratory biomass conditions. In this pre-experiment glucose served as sub-
by analysing the substrate-induced respiration (SIR) ac- strate to initiate microbial growth (Anderson and Domsch,
cording to Anderson and Domsch (1978), and the respira- 1975). To this end, we added different concentrations of
tory F : B ratio was analysed with substrate-induced res- glucose (0.50, 0.75, 1.0, 1.5, 2.0, 3.0, 4.0, 5.0, 6.0 mg g−1
piration with selective inhibition (SIRIN) by a computer- dry weight (dw) soil) to find the optimal glucose concentra-
generated selectivity analysis: SIR-SBA 4.00 (Heinemeyer, tion (copt (glucose)), which is the glucose concentration that
copyright MasCo Analytik, Hildesheim, Germany) (Ander- causes maximum initial respiration rates by analysing CO2
son and Domsch, 1975) (Table 1). The scheme of glucose and production (Anderson and Domsch, 1978). copt (glucose) was
growth inhibitor combinations is listed below in Sect. 2.2. 1.0 mg g−1 for Soil 2 (sand) and 1.5 mg g−1 for soils 1 and 3
The characteristics of the soils are listed in Table 1. (loamy sand and silt loam).
In a second pre-experiment (Fig. 1), the SIRIN method
2.2 Methodical approach was used according to Anderson and Domsch (1975) for de-
termining the respiratory F : B ratio. The copt (glucose) de-
The experimental setup comprising pre-experiments, four termined in the first pre-experiment was used, while selectiv-
treatments in three variants and measured parameters is pre- ity of the inhibitor combinations of streptomycin (bacterial
sented in the following sections and illustrated in Fig. 1. Im- respiratory inhibitor) and cycloheximide (fungal respiratory
portant terms used and their descriptions are listed in Ta- inhibitor) was tested with three concentrations (0.75, 1.0,
ble S1 in the Supplement. 1.5 mg g−1 dw, respectively). The optimal concentration for
inhibition of fungal respiration was 0.75 mg g−1 dw soil of
2.2.1 SIRIN pre-experiment cycloheximide (copt (cycloheximide)), and for bacterial res-
piratory inhibition it was 1.0 mg g−1 dw soil of streptomycin
As in most studies applying the SIRIN method to N2 O emis- (copt (streptomycin)). As in the first pre-experiment, CO2 pro-
sions (e.g. Laughlin and Stevens, 2002; Chen et al., 2014; duction under oxic conditions was analysed. The determined
Ladan and Jacinthe, 2016), a pre-experiment was conducted optimal concentrations of glucose, streptomycin and cyclo-
with samples collected in 2010 in order to obtain infor-
Biogeosciences, 18, 4629–4650, 2021 https://doi.org/10.5194/bg-18-4629-2021L. Rohe et al.: Inhibitor and N2 O isotope approaches to investigate fungal denitrification 4633
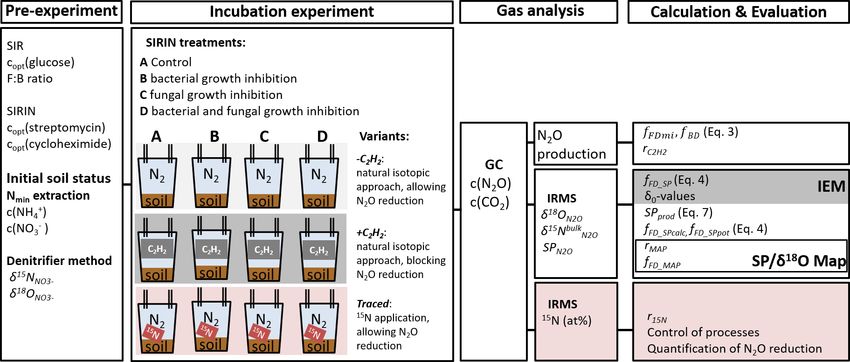
Figure 1. The methodical approach comprised a pre-experiment with substrate-induced respiration (SIR) to estimate the optimal glucose
concentration (copt (glucose)) and the fungal-to-bacterial ratio in the soil (F : B ratio) and the substrate-induced respiration with selective
inhibition approach (SIRIN) to determine the optimal inhibitor concentration (copt (streptomycin and copt (cycloheximide)). The initial soil
status, i.e. ammonium and nitrate concentration of the soil (c(NH+ −
4 ) and c(NO3 ), respectively), was measured in Nmin extracts, and the
−
isotopic signature of soil NO3 was analysed by the denitrifier method. The incubation experiment comprised the SIRIN approach with three
experimental variants: without acetylene (−C2 H2 ), with C2 H2 (+C2 H2 ) and without C2 H2 but with 15 N labelled NO− 3 (traced), while NO3
−
with natural isotopic composition was added to the other two variants. Produced gas was analysed for its concentration (c(CO2 ) and c(N2 O))
using gas chromatography (GC), and N2 O was further analysed by isotope ratio mass spectrometry (IRMS) for its isotopic composition.
Please refer to Sect. 2 for more information.
heximide were used in the modified SIRIN approach, on the A. control, without growth inhibitors;
assumption that concentrations optimal for CO2 respiration
also allow denitrification. Examples of respiration curves de- B. with streptomycin sulfate (C42 H84 N14 O36 S3 ) to inhibit
rived from SIR and SIRIN pre-experiments are represented bacterial growth;
in Figs. S1 and S2 in the Supplement, respectively.
C. with cycloheximide (C15 H23 NO4 ) to inhibit fungal
growth;
2.2.2 Soil incubation with selective inhibition to
determine N2 O-forming processes D. with streptomycin and cycloheximide, to inhibit bacte-
rial and fungal growth.
The experimental design included two approaches, (i) mi-
crobial inhibition by fungal and/or bacterial inhibitors and To address the other approach (ii), all microbial inhibitor
(ii) activity of N2 O reductase analysed by either inhibi- treatments were conducted in three variants, i.e.: with 15 N-
tion with C2 H2 or quantification by 15 N tracing (Fig. 1). NO3 fertilizer (variant “traced”) to quantify N2 O reduction
To address the microbial inhibition approach (i), the SIRIN to N2 ; with natural abundance NO− 3 and 10 kPa C2 H2 in the
method for determination of the respiratory F : B ratio based headspace (variant “+C2 H2 ”) to block N2 O reductase; and
on CO2 emission was modified to determine N2 O production with natural abundance NO− 3 but without blocking N2 O re-
by microbial groups. However, in contrast to previous stud- ductase, i.e. no C2 H2 added (variant “−C2 H2 ”) (Fig. 1). In
ies by Laughlin and Stevens (2002), McLain and Martens total, there were 48 experimental treatments and 144 vessels
(2006), Blagodatskaya et al. (2010), and Long et al. (2013), (four soils with four inhibitor treatments (A, B, C, D) and
we did not pre-incubate the soil with the growth inhibitors, as three variants (traced, +C2 H2 and −C2 H2 ), each in tripli-
this could result in changes in the microbial community (e.g. cate).
preferential growth of selected organisms). We intended to The soil was adjusted to 80 % water-filled pore space
disturb microbial communities as little as possible. (WFPS) with distilled water. Simultaneously, the soil was
The soil was sieved (2 mm) and pre-incubated at 22 ◦ C for fertilized with NO− 3 (variants −C2 H2 , +C2 H2 and traced).
5 to 7 d in the dark with cotton wool stoppers to allow res- The soil sample used with Soil 1.1 was incubated prior
piration and aerobic conditions in soil bags. Four microbial to the other soils and was amended with 60 mg N kg−1 of
inhibitor treatments (each in triplicate) with copt (glucose) for NaNO3 , while in agreement with other experiments con-
each soil were established: ducted in our laboratory, 50 mg N kg−1 of KNO3 was used
https://doi.org/10.5194/bg-18-4629-2021 Biogeosciences, 18, 4629–4650, 20214634 L. Rohe et al.: Inhibitor and N2 O isotope approaches to investigate fungal denitrification
with Soil 1.2, 2 and 3. In variant traced, NO− 3 with a
15 N and 20 ppm). The analytical precision was 0.1 ‰, 0.2 ‰ and
enrichment of 50 at. % (atom%) was used. For each treat- 1.5 ‰ for δ 15 Nbulk 18
N2 O , δ ON2 O and SPN2 O values, respectively.
ment, we incubated 100 g dw soil in 850 mL preserving jars H2 O and CO2 were trapped with magnesium perchlorate and
(J. WECK GmbH u. Co. KG, Wehr, Germany) with the ascarite, respectively, to prevent any interference with N2 O
gas inlet and outlet equipped with three-port luer lock plas- analysis.
tic stopcocks (Braun, Melsungen, Germany). According to The gas samples of variant traced from Soil 1.2, 2 and 3
the original SIRIN method (Anderson and Domsch, 1973, were analysed for the 29/28 and 30/28 ratios of N2 accord-
1978) a mixture of copt (glucose) and carrier material talcum ing to Lewicka-Szczebak et al. (2013) using a modified Gas-
(5 mg talcum g−1 dw) was added to soil of treatment A and Bench II preparation system coupled to an isotope ratio mass
together with the growth inhibitors to the soil of treatments B, spectrometer (MAT 253, Thermo Scientific, Bremen, Ger-
C and D. The soil and additives of each treatment were mixed many). The gas samples of variant traced from Soil 1.1 were
for 90 s with a handheld electric mixer. During packing, the analysed at the Centre for Stable Isotope Research and Anal-
soil density was adjusted to an expected target soil density of ysis (University of Göttingen, Germany). The N2 produced
1.6 g cm−3 in Soil 1.1, 1.2 and 2 and of 1.3 g cm−3 in Soil 3 was analysed using an elemental analyser (Carlo Erba ANA
to imitate field conditions. To ultimately achieve denitrifying 1500) that was coupled to a dual-inlet isotope ratio mass
conditions in all treatments and to avoid catalytic NO de- spectrometer (Finnigan MAT 251) (Well et al., 1998, 2006).
composition in the +C2 H2 variant (Nadeem et al., 2013), the Isotopic values of N2 O of Soil 1.1 (variant traced) were anal-
headspace of the closed jars was flushed with N2 to exchange ysed in the same lab using a pre-concentration unit cou-
the headspace 10 times. Directly following this, 85 mL of the pled to an isotope ratio mass spectrometer (PreCon–DeltaXP,
gas in the headspace in variant +C2 H2 was exchanged with Thermo Scientific, Bremen, Germany) (Well et al., 2006).
pure C2 H2 resulting in 10 kPa C2 H2 in the headspace. The Isotope ratios were used applying the non-random distribu-
manual sample collection of 14 mL gas in duplicates with a tion approach to calculate the fraction of N2 and N2 O orig-
plastic syringe was performed after 6, 8 and 10 h (Soil 1.2, 2 inating from the 15 N-labelled N pool as well as the 15 N en-
and 3) or 2, 4 and 8 h (Soil 1.1) of incubation time, respec- richment of that N pool (ap ) (Bergsma et al., 2001; Spott
tively. The removed gas was replaced by the same amount et al., 2006).
of N2 .
2.4 Inhibitor effects
2.3 Gas analysis
For interpretation of N2 O or CO2 production, the validity of
Gas samples were analysed for N2 O and CO2 concentra- the experimental results with respect to fungal and bacterial
tions (c(N2 O) and c(CO2 )) with gas chromatography (GC, N2 O fluxes was checked using a flux balance comparing the
Agilent 7890A, Agilent, Böblingen, Germany) (Fig. 1). sum of bacterial and fungal inhibition effects (treatments B
The analytical precision of measurements was derived from and C) to the dual inhibition effect (treatment D):
analysing laboratory standards of different concentrations
(0.5–1000 ppm N2 O and 340–10 000 ppm CO2 ) and resulted D = A − [(A − B) + (A − C)], (1)
in a measurement precision of 1 % for N2 O and 0.5 %
with A, B, C and D representing the N2 O production rates of
for CO2 . The instrumental detection limit of N2 O was
the last sampling time of treatment A, B, C and D, respec-
4 µg N kg−1 h−1 and of CO2 it was 137 µg C kg−1 h−1 . As a
tively. Assuming that in the other three treatments (A, B and
control, N2 and O2 concentrations in the samples were anal-
C) non-inhibitable N2 O production was equal to treatment D,
ysed with GC to ensure anaerobic conditions during the in-
N2 O produced by bacteria and fungi should show the follow-
cubation for N2 O production from denitrification. CO2 and
ing relation between the four treatments:
N2 O production rates were calculated by averaging the mea-
sured N2 O production, i.e. between the time point of flushing
(A − D) = (B − D) + (C − D). (2)
with N2 (t = 0) and 6, 8 or 10 h (or 2, 4 and 8 h with Soil 1.1).
The N2 O isotopic analysis of the gas samples of vari- The fungal contribution to N2 O production during denitri-
ants −C2 H2 and +C2 H2 (Fig. 1) was performed on a fication with microbial inhibition (fFDmi ) can be calculated,
pre-concentrator (PreCon, Thermo Finnigan, Bremen, Ger- when N2 O production of treatment D is significantly smaller
many) interfaced with a gas chromatograph (TRACE Ul- than N2 O production of treatments A, B and C, by
tra Gas, Thermo Scientific, Bremen, Germany) and anal-
ysed by isotope ratio mass spectrometry (IRMS; Delta V, (A − C)
Thermo Fisher Scientific, Bremen, Germany) (Brand, 1995; fFDmi = . (3)
(A − D)
Toyoda and Yoshida, 1999; Köster et al., 2013b). A labo-
ratory standard N2 O gas was used for calibration, having A detailed discussion of inhibitor effects and difficulties
δ 15 Nbulk 18
N2 O , δ ON2 O and SPN2 O values of −1.06 ‰, 40.22 ‰ with organisms that were not inhibited or abiotic sources
and −2.13 ‰, respectively, in three concentrations (5, 10 (treatment D) is presented in Sect. 4.1.
Biogeosciences, 18, 4629–4650, 2021 https://doi.org/10.5194/bg-18-4629-2021L. Rohe et al.: Inhibitor and N2 O isotope approaches to investigate fungal denitrification 4635
2.5 Isotope methods 2.5.2 Product ratio [N2 O / (N2 + N2 O)] of
denitrification
2.5.1 Isotope end-member mixing approach (IEM)
The variant traced served to assess N2 O reduction during
The fungal fraction (fFD ) contributing to N2 O production denitrification in each experiment. The product ratio of den-
from denitrification in soil samples was calculated accord- itrification [N2 O/(N2 + N2 O)] as given by the variant traced
ing to the isotope mixing model (IEM) proposed by Ostrom (r15 N ) was calculated as
et al. (2010), which was established for calculating the bacte-
15 N
rial fraction (fBD ) of N2 O production. Assuming that bacte- N2 O
r15 N = 15 N
, (5)
ria (BD) and fungi (FD) are the only sources of N2 O in soil, N2 + 15 N N2 O
the 15 N site preference values of produced N2 O (SPprod ) re-
sult from the SPN2 O mixing balance: with 15 NN2 O and 15 NN2 representing N2 O and N2 produced
in the 15 N-labelled fertilizer pool. To check the effectiveness
SPprod = fFD · SPFD + fBD · SPBD , (4) of C2 H2 in blocking the N2 O reduction, r15 N was compared
with rC2 H2 , where the latter can be calculated from N2 O pro-
where fFD and fBD represent the fraction of N2 O produced duction rates of variants −C2 H2 and +C2 H2 :
by fungi and N2 O sources other than fungal denitrification,
N2 O−C2 H2
respectively, and SPFD and SPBD are the respective SPN2 O rC2 H2 = , (6)
end-member values (Ostrom et al., 2010; Ostrom and Os- N2 O+C2 H2
trom, 2011). This calculation was based on the assumption
with N2 O−C2 H2 and N2 O+C2 H2 representing the N2 O pro-
that the sum of fBD and fFD equals 1 and that N2 O reduc-
duced in variants −C2 H2 and +C2 H2 , respectively.
tion to N2 is negligible. The mean SPFD value was assumed
It was possible to assess the completeness of blockage of
to be 33.6 ‰ (Sutka et al., 2008; Maeda et al., 2015; Rohe
N2 O reduction by C2 H2 with the experimental setup as fol-
et al., 2014a, 2017), and the SPBD value from heterotrophic
lows. If r15 N and rC2 H2 were in agreement, a complete block-
denitrification was assumed with minimum and maximum
age of N2 O reduction could be assumed. This enabled us to
values from −7.5 ‰ to +3.7 ‰ (Yu et al., 2020). For this
estimate reduction effects on the isotopic signatures of N2 O
IEM, only results from variant +C2 H2 could be used to cal-
by comparing the δ0 values, i.e. isotopic values of N2 O pro-
culate the fungal fraction contributing to N2 O production
duced without N2 O reduction effects of variant +C2 H2 , with
(fFD_SP ), as microorganisms of this variant produce N2 O
isotopic values of N2 O of variant −C2 H2 .
that is not affected by reduction to N2 . The fFD_SP con-
The information on the product ratio was used as an ad-
tributing to N2 O production during denitrification was cal-
ditional possibility of also calculating the fFD for variant
culated using the measured SPN2 O value of variant +C2 H2
−C2 H2 . The Rayleigh-type model presented by Lewicka-
as the SPprod value in Eq. (4) that was solved for fFD
Szczebak et al. (2017) and Senbayram et al. (2018) for sim-
(fFD = 1 − ((SPprod − SPFD )/(SPBD − SPFD ))). By applying
ilar closed-system incubations was used to calculate the 15 N
this equation, a range for fFD_SP is received when using min-
site preference values of the originally produced N2 O of vari-
imum and maximum SPBD values.
ant −C2 H2 (SPprod ). SP values of emitted N2 O, i.e. after par-
Based on SPN2 O values from the −C2 H2 variant, it was
tial reduction in produced N2 O (SPN2 O−r ), were corrected
possible to solve Eq. (4) to also estimate the maximum poten-
with the net isotope effect of N2 O reduction (ηr) and the r15 N
tial fungal contribution to denitrification (fFD_SPpot ) assum-
as follows:
ing that there was no contribution of N2 O reduction. While
bacterial denitrification and nitrifier denitrification would re- SPprod = SPN2 O−r + ηr · ln(r15 N ). (7)
sult in low SPN2 O values (SPBD/ND is −10.7 ‰ to +3.7 ‰;
Frame and Casciotti, 2010; Yu et al., 2020), large SPN2 O val- According to Yu et al. (2020) the ηr was assumed to be
ues would be expected from fungal denitrification and nitri- −6 ‰. Subsequently, Eq. (4) was used to calculate the fFD
fication (SPFB/N is 16 ‰ to 37 ‰; Sutka et al., 2008; De- by using SPprod values of variant −C2 H2 (fFD_SPcalc ) ob-
cock and Six, 2013; Rohe et al., 2014a, 2017; Maeda et al., tained from Eq. (7).
2015). N2 O reduction could have further increased the SPprod
values. If the contribution of this process to SPprod values 2.5.3 SP/δ 18 O isotope mapping approach (SP/δ 18 O
cannot be precisely estimated, by neglecting these effects Map)
we can determine the maximal potential fungal contribution.
fFD calculated from Eq. (4) (variant −C2 H2 ) would thus be The fFD contributing to N2 O production from denitrifica-
lower if N2 O reduction had occurred. However, assuming tion in soil samples was also estimated with the SP/δ 18 O
the impact of N2 O reduction on SPN2 O was negligible, this Map (fFD_MAP ) (Lewicka-Szczebak et al., 2017, 2020). This
IEM enabled us to calculate the maximum potential fFD as method allows for estimating both the fFD and N2 O prod-
fFD_SPpot = 1 − ((SPN2 O − SPFD/N )/(SPBD/ND − SPFD/N )). uct ratio [N2 O/(N2 +N2 O)] (rMAP ). For precise estimations,
https://doi.org/10.5194/bg-18-4629-2021 Biogeosciences, 18, 4629–4650, 20214636 L. Rohe et al.: Inhibitor and N2 O isotope approaches to investigate fungal denitrification
the δ 18 O values of soil water (δ 18 OH2 O ) applied in the ex- N2 O production, CO2 production and isotopic values. Signif-
periments are needed, and these values were not determined. icant effects of soils and treatments on rC2 H2 and r15 N were
However, since we have independent information on the N2 O tested by two-way ANOVA, while differences between soils
product ratio from the traced variant (r15 N ), we can calcu- and treatments influencing the product ratios were tested with
late the possible δ 18 OH2 O values of soil to obtain the nearest pairwise comparison with Tukey’s HSD test. Effects of vari-
N2 O product ratios in natural and 15 N treatments. The fit- ants −C2 H2 and traced on N2 O and CO2 production were
ting of δ 18 OH2 O values was performed for mean, minimal tested by ANOVA. For this ANOVA, the N2 O production rate
and maximal values of SPBD (−1.9 ‰, −7.5 ‰ and 3.7 ‰, had to be log10 -transformed to achieve homogeneity of vari-
respectively) and aimed at obtaining the minimal difference ance and normality. The significance level α was 0.05 for ev-
between rMAP and that measured in the traced variant, i.e. the ery ANOVA. For some ANOVAs treatments were excluded,
minimal value of (r15 N − rMAP )2 (according to least-squares when replicates were n < 3. This was the case when only one
method) variant (for explanation of the product ratio see or two samples out of three replicates could be analysed. This
Sect. 2.5.2). This further allows calculation of the possible is denoted in the footnotes of tables (Tables 2 and 3). The
ranges for fFD for particular fitted δ 18 OH2 O values (Table 4) N2 O or CO2 production rates of variant +C2 H2 were fol-
based on the SP/δ 18 O mapping approach (Lewicka-Szczebak lowed over three sampling times by regression. For statistical
et al., 2017, 2020). Namely, the fitted δ 18 OH2 O values are analysis, we used the program R (R Core Team, 2013). The
applied to properly correct the δ 18 ON2 O values of the mix- Excel Solver tool was used to determine the δ 18 OH2 O values
ing end-members (BD and FD), which depend on the ambi- in the application of SP/δ 18 O Map calculations.
ent water. Afterwards, the corrected values of mixing end-
members are applied to calculate the fFD values. The calcu-
lations with this approach may be performed assuming two 3 Results
different scenarios of the interplay between N2 O mixing and
reduction (Lewicka-Szczebak et al., 2017, 2020), but for this 3.1 N2 O production rates
study both scenarios yielded almost identical results (maxi-
mal differences of 0.02 in N2 O product ratio and 2 % for fFD N2 O and CO2 production rates of all treatments were similar
were found), due to fBD being near 100 %. Hence, we only in magnitude in almost all cases and mostly indistinguish-
provide the results assuming the reduction of bacterial N2 O able (Table 2, Fig. 2). CO2 production rates were determined
followed by mixing with fungal N2 O. In the following, all to obtain additional information about the denitrifying pro-
calculated fractions are presented in percent (%). cess. N2 O production rates exhibited increasing trends with
ongoing incubation time for every soil with large variations
2.6 Other sources of N2 O within the treatments (Fig. 2). Contrary to that, CO2 pro-
duction rates showed decreasing trends (Fig. 2, exemplarily
Assuming that denitrification was the only source of N2 O in shown for data of variant +C2 H2 ). Calculations of inhibitor
the incubation experiment, the expected 15 N enrichment in effects were based on average N2 O and CO2 production rates
N2 O produced (15 NN2 Oexp ) was given by of the entire incubation period, i.e. 10 h of incubation time for
Soil 1.2, 2 and 3 and 8 h for Soil 1.1.
15 (Nsoil · 15 Nnat ) + (Nfert · 15 Nfert )
NN2 Oexp [at. %] = , (8) N2 O and CO2 production rates of all +C2 H2 variants dif-
Nbulk fered significantly among soils (P < 0.001), and N2 O pro-
with Nsoil , Nfert and Nbulk describing the amount of N [mg] duction rates also differed significantly among treatments
in unfertilized soil samples (Table 1), fertilizer and fertilized (P < 0.001). The largest N2 O production rates of about 555
soil samples, respectively, and 15 Nnat and 15 Nfert describing to 613 µg N kg−1 h−1 were obtained in Soil 1.2 and 3, re-
the 15 N enrichment under natural conditions (0.3663 at. %) spectively, while in Soil 2 and 1.1 N2 O production rates
and in fertilizer (50 at. %), respectively. Comparison of mea- were smaller (271 and 264 µg N kg−1 h−1 , respectively). N2 O
sured 15 N enrichment in N2 O and 15 NN2 Oexp gave informa- and CO2 production rates were significantly larger in vari-
tion about the contribution of processes other than denitrifi- ant +C2 H2 than in variant −C2 H2 of Soil 1.1, 1.2 and 3
cation to N2 O production. (P < 0.001, P < 0.001 and P = 0.002 for the N2 O produc-
tion rate and P = 0.008, P < 0.001 and P = 0.027 for the
2.7 Statistical analysis CO2 production rate, respectively) (Table 2), while −C2 H2
and +C2 H2 variants of Soil 2 did not differ in N2 O and CO2
We conducted several three-way analyses of variance production rates (P = 0.640 and P = 0.342, respectively).
(ANOVAs) to test significant effects of the soil, experimen- Without blockage of N2 O reductase (variant −C2 H2 ),
tal variant and treatment on N2 O production; CO2 produc- N2 O production rates of treatment A varied signifi-
tion; and SPN2 O , δ 15 Nbulk 18
N2 O and δ ON2 O values. The pairwise cantly among soils with mean values between 175 and
comparison with Tukey’s HSD test allowed us to find dif- 355 µg N kg−1 h−1 (P < 0.001) (Table 2). In Soil 1.2,
ferences between soils, variants and treatments influencing the N2 O production rate was significantly larger
Biogeosciences, 18, 4629–4650, 2021 https://doi.org/10.5194/bg-18-4629-2021L. Rohe et al.: Inhibitor and N2 O isotope approaches to investigate fungal denitrification 4637
Table 2. Average CO2 and N2 O production rates and N2 O isotopic values of N2 O of the last sample collection with and without C2 H2
application in the headspace (variants −C2 H2 and +C2 H2 ) of each soil (Soil 1 to 3) for treatments A without growth inhibition, B with
bacterial growth inhibition, C with fungal growth inhibition, and D with bacterial and fungal growth inhibition, respectively (standard
deviation in brackets; n = 3).
Treatment/ Mean N2 O Mean CO2 δ 18 ON2 O [‰] δ 15 Nbulk
N O [‰] SPN2 O [‰]
2
variant [µg N kg−1 h−1 ] [µg C kg−1 h−1 ]
Soil 1.1 (loamy sand, summer 2011)
A/−C2 H2 175.3 (6.6)a 2448.5 (135.8)a 25.7 (0.3)a −30.6 (0.2)a 12.1 (1.6)a
B/−C2 H2 121.3 (74.0)a 2091.3 (19.5)b 28.0 (5.0)a −32.3 (0.7)a 7.7 (1.4)b
C/−C2 H2 104.5 (5.3)a 1844.7 (192.1)b 29.3 (0.1)a −30.0 (0.5)a 4.3 (1.0)c
D/−C2 H2 73.8 (63.0)a 1632.2 (115.3)b 28.9 (1.2)a −31.8 (2.2)a 3.4 (2.0)c
A/+C2 H2 263.5 (31.7)a 2076.6 (305.3)a 13.5 (0.5)* −34.7 (0.1)* −1.0**
B/+C2 H2 233.0 (15.6)a,b 1794.9 (238.9)a 14.3 (1.7)a −33.8 (0.9)a −4.9 (0.9)a
C/+C2 H2 119.5 (102.7)b 1736.8 (424.7)a 19.0 (7.0)a −33.1 (2.8)a −1.7 (2.7)a
D/+C2 H2 161.6 (7.6)a,b 1497.0 (138.7)a 14.8 (0.5)a −35.7 (0.2)a −4.9 (0.7)a
Soil 1.2 (loamy sand, winter 2012)
A/−C2 H2 272.0 (38.4)a 1233.8 (170.5)a 13.1 (0.2)a −21.9 (1.7)a 1.6 (0.8)a
B/−C2 H2 180.9 (16.8)b 1284.8 (168.0)a 13.0 (< 0.1)* −24.2 (0.7)* −1.3 (0.2)*
C/−C2 H2 203.1 (14.4)a,b 1124.8 (54.8)a 14.6 (0.4)a −20.0 (0.8)a −1.6 (0.5)a
D/−C2 H2 207.8 (32.6)a,b 1371.7 (35.3)a 15.2 (0.5)* −20.2 (1.8)* −0.3 (0.5)*
A/+C2 H2 554.9 (46.5)a 1700.9 (98.1)a 8.5 (0.1)a −22.1 (0.3)a −0.4 (0.3)a
B/+C2 H2 353.5 (14.0)b 1610.7 (47.2)a 7.5 (0.1)a −26.1 (0.2)a −1.2 (1.0)a
C/+C2 H2 441.8 (18.5)c 1604.1 (60.3)a 9.3 (0.2)a −22.4 (0.4)a −0.9 (0.4)a
D/+C2 H2 331.0 (20.5)b 1438.0 (141.9)a 7.8 (0.3)* −24.2 (0.1)* −2.3 (0.7)*
Soil 2 (sand, winter 2012)
A/−C2 H2 315.0 (35.0)a 1316.7 (97.7)a 15.5 (1.8)a −18.9 (2.6)a −0.9 (2.5)a
B/−C2 H2 241.7 (3.0)b 1209.2 (24.6)a 15.0 (1.3)a −23.4 (2.5)a,b −0.8 (< 0.1)a
C/−C2 H2 247.6 (22.8)b 1201.9 (48.2)a 14.3 (0.1)a −21.8 (0.2)a,b −1.8 (0.2)a
D/−C2 H2 198.4 (26.8)b 1102.4 (101.7)a 13.4 (0.3)a −24.5 (0.1)b −1.2 (0.3)a
A/+C2 H2 270.9 (36.3)a 1271.6 (203.5)a 12.6 (0.3)a −18.9 (4.6)a −1.4 (0.3)a
B/+C2 H2 263.1 (19.1)a 1338.7 (71.9)a 12.3 (0.1)a −24.6 (0.2)b −2.0 (0.2)a
C/+C2 H2 247.3 (15.9)a 1220.2 (50.0)a 12.7 (0.1)* −23.3 (0.2)* −1.7 (0.4)*
D/+C2 H2 187.3 (21.8)b 1173.1 (55.1)a 12.2 (0.3)a −26.0 (0.1)b −1.5 (0.9)a
Soil 3 (silt loam, winter 2013)
A/−C2 H2 355.0 (18.4)a 1227.6 (95.2)a 26.0 (0.5)a −20.8 (0.5)a −0.5 (0.4)a
B/−C2 H2 325.4 (36.3)a,b 1159.3 (178.2)a 24.1 (0.2)a −22.0 (0.2)a −0.1 (0.4)a
C/−C2 H2 278.9 (9.8)b 1056.0 (59.6)a 27.3 (0.1)a −20.6 (0.3)a 0.6 (0.2)a
D/−C2 H2 291.1 (38.5)a,b 1118.5 (70.3)a 26.3 (0.3)a −21.0 (0.1)a 0.0 (0.2)a
A/+C2 H2 612.8 (25.2)a 1332.5 (116.9)a 15.2 (0.1)a −25.6 (0.8)a −2.8 (0.2)a
B/+C2 H2 546.9 (27.5)b 1235.7 (83.4)a 14.9 (0.2)a −26.3 (< 0.1)a −3.5 (0.4)a
C/+C2 H2 519.8 (19.2)b 1173.5 (25.7)a 16.2 (< 0.1)* −25.2 (0.1)* −4.0 (0.4)*
D/+C2 H2 511.7 (3.5)b 1295.6 (63.3)a 16.0 (0.1)a −25.1 (0.1)a −4.3 (0.5)a
Letters denote significant differences (P < 0.05) among treatments and variants within a soil. Asterisks indicate that only two samples (*) or one
sample (**) of triplicates were analysable due to logistical difficulties.
(272 µg N kg−1 h−1 ) than in Soil 1.1 (175 µg N kg−1 h−1 ) growth inhibitor; more N2 O compared to treatment B in
(P = 0.028) in variant −C2 H2 . In most cases of the three Soil 1.2). The smallest N2 O production rates were in most
variants (−C2 H2 , +C2 H2 and traced) treatment A (without cases found in treatment D (non-inhibitable N2 O production)
growth inhibitors) produced most N2 O, followed by either (except for variant traced of Soil 1.1, variant −C2 H2 of
treatment B (bacterial growth inhibitor; more N2 O compared Soil 1.2, and variants −C2 H2 and traced of Soil 3). Microbial
to treatment C in soils 1.1, 2 and 3) or treatment C (fungal inhibitor treatments differed significantly in N2 O fluxes of
https://doi.org/10.5194/bg-18-4629-2021 Biogeosciences, 18, 4629–4650, 20214638 L. Rohe et al.: Inhibitor and N2 O isotope approaches to investigate fungal denitrification
Table 3. Average CO2 and N2 O production rates of the last sample collection after 10 or 8 h of variant traced, respectively, with 15 N labelling
in N2 O (15 NN2 O ) and the calculated r15 N of variant traced and rC2 H2 calculated from N2 O production rates of variant −C2 H2 and +C2 H2
of each soil (Soil 1 to 3) for treatments A without growth inhibition, B with bacterial growth inhibition, C with fungal growth inhibition, and
D with bacterial and fungal growth inhibition, respectively (standard deviation in brackets; n = 3).
Treatment mean N2 O mean CO2 15 N 15 N Calc. total Calc. total
N2 O N2 O_exp
[µg N kg−1 h−1 ] [µg N kg−1 h−1 ] [at. %] [at. %]a r15 N b rC2 H2 c
Soil 1.1 (loamy sand, 2011)
A 156.9 (62.7) 3111.4 (1252.5) 31.1** 49 0.54 (0.05) 0.63 (0.10)
B 169.2 (6.1) 2314.6 (307.1) 26.5** 0.59 (0.03) 0.63 (0.17)
C 117.2 (3.1) 1785.6 (79.3) 30.1 (1.1)* 0.50 (0.01) 0.62 (0.02)
D 115.2 (3.1) 1706.7 (38.1) 33.5 (0.5)* 0.50 (0.01) 0.53 (0.12)
Soil 1.2 (loamy sand, 2012)
A 255.6 (43.5) 1310.0 (167.3) 36.8 (0.1) 39 0.80 (0.02) 0.48 (0.07)
B 154.5 (29.6) 1153.5 (238.4) 36.4 (0.2) 0.76 (0.02) 0.48 (0.05)
C 191.6 (30.7) 1219.6 (109.1) 36.9 (< 0.1) 0.72 (0.05) 0.45 (0.04)
D 148.1 (1.9) 1253.8 (54.5) 36.8 (0.1) 0.69 (0.02) 0.54 (0.05)
Soil 2 (sand, 2012)
A 240.7 (0.95) 1286.2 (5.6) 43.2 (< 0.1) 44 0.94 (0.01) 1.04 (0.10)
B 185.1 (3.9) 1157.4 (17.3) 43.0 (0.1) 0.94 (0.01) 0.81 (0.04)
C 241.1 (13.4) 1282.1 (63.4) 43.2 (0.1) 0.95 (0.01) 0.99 (0.09)
D 167.3 (34.9) 1199.0 (34.6) 42.7 (0.1) 0.93 (0.01) 0.98 (0.04)
Soil 3 (silt loam, 2013)
A 285.9 (20.4) 1044.0 (46.6) 35.8 (< 0.1) 34 0.62 (< 0.01) 0.52 (0.04)
B 320.5 (14.7) 1204.2 (86.5) 35.5 (< 0.1) 0.62 (0.01) 0.59 (0.02)
C 216.4 (34.9) 980.5 (202.5) 35.5 (< 0.1) 0.59 (0.02) 0.48 (0.04)
D 231.4 (11.4) 988.5 (74.4) 35.3 (< 0.1) 0.62 (0.01) 0.51 (0.04)
Asterisks indicate that only two samples (*) or one sample (**) were analysed due to logistical difficulties. a 15 NN2 O_exp [at. %] was calculated from Eq. (8).
br c
15 N = [N2 O/(N2 + N2 O)], with N2 O or N2 production rates from variant traced; see Eq. (5). rC2 H2 = [N2 O−C2 H2 /N2 O+C2 H2 ], with N2 O production rate
from variants −C2 H2 and +C2 H2 ; see Eq. (6); cf. Table 2.
variant +C2 H2 of each soil (always P ≤ 0.042), while 3.2 Isotopologues of N2 O produced in different
this was not the case for inhibitor treatments of variants variants and treatments
−C2 H2 and traced of Soil 1.1 (P = 0.154 and P = 0.154,
respectively). Significant deviations of treatments without 3.2.1 Variant −C2 H2
inhibition (A) or with full inhibition (D) were found in
the following cases (Table 2): the N2 O production rate of SPN2 O values of all soils and inhibitor treatments of vari-
treatment A was significantly larger compared to the other ant −C2 H2 were within a range of −1.8 ‰ to 12.1 ‰ (Ta-
three treatments of Soil 1.2 (+C2 H2 and −C2 H2 ), Soil 2 ble 2) and differed among inhibitor treatments (P = 0.037).
(−C2 H2 ) and Soil 3 (+C2 H2 ); treatment D was significantly SPN2 O values in variant −C2 H2 of Soil 1.1 were particularly
smaller compared to the other three treatments in Soil 2 large (3.4 ‰ to 12.1 ‰) compared to the other soils (1.6 ‰ to
(+C2 H2 ) only and compared to treatments A and C in −1.6 ‰). SPN2 O values of variant −C2 H2 were significantly
Soil 1.2 (+C2 H2 ). A detailed discussion of inhibitor effects larger than SPN2 O values of variant +C2 H2 (P < 0.001) (up
and difficulties with organisms that were not inhibited or to 4.1 ‰, 2.4 ‰, 1.5 ‰ and 4.6 ‰ in Soil 1.1, 1.2, 2 and 3, re-
abiotic sources is presented in Sect. 4.1. Comparing variants spectively). Generally, most SPprod values of variant −C2 H2
−C2 H2 and traced, N2 O and CO2 rates did not differ (Eq. 7) were smaller than SPN2 O values of variant −C2 H2
(P = 0.991 for N2 O production rate and P = 0.490 for CO2 but still larger than SPN2 O values of variant +C2 H2 and are
production rate, respectively), confirming that 15 N labelling presented in Table S2 in the Supplement.
did not affect N2 O and CO2 processes.
Biogeosciences, 18, 4629–4650, 2021 https://doi.org/10.5194/bg-18-4629-2021L. Rohe et al.: Inhibitor and N2 O isotope approaches to investigate fungal denitrification 4639 Figure 2. Time series of average N2 O and CO2 production rates during incubation of variant +C2 H2 at the three sample collection times of each soil (Soil 1 to 3) for treatment A without growth inhibitors, B with bacterial growth inhibition, C with fungal growth inhibition, and D with bacterial and fungal growth inhibition; P values for linear regressions (significance level α ≤ 0.05). For all significant regressions, R 2 values were ≥ 0.46, and in the case of non-significance, R 2 values were ≤ 0.40. n.d.: there was no detectable CO2 production in Soil 1.1 at the first sampling time after 2 h. https://doi.org/10.5194/bg-18-4629-2021 Biogeosciences, 18, 4629–4650, 2021
4640                                  L. Rohe et al.: Inhibitor and N2 O isotope approaches to investigate fungal denitrification

Table 4. Summary of the results provided by SP/δ 18 O Map for fraction of fungal denitrification (fFD_MAP ) and N2 O product ratio (rMAP ) in
the acetylated (+C2 H2 ) and non-acetylated (−C2 H2 ) variants for three possible SPN2 O values from bacterial denitrification (SPBD ): mean
(−1.9 ‰), maximal (3.7 ‰) and minimal (−7.5 ‰). The δ 18 O values of soil water (δ 18 OH2 O ) were fitted to obtain the lowest difference
(Diff) between product ratio determined with 15 N treatment (r15 N ) and SP/δ 18 O Map (rMAP ). The most plausible fittings are shown in bold
(see discussion for reasons for this choice).

                         Soil     Variant        r15 N     SPBD [‰]           δ 18 OH2 O [‰]        rMAP        Diff        fFD_MAP [%]*
                         1.1      −C2 H2         0.60              −1.9                  −3.3         0.66      0.06                 15
                                  +C2 H2            1              −1.9                  −3.3         0.96      0.04                −30
                                  −C2 H2         0.60               3.7                   1.5         0.72      0.12                  8
                                  +C2 H2            1               3.7                   1.5         0.91      0.09                −21
                                  − C2 H2        0.60              −7.5                  −6.8         0.61      0.01                 20
                                  + C2 H2           1              −7.5                  −6.8         0.99      0.01                 11
                         1.2      − C2 H2        0.66              −1.9                 −11.2         0.66      0.00                 −1
                                  + C2 H2           1              −1.9                 −11.2         1.00      0.00                  2
                                  −C2 H2         0.66               3.7                  −6.1         0.65      0.01                −14
                                  +C2 H2            1               3.7                  −6.1         1.00      0.00                −16
                                  −C2 H2         0.66              −7.5                 −14.9         0.66      0.00                  8
                                  +C2 H2            1              −7.5                 −14.9         1.00      0.00                 14
                         2        − C2 H2        0.94              −1.9                  −6.3         0.90      0.04                  1
                                  + C2 H2           1              −1.9                  −6.3         1.04      0.04                  1
                                  −C2 H2         0.94               3.7                  −1.2         0.90      0.04                −16
                                  +C2 H2            1               3.7                  −1.2         1.04      0.04                −18
                                  − C2 H2        0.94              −7.5                 −10.1         0.90      0.04                 13
                                  + C2 H2           1              −7.5                 −10.1         1.04      0.04                 15
                         3        −C2 H2         0.61              −1.9                  −1.7         0.54      0.07                 −3
                                  +C2 H2            1              −1.9                  −1.7         1.04      0.04                 −5
                                  −C2 H2         0.61               3.7                   3.7         0.54      0.07                −14
                                  +C2 H2            1               3.7                   3.7         1.03      0.03                −24
                                  − C2 H2        0.61              −7.5                  −5.6         0.53      0.08                  4
                                  + C2 H2           1              −7.5                  −5.6         1.04      0.04                  9

                       * Negative values for fFD_MAP are non-realistic and therefore discarded in further interpretation.

3.2.2   Variant +C2 H2                                                                 ant +C2 H2 (P = 0.400). However, only in a few variants
                                                                                       were there significant differences in δ 18 ON2 O , δ 15 Nbulk
                                                                                                                                                N2 O or
                                                                                       SPN2 O values between treatments with fungal and bacterial
SPN2 O values of all soils and all treatments of variant +C2 H2
                                                                                       inhibition (B and C, respectively) (Table 2). As explained in
were within a narrow range between −4.9 ‰ and −0.4 ‰
                                                                                       Sect. 3.3, N2 O reduction blockage in variants +C2 H2 was
(Table 2). In general, there were only small differences
                                                                                       successful in most cases (Soil 1.1, 2 and 3). SPN2 O values of
among treatments: SPN2 O values of treatment A in variant
                                                                                       this variant are thus assumed to be valid estimates of δ0, i.e.
+C2 H2 differed significantly among soils (P < 0.001), with
                                                                                       SPprod values of N2 O production, and can thus be used for
the largest SPN2 O values in Soil 1.2 (−0.4 ‰) and small-
                                                                                       applying the IEM.
est SPN2 O values in Soil 3 (−2.8 ‰). SPN2 O values of treat-
ment D in variant +C2 H2 of all soils varied between −1.5 ‰
and −4.9 ‰, but only SPN2 O values of Soil 2 differed signif-                          3.2.3      Variant traced
icantly from SPN2 O values of the other soils (P = 0.006). For
treatment B of variant +C2 H2 , SPN2 O values differed only                            The 15 N labelling of N2 O (15 NN2 O ) or N2 produced (15 NN2 )
significantly between Soil 1.1 and 1.2, 2 and 1.1, and 1.2                             gave information about the incorporated N from 15 N-labelled
and 3 (each P = 0.002). SPN2 O values from treatment C in                              NO− 3 into N2 O or N2 as well as about the N2 O reduction to
variant +C2 H2 did not differ significantly (P = 0.600). For                           N2 . Microorganisms in each treatment used the 15 N-labelled
every soil, we found significantly larger δ 18 ON2 O , δ 15 Nbulk
                                                             N2 O                      NO− 3 in variant traced (Table 3) and expected
                                                                                                                                         15 N
                                                                                                                                              N2 O de-
                                                                                                                                     −
and SPN2 O values in variant −C2 H2 than in variant +C2 H2                             pended on the initial N abundance in NO3 of unfertilized
(P < 0.001), except for Soil 2, where δ 15 Nbulk N2 O values of                        soil (Eq. 7). Soil 1.1 is the only one showing a large dis-
variant −C2 H2 were indistinguishable from those of vari-                              crepancy between measured (about 30 at. %) and calculated

Biogeosciences, 18, 4629–4650, 2021                                                                              https://doi.org/10.5194/bg-18-4629-2021
You can also read


