Multiple pygmy blue whale acoustic populations in the Indian Ocean: whale song identifies a possible new population
←
→
Page content transcription
If your browser does not render page correctly, please read the page content below
www.nature.com/scientificreports
OPEN Multiple pygmy blue whale
acoustic populations in the Indian
Ocean: whale song identifies
a possible new population
1*
Emmanuelle C. Leroy , Jean‑Yves Royer2, Abigail Alling3, Ben Maslen4 & Tracey L. Rogers1
Blue whales were brought to the edge of extinction by commercial whaling in the twentieth century
and their recovery rate in the Southern Hemisphere has been slow; they remain endangered. Blue
whales, although the largest animals on Earth, are difficult to study in the Southern Hemisphere,
thus their population structure, distribution and migration remain poorly known. Fortunately, blue
whales produce powerful and stereotyped songs, which prove an effective clue for monitoring their
different ‘acoustic populations.’ The DGD-Chagos song has been previously reported in the central
Indian Ocean. A comparison of this song with the pygmy blue and Omura’s whale songs shows that
the Chagos song are likely produced by a distinct previously unknown pygmy blue whale population.
These songs are a large part of the underwater soundscape in the tropical Indian Ocean and have
been so for nearly two decades. Seasonal differences in song detections among our six recording sites
suggest that the Chagos whales migrate from the eastern to western central Indian Ocean, around
the Chagos Archipelago, then further east, up to the north of Western Australia, and possibly further
north, as far as Sri Lanka. The Indian Ocean holds a greater diversity of blue whale populations than
thought previously.
Commercial whaling in the twentieth century brought blue whales (Balaenoptera musculus) to the brink of
extinction; for instance, in the Southern Hemisphere it is estimated that less than 0.15% of the blue whale popu-
lation survived w haling1. Despite increases in blue whale populations at a global scale, their recovery remains
slow and they are classified as Endangered by the IUCN Red List2. Despite their enormous size, blue whales
have been difficult to observe in the Southern Hemisphere; thus, for some regions, their population structure,
distribution and migration routes remain poorly understood. In particular, little is known about the blue whales
in the northern Indian Ocean3.
To overcome the limitations of classical visual surveys, passive acoustic monitoring proves an efficient method
to monitor this vocal s pecies4. Blue whales produce powerful and stereotyped songs, that they repeat in sequences
for hours to days. Each blue whale population has a distinct vocal signature, which can be used to distinguish and
monitor different ‘acoustic populations’ or ‘acoustic groups’5. The mechanisms that have led to the geographic
variation in their song types is unknown (e.g., physical and environmental adaptation, and/or cultural trans-
mission). Regardless of whether song variation is a driving force, or a consequence of reproductive isolation or
similar events, understanding song variation across the species’ range can provide valuable insight to conserva-
tion management of the species.
The Indian Ocean has an incredible diversity of blue whale acoustic populations6–11. Until very recently, there
were four recognized blue whale populations from two subspecies: the Antarctic blue whale (B. m. intermedia),
that is believed to produce the same song across the Southern Hemisphere; and three acoustic populations of
the pygmy blue whale (B. m. brevicauda). The pygmy blue whale populations are distinguishable only acousti-
cally; they do not display morphological differences and genetic data are sparse12. One population dwells in the
southwestern Indian Ocean (SWIO) and is characterized by the Madagascan or type-9 song. A second population
dwells in the southeastern Indian Ocean (SEIO) and is characterized by the Australian or type-8 song. Finally,
1
Evolution and Ecology Research Centre, School of Biological, Earth and Environmental Sciences, University
of New South Wales, Sydney, Australia. 2University of Brest and CNRS Laboratoire Geosciences Ocean, IUEM,
29280 Plouzané, France. 3Biosphere Foundation, P.O. Box 112636, Campbell, CA 95011‑2636, USA. 4Mark
Wainwright Analytical Centre, University of New South Wales, Sydney, Australia. *email: emmanuelle.leroy@
unsw.edu.au
Scientific Reports | (2021) 11:8762 | https://doi.org/10.1038/s41598-021-88062-5 1
Vol.:(0123456789)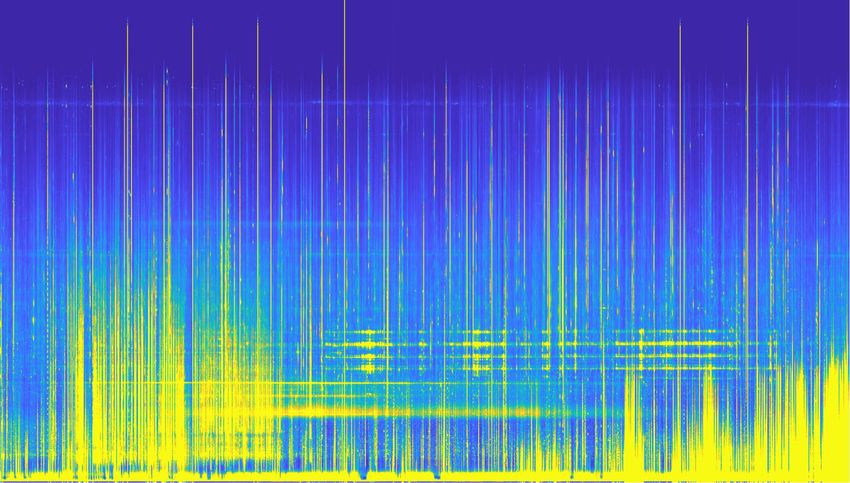
www.nature.com/scientificreports/
120
100
80
Frequency (Hz)
60
40
20
0
2017/02 2017/04 2017/06 2017/08 2017/10 2017/11
Time (yr/month)
Figure 1. Long-term spectrogram of data recorded on the eastern side of the Chagos Archipelago (DGS site) in
2017: Chagos songs are a major component of the central Indian Ocean underwater soundscape and have been
so for nearly two decades. The acoustic energy in the parallel horizontal frequency bands outlined in the black
box are Chagos songs. Spectrogram parameters: 6 h averaging window, 50% overlap, FFT window of 120 s.
a third population, and possibly a separate subspecies (B. m. indica), dwells in the northern and central Indian
Ocean (NIO), and is characterized by the Sri Lankan or type-7 song5. Very recently, evidence for a fourth pygmy
blue whale acoustic population were found in the northwestern Indian Ocean (NWIO) in the Arabian Sea off
Oman, in the southwestern Indian Ocean off Madagascar, as well as in the central Indian Ocean on the west side
of the Chagos Archipelago (DGN site, see below)13. Together with the Antarctic blue whales, all five of these blue
whale populations are sympatric in the central Indian Ocean8,11,13.
A possible sixth blue whale song, the ‘Diego Garcia Downsweep’ (DGD) referred to here as Chagos song, has
been recorded in the central Indian Ocean, off Diego Garcia, an atoll in the Chagos A rchipelago14. The Chagos
song was initially considered to be a variant of the Madagascan pygmy blue whale s ong5. Sousa and Harris
(2015) re-examined the song, and compared its temporal and spectral properties with the vocalizations of other
baleen whale species known to dwell in the area (i.e., the Bryde’s whales (Balaenoptera edeni), humpback whales
(Megaptera novaengliae), minke whales (B. acutorostrata), sei whales (B. borealis), fin whales (B. physalus) and
blue whales (B. musculus)). They strongly suggested that the Chagos song was a new blue whale song and not a
variant of the Madagascan pygmy blue whale song ( see14 for detailed comparison).
Sousa and Harris (2015) however, described a second type of vocalization off Diego Garcia, the ‘Diego Garcia
Croak’ (DGC)14. Where the Chagos song is a three-unit song, the DGC song is typically a single-unit song. The
first part of the Chagos song shares acoustic features with the DGC song. They are similar in duration (approxi-
mately 4 s), frequency range (approximately 15 to 50 Hz)14, and are both described as amplitude-modulated in
structure14–17. Thus, it is possible that these songs are produced by the same whale species. As the DGC song has
been recently attributed to the Omura’s whale (B. omurai) based on acoustic similarity with the Omura’s whales
recorded off M adagascar15,17, one could argue that the Chagos song is an Omura’s and not a blue whale song.
In the event that the Chagos song is produced by the blue whale, and given its huge contribution to the
underwater soundscape around the Chagos Archipelago (Fig. 1), it suggests that there is a previously unknown
(pygmy) blue whale population in the central Indian Ocean. If this was the case, we hypothesize that the Chagos
song should: (1) possess acoustic characteristics more like the blue whale songs than the Omura’s whale songs;
and (2) that the presence of Chagos songs in the Indian Ocean soundscape would be consistent with the behav-
iour of other blue whale populations. For example: (2a) the Chagos songs should be detected across a relatively
wide spatial distribution, reflecting the wide-ranging habitat of the blue whale; (2b) the song occurrence should
show seasonal variation within the year; and (2c) the seasonality in song occurrence should remain relatively
stable across years.
To explore this question, we examine the acoustic structure, frequency and temporal characteristics of the
Chagos song, and compare it to the pygmy blue whale song-types of the Indian Ocean (Madagascan, Sri Lan-
kan and Australian song-types), and to Omura’s whale song-types recorded in the tropical waters of the South
Atlantic Ocean18, off Ascension Island; off Madagascar15; around the Chagos Archipelago at Diego Garcia sites14;
and off Kimberley, Western A ustralia16. Then we investigate the presence of the Chagos songs at several loca-
tions in the Indian Ocean: (1) one site in the Equatorial waters, off Trincomalee, Sri Lanka; (2) three sites in the
tropical waters: at RAMA (03.5◦ S, 080.3◦ E, 16 months of continuous hydroacoustic data) and two sites further
Scientific Reports | (2021) 11:8762 | https://doi.org/10.1038/s41598-021-88062-5 2
Vol:.(1234567890)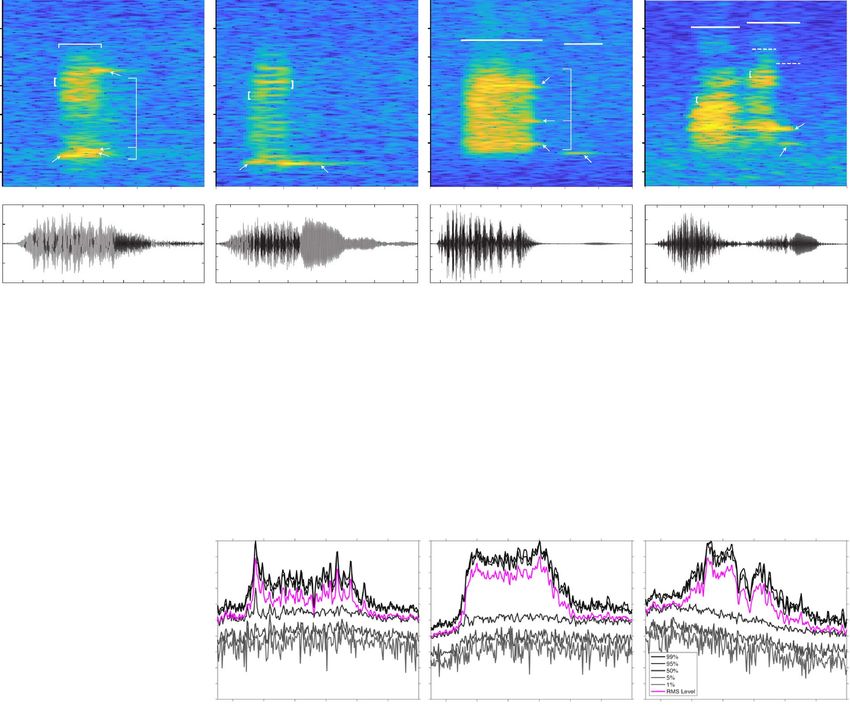
www.nature.com/scientificreports/
60˚ 70˚ 80˚ 90˚
10˚
Trincomalee
40˚ 50˚ 60˚ 70˚ 80˚ 90˚ 100˚ 110˚ 120˚
30˚ 30˚
0˚
RAMA
DGN Diego Garcia
20˚ 20˚
India DGS
Chagos −10˚
Archipelago
Trincomalee
10˚ 10˚
1000 km
−20˚
0˚ 0˚
RAMA
Seychelles DGN
DGS
−10˚ −10˚
Madagascar Kimberley
−20˚ −20˚
RTJ
1000 km
−30˚ −30˚
40˚ 50˚ 60˚ 70˚ 80˚ 90˚ 100˚ 110˚ 120˚
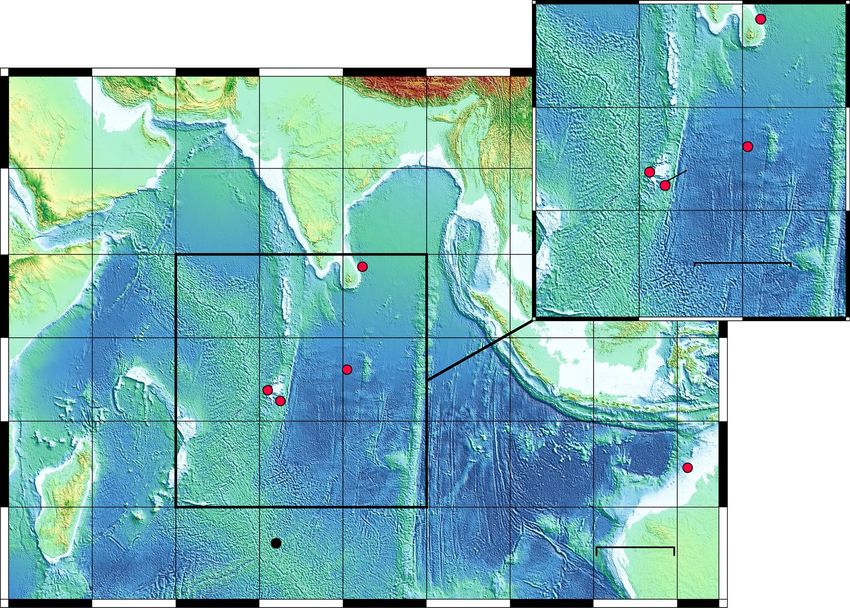
Figure 2. Study area and locations of the hydroacoustic stations (circles) used in this study to explore the
presence of Chagos songs: in the equatorial waters, off Trincomalee, Sri Lanka; in the tropical waters: RAMA
and the western (DGN) and eastern (DGS) sides of Chagos Archipelago; Kimberley, at the north of Western
Australia, at the limit between the tropical and subtropical waters; and RTJ in the subtropical waters of the
central Indian Ocean. Red circles indicate the sites where Chagos songs have been recorded.
south-west, off the Chagos Archipelago (DGN, 06.3◦ S, 071.0◦ E and DGS, 07.6◦ S, 072.5◦ E, up to 17 years of
continuous data); (3) one site further south-east, at the limit between the tropical and subtropical waters, off
Kimberley, Western Australia (15.5◦ S, 121.25◦ E); and (4) one site further south, in the subtropics at RTJ (24.0◦ S,
072.0◦ E, one year of data); Fig. 2).
Results
Song description: terminology. Song organisation. Blue whale vocal sequences are traditionally re-
ferred to as ‘calls’19–21, however, as they meet the criterion of ‘song’ as used in the bioacoustic c ommunity22, in
this study we use the term ‘song’ to refer to regularly-repeated whale vocalisations. The song is repeated in a
sequence with regular intervals, defined as the Inter-Call Interval (ICI), measured as the time interval between
the beginning of the one song and the beginning of the following song. Note that although we use the term ‘song’,
we chose to keep the definition ‘ICI’ as this nomenclature is used traditionally in the whale literature, rather than
‘ISI’, which usually designates Inter-Series (or Sequence) Interval. Songs are composed of units and we used the
term ‘unit’ to designate parts of the song that are separated by a silence (see reviewed criteria in23). Units were
divided into subunits: subunits are defined as such when there is a sudden change in the sound structure for
instance becoming harmonic or noisy.
Sound types. A sound can be of different types: (1) the simpler one is the simple tone, which is either pure, with
the same frequency all along, or showing frequency and/or amplitude modulations; (2) harmonic sounds are
sounds with multiple tones at frequencies that are integer multiples of the frequency of the original wave, called
the fundamental frequency ( F0). When one of the harmonics has a greater amplitude than the others, it is called
‘resonance frequency’; (3) pulsed sounds are, as defined in24, the repetition of similar “pulses” or short signals
with a constant pulse rate, often aurally perceived by humans as amplitude modulated sounds. On spectrogram
representation, using a long analysis time window, these sounds are characterized by sidebands with regular
spacing. The frequency difference ( f ) between each sideband is the pulse rate of the sound. In their recent
study, Patris et al. made the difference between what they defined as ‘tonal pulsed sounds’ and ‘non-tonal pulsed
sounds’24. Following their criterium, the sidebands of the tonal pulsed sounds show a harmonic relationship,
Scientific Reports | (2021) 11:8762 | https://doi.org/10.1038/s41598-021-88062-5 3
Vol.:(0123456789)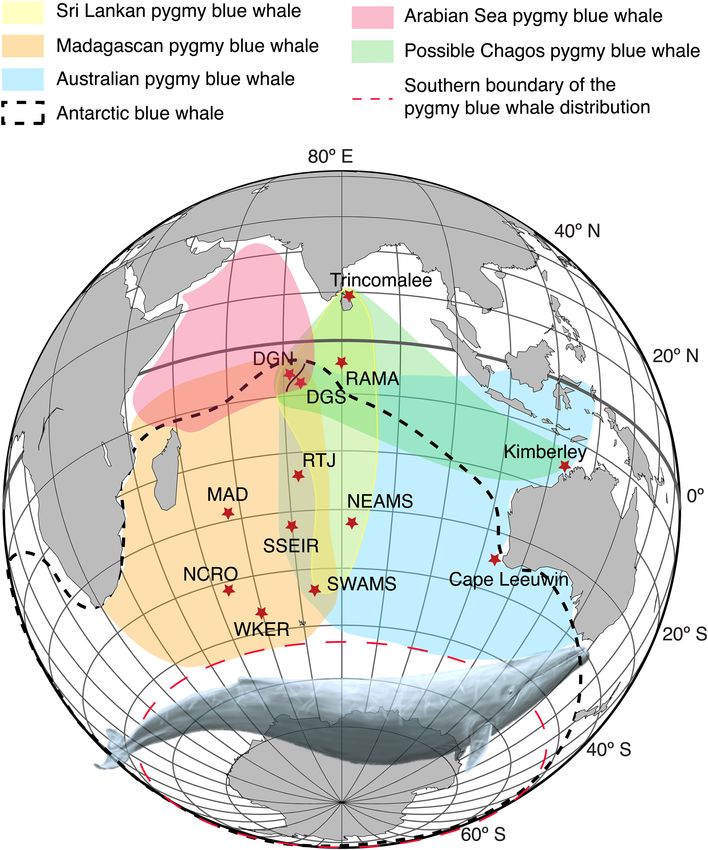
www.nature.com/scientificreports/
meaning that the frequency of each sideband divided by the pulsed rate is a positive integer. If it is not the case,
then the sound is a non-tonal pulsed sound.
Nonlinear phenomena. Nonlinear phenomena are observed in a variety of b irds25, anurans26 and m
ammals27,28,
including marine mammals (e.g., manatee29) and more particularly cetaceans (right whales30,31, killer whales30,32
and humpback w hales33). They have been well described by a variety of authors27,34 and include: (1) frequency
jumps, that are characterized by sudden F0 changes which moves up or down abruptly and discontinuously,
and is different from continuous, smooth modulation27; (2) subharmonics, that are additional spectral com-
ponents and can suddenly appear at integer fractional values of an identifiable F0 (e.g., F0 /2, F0 /3, . . .) and as
harmonics of these values. On a spectrogram, it results as bands of energy evenly spaced below F0 and between
its harmonics throughout the spectrum; (3) biphonation, that is the simultaneous occurrence of two independ-
ent fundamental frequencies F0 and G0. Biphonation can be visible on a spectrogram as two distinct frequency
contours35. Alternatively, if one source ( F0) vibrates at a much lower frequency than the other (G0), biphonation
will appear as visible sidebands at linear combinations of F0 and G0 (mG0 ± n F0, where m and n are integers),
because the airflow is then modulated by the frequency difference. This is equivalent to considering that the
lower F0 amplitude-modulates the higher frequency G0 (carrier frequency)28; (4) finally, deterministic chaos are
broadband, noise-like segments. These episodes of non-random noise appear via abrupt transitions and can also
contain some periodic energy, which appears as banding in a spectrogram. In extreme cases there are no repeat-
ing periods at all27,34.
Analysis of the Chagos song and comparison with the Indian Ocean pygmy blue whale song
types and Omura’s whale song types. Chagos song. The Chagos song was composed of 3 units (Fig. 3).
The 3-unit song was repeated in stereotyped series with an ICI of 190.79 ± 1.49 s (Fig. 7b).
The first unit of the Chagos song is divided into 3 subunits (Fig. 3): in 2017, subunit 1 was pulsed with a rate
fu1su1 = 3.22 ± 0.01 Hz. Using Patris et al. ’s criterion24, we concluded that this subunit is a non-tonal pulsed
sound, since the sidebands do not have a harmonic relationship. The carrier frequency (where the peak of energy
lies) was 35.74 ± 0.02 Hz for 73% of the measured songs, 32.47 ± 0.05 Hz for 23% of the songs and 38.9 ± 0.06 Hz
for 3% of the measured songs. One song had a carrier frequency of 29.18 Hz. This subunit 1 lasted 3.02 ± 0.03 s
in duration. Subunit 2 was often less obvious (likely due to propagation effects, lower source level or possibly to
deterministic chaos) so that it could not be measured for all of the songs sampled; it is also a short (1.53 ± 0.05 s)
non-tonal pulsed unit with a pulse rate ( fu1su2) of approximately 3 Hz and a slightly different carrier frequency,
induced by a frequency jump. The carrier frequency was of 36.02 ± 0.03 Hz for 87% of the measurements, 39.16
± 0.05 Hz for 8% of the measured songs and 32.97 ± 0.1 Hz for 5%. Finally, subunit 3 was a tonal unit showing
a frequency modulation. The subunit started at 29.55 ± 0.02 Hz down to 29.35 ± 0.02 Hz over approximately
3.5 s, then down to 28.10 ± 0.09 Hz as a decrease to 27.62 ± 0.04 Hz over 3 s. The total duration of this subunit
was 6.40 ± 0.07 s, and the total duration of the unit 1 was 11.36 ± 0.08 s.
Unit 2 was a pure tone following after a silence of 3.06 ± 0.1 s. Its peak frequency was 22.34 ± 0.05 Hz and
its duration was 3.24 ± 0.07 s. Finally, unit 3, also a pure tone, followed after a silence of 14.38 ± 0.23 s. It had
a peak frequency of 17.44 ± 0.05 Hz and lasted 2.94 ± 0.15 s. The third unit was sometimes absent. This could
be due to a variation in the song or due to propagation losses. When unit 3 was present, the total song duration
was 34.38 ± 0.4 s.
The frequency for the beginning of the third subunit of the unit 1 of the Chagos song (point 1 in Fig. 3a)
decreased by approximatively 0.33 Hz/year across years (Fig. 4).This phenomenon will be examined in details
in a further study.
Indian Ocean pygmy blue whale songs. This section describes the structural, temporal and frequency features
of the pygmy blue whale song-types commonly reported in the Indian Ocean. Note that as the frequency of at
least parts of these songs are known to vary within and across y ears36–41, the frequency values obtained here are
only valid for the years sampled.
Madagascan pygmy blue whale The Madagascan pygmy blue whale song had 2 units (Fig. 5a). Unit 1 was
divided into 2 subunits. In 2004, subunit 1 was a noisy pulsed sound, characteristic of deterministic chaos, with
a pulse rate fu1su1 = 1.44 ± 0.01 Hz and of 4.76 ± 0.005 s duration. Subunit 2 was a tonal sound with harmonics.
Its F0, estimated as the mean frequency difference between the harmonics, was 7.04 ± 0.005 Hz. The maximum
energy was in the F5 (resonance frequency), which commenced at 35.31 ± 0.02 Hz and remained stable over
10.65 ± 0.13 s (F5u1su2 in Fig. 5a). The frequency then remained stable over another 3.00 ± 0.16 s or in some songs
increased to 35.91 ± 0.05 Hz [range = 34.84–37.05 Hz]. The total duration of subunit 2 was 13.65 ± 0.12 s, and
unit 1 was 18.41 ± 0.15 s.
Unit 2 followed after 27.74 ± 0.13 s. It had 2 subunits. Subunit 1 was a noisy pulsed sound, identified as deter-
ministic chaos, it had a pulsed rate of fu1su1 = 1.25 ± 0.017 Hz, and a duration of 3.30 ± 0.05 s. Subunit 2 was a
complex harmonic-like signal, with sidebands spaced by fu2su2 = 1.39 ± 0.003 Hz. Calculations of the ratio of
the sideband frequencies over f show that these 1.39 Hz-spaced bands do not have a harmonic relationship.
However, relatively higher energy lies in frequency bands that have a harmonic relationship, where the band
with the greatest energy started at 25.11 ± 0.02 Hz and ended at 24.33 ± 0.02 Hz (G3u2su2 on Fig. 5). On the low
signal-to-noise ratio (SNR) songs, only the harmonic bands were visible, this explains why this unit has been
described previously as a harmonic signal when it is n ot7. The complex structure of subunit 2 can be explained by
a phenomenon of biphonation, where there are two concurrent frequencies, with a lower fundamental frequency
( F0) of 1.39 Hz, a higher fundamental frequency (G0) of 8.37 Hz (resonance frequency G3 starting at 25.11 Hz),
and the sidebands at mG0 ± n F0 consistent with the amplitude modulation of G0 by F0. This biphonation event
Scientific Reports | (2021) 11:8762 | https://doi.org/10.1038/s41598-021-88062-5 4
Vol:.(1234567890)
www.nature.com/scientificreports/

                a 60                                             Chagos song

                                               Unit 1
                                                                     Unit 2                                      c
                             50                                                                                  Unit     Sub-unit                Features              N     Sound type
                                              sub U2
                                                                                                 Unit 3                                    ∆fu1su1 = 3.22 ± 0.01 Hz     146
         Frequency (Hz)

                                        sub U1 sub U3                                                                                       du1su1 = 3.02 ± 0.03 s      92
                             40
                                                      ∆f u1su2                                                                                   35.74 ± 0.02 Hz (73%)      Non-tonal
                                    Cfu1su1                                                                               Sub-unit 1
                                                                                                                                       Cfu1su1 = 32.47 ± 0.05 Hz (23%)     pulsed sound
                                                                                                                                                                       146
                                                        2                                                                                         38.9 ± 0.03 Hz (3%)
                             30                                  4                                                                                  29.18 Hz (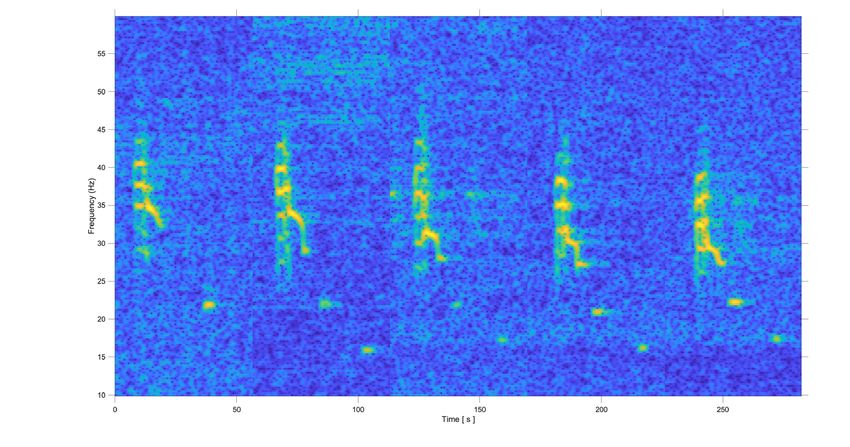
www.nature.com/scientificreports/
60
Jan - 2002 Apr- 2005 Aug- 2012 Jul - 2015 Aug- 2017
50
Frequency (Hz)
40
30
20
0
0 50 100 150 200 250
Time (s)
Figure 4. The decline in frequency of the Chagos song from 2002 to 2017: spectrogram representation of five
songs recorded at Diego Garcia in years 2002, 2005, 2012, 2015 and 2017. Spectrogram parameters: Hamming
window, 1024-point FFT length, 90% overlap.
syntax) are found42. The song variants change the order and repetition of the unit types. Here, for simplicity, we
selected and thus described only the common traditional 3-unit song (Fig. 5c).
Unit 1 was 48.83 ± 0.20 s in duration. It had 2 subunits: subunit 1 was a pulsed sound, with a pulse rate fu1su1
s
= 1.21 ± 0.01 Hz at the beginning of the subunit, pulsing accelerated to reach fu1su1 e = 1.71 ± 0.01 Hz at the
end of the unit. Following the ratio “band frequency/pulse rate” criterion, this unit is a non-tonal pulsed sound.
However, it is a biphonation sound, as higher energy bands, which do have a harmonic relationship and are
spaced by approximately 9 Hz, are obvious on the spectrogram (grey arrows on Fig. 5). The higher fundamental
frequency G0 was at ∼ 9.10 Hz. The resonance frequency of this harmonic sound was the G1u1su1. It started at
18.20 ± 0.02 Hz and ended at 18.47 ± 0.02 Hz, and was 23.85 ± 0.16 s in duration. Subunit 2 is also a biphonation
sound, with a F0 at 2.80 ± 0.03 Hz at the beginning of the unit ( fu1su2s in Fig. 5c), decreasing to 1.78 ± 0.01 Hz
at the end of the subunit ( fu1su2), which gives an impression of a decreasing pulse rate when listening to the
e
song. This change in F0 frequency creates the complicated pattern of intersecting sidebands toward the end of
unit 2. The harmonic bands are spaced by approximately 20 Hz (= G0, precise measurements are given below).
Subunit 2 had two variations: subunit 2 was continuous in 42.9% of the sampled songs, but was interrupted by a
short gap in 57.1%. In the continuous subunit case (N = 48), the fundamental frequency (G0u1su2), which is here
the band with the most energy, started at 20.22 ± 0.03 Hz and ended at 20.71 ± 0.02 Hz. The subunit lasted 23.26
± 0.2 s. In the interrupted subunit case (N = 64), the fundamental frequency (G0u1su2) started at 20.12 ± 0.03 Hz
and slightly increased to 20.44 ± 0.02 Hz over 15.27 ± 0.21 s. Then, there was a silence of 3.32 ± 0.08 s followed
by the resumption of the subunit at 20.29 ± 0.03 Hz increasing to 20.48 ± 0.17 Hz over 5.71 ± 0.17 s. In this case,
the total duration of the subunit (gap included) was 24.31 ± 0.14 s.
Unit 2 followed after 7.30 ± 0.09 s. It started as a slightly noisy pulsed sound (possibly deterministic chaos)
with a rate fu2 = 2.77 ± 0.06 Hz during 4.54 ± 0.07 s, then continued as a tonal sound with harmonics. The F0u2
started at 20.11 ± 0.06 Hz, increased to 22.61 ± 0.02 Hz over 5.14 ± 0.10 s, and then slowly increased to 23.84 ±
0.02 Hz over 23.84 ± 0.02 s. Unit 2 was 23.12 ± 0.12 s in duration.
Unit 3 followed after 24.28 ± 0.09 s of silence. It started as a tonal sound with harmonics spaced by 8.93 ±
0.05 Hz. The resonance frequency ( F1u3) started at 7.59 ± 0.02 Hz then increased to 18.26 ± 0.01 Hz over 3.76 ±
0.05 s, with the appearance of sidebands with non-harmonic relationship, spaced by fu3 = 3.19 ± 0.09 Hz. These
non-tonal pulses stopped approximately 3.5 s before the end of the unit, which ends on the harmonic sound,
slightly down swept to 18.05 ± 0.02 Hz. These sidebands could be subharmonics, (F0 /3, 2F0 /3, etc). Alternatively,
they could suggest a biphonation sound. This third unit lasted 18.82 ± 0.12 s in duration, and the whole 3-unit
song was 123.54 ± 0.29 s in duration.
Omura’s whale songs. All Omura’s whale songs showed energy between 15 and 55 Hz and peaks of energy
around 20 and 40–45 Hz (Fig. 6 lower panels).
Ascension Island Omura’s whale Omura’s whale songs recorded in 2005 off Ascension Island started as a
tonal sound at 19.84 ± 0.03 Hz. This tone was 3.21 ± 0.08 s in duration but less than 1 s after its beginning, it was
overlapped by a noisy pulsed sound, typical of deterministic chaos. The pulse rate was estimated at f = 1.44 ±
0.05 Hz. This deterministic chaos lasted for 5.20 ± 0.07 s. Finally, 2.65 ± 0.06 s after the beginning of the song,
three tonal components appeared at harmonically independent frequencies, characteristic of triphonation: two
tones starting simultaneously, one at 20.88 ± 0.02 Hz and the other at 21.85 ± 0.03 Hz, lasting respectively 4.08
Scientific Reports | (2021) 11:8762 | https://doi.org/10.1038/s41598-021-88062-5 6
Vol:.(1234567890)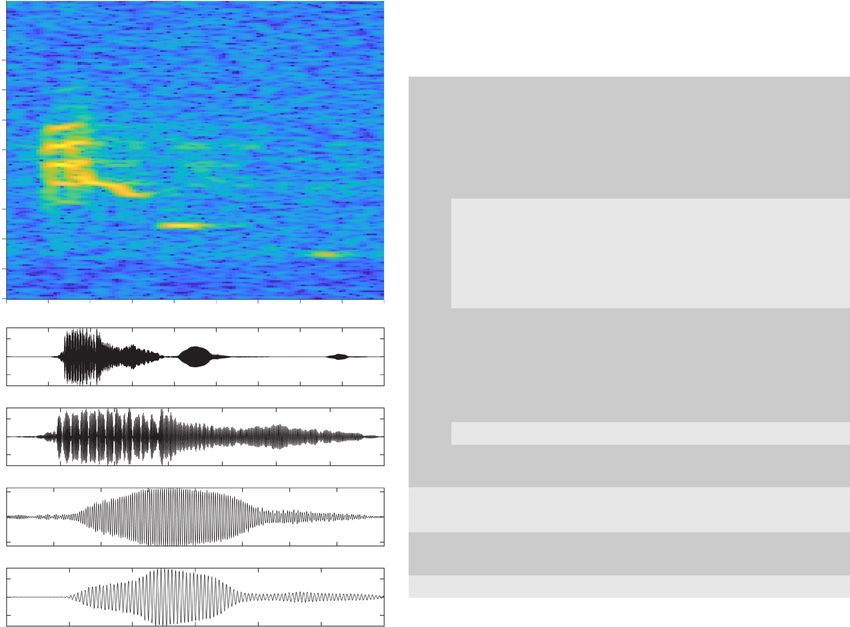
www.nature.com/scientificreports/
a Madagascan pygmy blue whale b Sri Lankan pygmy blue whale c Australian pygmy blue whale
Unit 1 Unit 2 Unit 2 Unit 3 4 Unit 1 Unit 2 Unit 3
Unit 1
60 U1 subU2 100 ∆f u3 1 2 3 U1 subU1 U1 subU2
100 U2 subU2
U1 subU1 U2 subU2
50 U2 subU1 U2 subU1
80
Frequency (Hz)
4
80
40 F5
∆f u1su1 F5 60 u2
1 2
3 u1su2
1
2 3
60 ∆f u3
30 ∆f u2su1
∆f u2su2 ∆f u2
40 ∆f eu1su2
1 2 40 ∆f su1su2
20 G3
3
Cfu1
u2su2 1 2 ∆f u1 F2
u3
20 3
G1 1 F0
10 20 u1su1 u2 F1
F0 G0
2 3
u3
u2
u1su2
0 20 40 60 80 0 20 40 60 80 100 20 40 60 80 100 120 140
d e f ∆f su1su1 ∆f e
u1su1
1 0.2 0.05
0 0
0
-0.2 -0.05
Amplitude (count)
-1 Unit 1 20 40 60 80 100 Unit 1 20 60 100 140
0 20 40 60 80 0.02
0.4 Unit 1 0 0
-0.1 -0.02
0 15 20 25 30 35 Unit 2 20 30 40 50 60
0.2 Unit 2 0.04
-0.4 0 0
15 20 25 30
-0.04
1 Unit 2 -0.2
54 58 62 66 Unit 3 70 80 90
0.2 Unit 3
0.05
0
0 0
-1 -0.2 -0.05
60 70 80 70 80 90 100 110 120 130 140
g h Time (s) i
Unit Sub-unit Features N Sound type Unit Sub-unit Features N Sound type Unit Sub-unit Features N Sound type
∆fu1su1 = 1.44 ± 0.008 Hz 85 Deterministic ∆fu1 = 3.28 ± 0.09 Hz ∆f su1su1 = 1.21 ± 0.01 Hz
Sub-unit 1
du1su1 = 4.75 ± 0.005 s 92 chaos Cfu1(1) = 29.87 ± 0.09 Hz ∆f eu1su1 = 1.74 ± 0.01 Hz
F5u1su2(1) = 35.31 ± 0.02 Hz Cfu1(2) = 29.68 ± 0.09 Hz Non-tonal Sub-unit 1 Gs1 = 18.20 ± 0.01 Hz 111 Biphonation
F5u1su2(2) = 35.31 ± 0.02 Hz Unit 1 -- Cfu1(3) = 25.85 ± 0.09 Hz 74 Ge1u1su1 = 18.47 ± 0.02 Hz
pulsed sound
Unit 1 F (3) = 35.31 ± 0.02 Hz du1(1-2) = 4.57 ± 0.06 s
u1su1
5u1su2 Tonal sound du1su1 = 23.85 ± 0.16 s
or 35.91 ± 0.05 Hz du1(2-3) = 17.68 ± 0.09 s
Sub-unit 2 92 with
[34.84 - 35.07 Hz] du1(tot) = 22.25 ± 0.11 s Unit 1 ∆f su1su2 = 2.80 ± 0.03 Hz
harmonics
du1su2(1-2) = 10.65 ± 0.13 s ∆f eu1su2 = 1.78 ± 0.01 Hz
F5u2(1) = 56.55 ± 0.12 Hz
du1su2(2-3) = 3.00 ± 0.16 s F5u2(2) = 60.63 ± 0.03 Hz Sub-unit 2 Gs0 = 20.22 ± 0.03 Hz 48 Biphonation
du1su2(tot) = 13.65 ± 0.12 s F5u2(3) = 60.80 ± 0.03 Hz Ge1u1su2 = 20.71 ± 0.02 Hz
Tonal sound u1su2
Total du1 = 18.41 ± 0.15 s 92 -- F5u2(4) = 70.17 ± 0.18 Hz du1su1 = 23.23 ± 0.20 s
Unit 2 -- 74 with
∆fu2su1 = 1.25 ± 0.017 Hz Deterministic du2(1-2) = 4.87± 0.09 s harmonics Total du1 = 48.83 ± 0.20 s 112 --
Sub-unit 1 78
du2su1 = 3.30 ± 0.003 s chaos du2(2-3) = 8.80 ± 0.09 s
92 du2(3-4) = 0.92 ± 0.06 s ∆fu2su1 = 2.77 ± 0.06 Hz 56 Deterministic
Sub-unit 1 Lorem ipsum
F0u2su2 = 1.39 ± 0.003 Hz Biphonation du2(tot) = 14.60 ± 0.07 s du2su1 = 4.54 ± 0.07 s 112 chaos
(~ amplitude
G3u2su2(1) = 25.11 ± 0.02 Hz ∆fu3 = 3.29 ± 0.12 Hz F0u2su2(1) = 20.11 ± 0.06 Hz
Unit 2 modulation F0u2su2(2) = 22.61 ± 0.02 Hz
G3u2su2(2) = 24.33 ± 0.02 Hz Cfu3(1) = 103.47 ± 0.05 Hz
of G0 by F0) Non-tonal Unit 2 F0u2su2(3) = 23.84 ± 0.02 Hz Tonal sound
Sub-unit 2 G3u2su2(3) = 23.05 ± 0.04 Hz 92 Cfu3(2) = 102.91 ± 0.03 Hz
during du2su2(1-2) pused sound Sub-unit 2 112 with
fu3(3) = 102.41 ± 0.04 Hz du2su2(1-2) = 5.14 ± 0.10 s
du2su2(1-2) = 16.04 ± 0.19 s then tonal Unit 3 -- 74 during harmonics
fu3(4) = 108.08 ± 0.06 Hz du2su2(2-3) = 17.98 ± 0.13s
du2su2(2-3) = 4.88 ± 0.11 s sound with du3(1-2) then
du3(1-2) = 4.46 ± 0.01 s du2su2(tot) = 23.12 ± 0.12 s
du2su2(tot) = 21.04 ± 0.23 s harmonics (G0) pure tone
du3(2-3) = 24.19 ± 0.14 s Total du2 = 23.12 ± 0.10 s 112 --
Total du2 = 23.63 ± 0.73 s 92 -- du3(tot) = 29.25 ± 0.10 s
F1u3(1) = 7.59 ± 0.02 Hz Tonal sound
IUI -- dIUI = 27.74 ± 0.13 s 92 -- dIUI1 = 16.45 ± 0.12 s F1u3(2) = 18.26 ± 0.01 Hz
IUI Total 74 -- with harmonics
-- dsong = 68.68 ± 0.34 s -- dIUI2 = 2.20 ± 0.06 s du3(1-2) = 3.76 ± 0.05 s
Song 92 and
Song -- dsong = 84.76 ± 0.16 s 74 -- Unit 3 -- 112
∆fu3 = 3.19 ± 0.09 Hz subharmonics
F1u3(3) = 18.05 ± 0.02 Hz (F0/3, ...)
du3(tot) = 18.82 ± 0.12 s or biphonation
dIUI1 = 7.30 ± 0.09 s
IUI -- dIUI2 = 24.28 ± 0.09 s 112 --
Song -- dsong = 123.54 ± 0.29 s 112 --
Figure 5. Spectrograms (upper panels) and waveforms (middle panels) of the song of the Madagascan, Sri
Lankan and Australian pygmy blue whales, including detailed waveforms to show the internal signal structure.
The Madagascan song was recorded off Crozet Island (CTBTO records, site H04S1) in April 2004, the Sri
Lankan song was recorded at DGN (CTBTO records, site H08N1) in April 2009 and the Australian song was
recorded at Perth Canyon in March 2008 (IMOS records). (Spectrogram parameters: Hamming window, 1024-
point FFT length, 90% overlap. Note that the axes differ among plots.) And measurements (mean ± s.e., lower
panels) of the acoustic features of the different song types. N is the number of measurements, ui suj stands for
uniti subunitj where i and j are the unit and subunit numbers, f designates the frequency difference between
the sidebands, f and d are the frequency and duration of the feature indicated in subscript, and when present,
the number in brackets refers to the point measured as indicated on the corresponding spectrogram. Fx or Gx
designate the xth harmonic of a sound, and Cf designates the carrier frequency of a sound.
± 0.23 s and 3.65 ± 0.16 s, and a third tone starting a bit later, 4.48 ± 0.07 s after the beginning of the song, at
a frequency of 47.22 ± 0.03 Hz and lasting 3.33 ± 0.09 s. The duration of the total component was 7.64 ± 0.11 s
(Fig. 6a).
Madagascan Omura’s whale song The following description of the Madagascan Omura’s whale song uses
the description provided by Moreira et al.18 and observation from the spectrogram (Fig. 6b). In 2015, Cerchio
et al. described the Madagascan Omura’s whale song recorded in 2013–2014 as a single-unit amplitude-modu-
lated low frequency vocalization, with a 15–50 Hz b andwidth15. More recently, Moreira et al. reported a 2-unit
Scientific Reports | (2021) 11:8762 | https://doi.org/10.1038/s41598-021-88062-5 7
Vol.:(0123456789)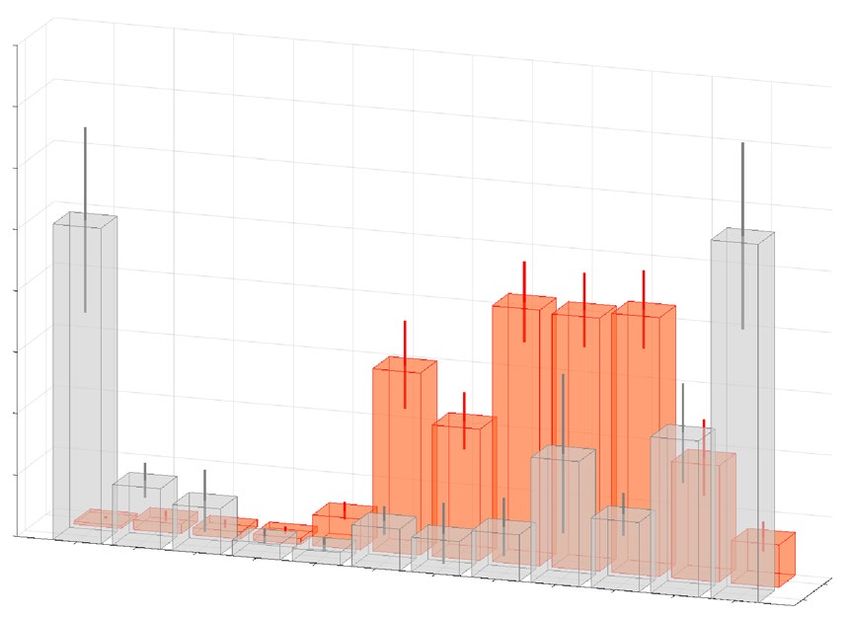
www.nature.com/scientificreports/
Ascension Island Omura’s whale Diego Garcia (DGC) Omura’s whale Madagascan Omura’s whale Australian Omura’s whale
a b c d Unit 2
Unit 1
60 60 60
Unit 1 Unit 2
60
Deterministic chaos
U2 subU1
Frequency (Hz)
U2 subU2
3
1 ∆f u2su1
40 ∆f 40 ∆f 2 40 40
∆f 1 ∆f u1
Triphonation
Triphonation 3 1
Tonal
20 2
20 20 20
sound
2
1 2
Tonal sound Tonal sound
Tonal sound 1 Tonal sound 2
0 10 20 30 0 10 20 30 0 10 20 30 0 10 20 30
Amplitude (count)
1
e 0.2 f 0.4 g 0.5
h
0 0 0 0
-0.2 -0.4 -0.5
-1
10 12 14 16 18 20 7 11 15 19 8 12 16 20 24 9 13 17 21 25
Time (s) k l
i j
Sound type Features N Sound type Features N
Sound type Features N Sound type Features N
Unit 1
Deterministic ∆f = not discernible Deterministic ∆fu1 = 1.65 ± 0.06 Hz 29
ftonal sound = 19.84 ± 0.03 Hz 1
Tonal sound 60 Tonal sound 1 f = 17.91 ± 0.03 Hz chaos d = 9.3 s chaos du1 = 6.28 ± 0.06 s 100
dtonal sound = 3.21 ± 0.08 s tonal sound 1
followed by ∆f1 = 2.09 ± 0.07 Hz 41 ftone1 = 40.04 Hz Sub-unit 1
Deterministic ∆f = 1.44 ± 0.05 Hz 31 deterministic d1 = 2.76 ± 0.06 s dtone1 = 8.7 s ∆fu2su1 = 1.80 ± 0.02 Hz 83
Unit 1
chaos d = 5.20 ± 0.07 s 60 chaos Deterministic du2su1 = 4.08 ± 0.03 s 100
ftone2 = 20.02 Hz chaos
ftone1 = 20.88 ± 0.02 Hz Pulsed sound Triphonation
53 dtone2 = 6 s 1
Unit 2
dtone1 = 4.08 ± 0.23 s with light ∆f2 = 2.21± 0.07 Hz 78 Sub-unit 2 fu2su2 (1) = 25.15 ± 0.02 Hz 100
deterministic d2 = 4.07 ± 0.05 s 79 ftone3 = 27.8 Hz du2su2 (1) = 3.28 ± 0.04 s
Triphonation ftone2 = 21.85 ± 0.03 Hz Frequency
56 chaos dtone3 = 4.3 s
dtone2 = 3.65 ± 0.16 s modulated fu2su2 (2) = 19.8 ± 0.02 Hz 98
funit 2 = 16.6 Hz
Unit 2
ftone3 = 47.22 ± 0.02 Hz ftonal sound 2 = 17.62 ± 0.04 Hz Tonal sound 1 tonal sound du2su2 (2) = 4.90 ± 0.07 s
53 Tonal sound 2
dtone3 = 3.33 ± 0.09 s dtonal sound 2 = 5.29 ± 0.12 s 80 dunit 2 = 4.9 s
IUI dIUI = 2.8 s 1 IUI dIUI = 2.53 ± 0.04 s 100
Song dsong = 7.64 ± 0.11 s 60 Song dsong = 10.56 ± 0.14 s 80
Song dsong = 10.56 ± 0.14 s 1 Song dsong = 16.39 ± 0.08 s 100
0 * * * * * * * *
m n o p
-20
Relative PSD (dB)
-40
-60
-80
-100
10 20 30 40 50 60 10 20 30 40 50 60 10 20 30 40 50 60 10 20 30 40 50 60
Frequency (Hz)
Figure 6. Spectrograms (a–d), waveforms (e–h), acoustic measurements (mean ± (s.e.)—i–l), and Power
Spectral Density (PSD—m–p) of the songs of the Omura’s whales from Ascension Island, Madagascar, Diego
Garcia and Australia. The stars on the PSD (m–p) outline the peaks of energy. The Ascension Island song was
recorded off Ascension Island (CTBTO records, site H10N1) in November 2005, the Madagascar song was
recorded off Madagascar in December 2015 and provided by S. Cerchio, the Diego Garcia DGC song was
recorded at DGN (CTBTO records, site H08N1) in October 2003 and the Australian song was recorded at
Kimberley site in March 2013 (IMOS records). For the panels (a–d) and (i–j): N is the number of measurements,
ui suj stands for uniti subunitj where i and j are the unit and subunit numbers, f designates the frequency
difference between the sidebands, f and d are the frequency and duration of the feature indicated in subscript,
and when present, the number in brackets refers to the point measured as indicated on the corresponding
spectrogram. (Spectrogram parameters: Hamming window, 1024-point FFT length, 90% overlap. Note that the
axes differ among plots).
song, with the first unit commencing as an amplitude-modulated component with bimodal energy at 20.75 Hz
and 40.04 Hz, followed by a harmonic component with a low harmonic at 20.0 Hz and an upper harmonic at
41.0 Hz, as well as an additional tone at ∼ 30 Hz. Unit 1 was characterized as sometimes followed by a tonal unit
at 16 Hz18. The ICI was 189.7 s (s.d. 16.47 s, measured from 118 series with ≥ 20 consecutive songs) and ranged
from 145.5 to 237.6 s43.
Based on the song example recorded in December 2015 in Nosy Be, Madagascar, and provided by S. Cer-
chio, we observed a 2-unit song (Fig. 6b). The first unit started as chaotic, with no visible sidebands. After ∼
3 s the signal had a bi- or triphonation event (whilst the deterministic chaos still continues), with first a tone
at 40.04 Hz, another tone with a harmonic relationship at 20.02 Hz but starting circa 2.6 s later and a third one
at 27.8 Hz starting 4.4 s after the beginning of the first tone, whilst the chaotic sound ends (the chaotic sound
lasted circa 9.3 s). The tones of the bi- or triphonic sound all ended at the same time, 11.7 s after the beginning
of the song. The second unit seems to be optional15,17,18,44. It followed after 2.8 s silence. It was a tonal sound of
Scientific Reports | (2021) 11:8762 | https://doi.org/10.1038/s41598-021-88062-5 8
Vol:.(1234567890)
www.nature.com/scientificreports/
a slight moderate strong b 1000
Chagos whale
800
Madagascan pygmy blue whale
Sri Lankan pygmy blue whale
ICI duration (s)
600
Australian pygmy blue whale
400
Madagascan Omura’s whale
Diego-Garcia DGC Omura’s whale
200
Australian Omura’s whale
Ascension Island Omura’s whale
0
80% Madagascan Australian Ascension Id Australian
0% 10% 20% 30% 40% 50% 60% 70% N = 370 Sri Lankan N = 253 Chagos N = 200 N = 130
DGC
song
Chaos persistence N = 92
N = 725
N = 300
Pygmy blue whale Omura’s whale
Figure 7. (a) Proportion of deterministic chaos (i.e., chaos persistence) in the Chagos song compared with
the three Indian Ocean pygmy blue whale song types (Madagascan, Sri Lankan and Australian) and the
four Omura’s whale song types (Madagascan, Diego-Garcia DGC, Australian and Ascension Island). Chaos
persistence is defined as the proportion of deterministic chaos across the entire song duration (given as a
percentage). Shades of grey indicate the strength of the chaos: slight (light grey), moderate (medium grey) and
strong (dark grey)). (b) Boxplot representation of the Inter-call Intervals (ICI expressed in s) for the different
song-types measured in this study. On each box, the central mark is the median, the edges of the box are the
25th and 75th percentiles, the whiskers extend to the most extreme data points considered to be not outliers,
and the outliers are plotted individually.
4.9 s in duration with a peak frequency of 16.6 Hz. (Note that the observations here are purely qualitative since
only based on 1 song).
Diego Garcia Omura’s whale song (DGC) The ‘Diego Garcia Croak’—DGC—recently attributed to the
Omura’s whales17 was comprised of one unit (Fig. 6c), although sometimes a second unit was present. The
first unit was tonal at the start, with a frequency of 17.91 ± 0.03 Hz, quickly becoming a noisy pulsed sound,
characteristic of deterministic chaos, with a pulsed rate of 2.09 ± 0.07 Hz estimated on 41 songs. This chaotic
component was 2.76 ± 0.06 s in duration to then became pulsed, although still slightly noisy, with a pulse rate
of 2.21 ± 0.005 Hz. This part showed a peak of energy around 19.46 ± 0.08 Hz, and another one around 43.51 ±
0.11 Hz (Fig. 6c, lower panel), and lasted 4.07 ± 0.05 s. Finally, the unit ended as a tonal sound at 17.62 ± 0.04 Hz
lasting 5.29 ± 0.12 s. This whole unit had a duration of 10.56 ± 0.14 s. In some occurrences (N = 12), a second
tonal unit was present after a silence of 39.89 ± 0.5 s. Unit 2 started at 13.51 ± 0.06 to 13.46 ± 0.04 Hz and lasted
for 3.81 ± 0.20 s. When the second unit was present, the entire song was 54.74 ± 0.19 s in duration. Note that in
our study, out of the 80 songs measured only 12 had unit 2.
Australian Omura’s whale song The Omura’s whale song recorded in 2013 off western Australia had two
units (Fig. 6d). Unit 1 was a noisy pulsed sound with a pulse rate of 1.65 ± 0.06 Hz with deterministic chaos,
and a duration of 6.28 ± 0.06 s.The peak in energy was at 25.32 ± 0.14 Hz followed by a gap of 2.53 ± 0.04 s, and
then a second noisy pulsed unit, with a pulsed rate of 1.80 ± 0.02 Hz estimated on 83 songs. This unit lasted 4.08
± 0.03 s and had a peak of energy at 25.25 ± 0.18 Hz and another one at 41.20 ± 0.18 Hz (Fig. 6d, lower panel).
During the last third of unit 2, the song transitioned to a tonal sound, starting at 25.15 ± 0.02 Hz and swept
down to 25.07 ± 0.02 Hz over 3.28 ± 0.04 s, then abruptly decreased to 19.8 ± 0.02 Hz and became tonal for 4.90
± 0.07 s, forming a z-shape on the spectrogram representation. The whole song was 16.39 ± 0.08 s in duration.
Deterministic chaos. We classified deterministic chaos as: ‘slight’, where sidebands were easily distinguished but
the sound was noisy; ‘moderate’, where the sidebands were visible but difficult to measure; and ‘strong’, where the
sound had no discernible structure. Where deterministic chaos was present, we identified its persistence, defined
as the proportion of deterministic chaos over the duration of a song31.
It was difficult to characterize the presence of deterministic chaos where the song (sub)unit was short and the
pulse rate was low, as it is difficult to ascertain if the noisy structure (i.e., lack of structure) was part of the whale’s
song (i.e., deterministic chaos) or whether it was due to an artefact, such as a sound propagation issue. This was
the condition for the subunit 2 of unit 1 of the Chagos song. If this subunit had indeed a chaotic structure, this
chaos was slight, and represented 4.5% of the entire duration of the song (Fig. 7a).
Pygmy blue whale songs had only slight deterministic chaos, and of the entire song, it represented: 11.7%
of the duration of the Madagascan song; 3.7% of the Australian song; and it was not present in the Sri Lankan
pygmy blue whale song (Fig. 7a). In the Madagascan pygmy blue whale songs, slight deterministic chaos was in
subunits 1 of both units 1 and 2, and in the Australian pygmy blue whale songs, deterministic chaos was present
in subunit 1 of unit 2.
In contrast, deterministic chaos was a significant proportion of all Omura’s whale songs (Figs. 6a–d and 7a).
For the song of the Ascension Island Omura’s whale, moderate deterministic chaos was present across 68% of the
duration of their song. For the Australian Omura’s whales, deterministic chaos was present across 63.2% of their
song, it was moderate-to-strong in the first unit and slight in the second unit. The Madagascan Omura’s whales
had strong deterministic chaos across 72% of their song, which excludes the tonal unit as the tonal part was not
Scientific Reports | (2021) 11:8762 | https://doi.org/10.1038/s41598-021-88062-5 9
Vol.:(0123456789)www.nature.com/scientificreports/
300 Diego Garcia North Diego Garcia South RAMA
a b c
Average number of songs per day
250
200
150
100
50
No data
0 x
2002
2004
2006
2008
2010
2012
2014
2016
2018
2002
2004
2006
2008
2010
2012
2014
2016
2018
2012
2013
Years
Figure 8. Average number of Chagos songs per day detected in each year of data on the (a) western (DGN) and
(b) eastern (DGS) sides of the Chagos Archipelago, and (c) further north-east, at RAMA site.
always present. The Diego Garcia DGC Omura’s whale song had a total chaos persistence of 65.2% (Fig. 7a),
with a moderate deterministic chaos present in the first 2.7 s of the song, which represents 26.3% of the song
duration (Fig. 7a medium grey section). The song then evolved to a more clearly pulsed sound, with a slightly
noisy structure, classified as slight deterministic chaos. Here again, it was difficult to ascertain whether this lack
of structure was a characteristic of the song or an artefact of the propagation. Yet, the slight lack of structure was
consistently observed across the sampled songs.
Inter‑call‑intervals. Whilst the Madagascan pygmy blue whale had a shorter ICI, all the other acoustic groups
studied here had a similar ICI duration (Fig. 7b). Thus, ICI is not a key parameter in the distinction among spe-
cies and cannot be used to determine whether Chagos-whales are a blue or an Omura’s whale.
Geographic distribution. Chagos song was detected at 5 of our 6 recording sites at disparate locations
across the Indian Ocean, from: the northern Indian Ocean, off Sri Lanka; on both sides of the central Indian
Ocean, off the Chagos Archipelago; and in the far eastern Indian Ocean, off northern Western Australia (Fig. 2).
The Chagos song was recorded off Sri Lanka (i.e., Trincomalee) in April. Blue whales were observed at the time
the recordings were made, and the songs of the Sri Lankan pygmy blue whale were also recorded at the time.
The acoustic recording had become degraded as they were made nearly forty years before, on 19 April 1984, and
only six distinct Chagos songs were found. Unfortunately, these recordings were of poor SNR which prevented
detailed acoustic measurement. The songs, however, had the distinct structure of the Chagos song (Fig. 3) and
an ICI of ≃ 200 s (range 200 to 209 s), consistent with the ICI rate measured for the Chagos song off the Chagos
Archipelago (Fig. 7b). Further south in the northern Indian Ocean, 6,984 Chagos songs were detected in 2013
(from January to early December) at our recording site RAMA, but no songs were detected at this site in 2012,
although recording had been made over a shorter period, from May to December, in that year. In the central
Indian Ocean, a total of 486,316 Chagos songs were detected from January 2002 to March 2014 at DGN, and
737,089 Chagos songs from January 2002 to August 2018 at DGS. In the far eastern Indian Ocean, off Kimberley,
northern Western Australia, low SNR Chagos songs were manually detected from January to May, in 41 out of
the 331 recording days in 2012–2013. In the south-central Indian Ocean, at our recording site RTJ, no Chagos
songs were detected in 2018.
Figure 8 shows the average number of Chagos songs detected per day for each year of data at the sites located
on: (a) the western (DGN); and (b) eastern (DGS) sides of the Chagos Archipelago; as well as (c) further north-
east, at RAMA site. The number of songs varied over the years; fewer songs were recorded at both DGN and DGS
sites in 2008. In comparison with the Chagos Archipelago sites, the number of songs detected at north-eastern
RAMA was low in 2013, with an average of only 20 songs/day.
Seasonality. Figure 9b shows the average seasonality of Chagos song occurrence on both sides of the Cha-
gos Archipelago. On the western side of the central Indian Ocean (DGN site), Chagos songs were heard pre-
dominantly from September to January, with detections peaking in December and January. On the eastern side
of the central Indian Ocean (DGS site), songs were detected from June to November, with detection peaks in
August to October, depending on the year. In 2013, at the RAMA site (further north-east of the Chagos Archi-
Scientific Reports | (2021) 11:8762 | https://doi.org/10.1038/s41598-021-88062-5 10
Vol:.(1234567890)www.nature.com/scientificreports/
a
60
RAMA
Seasonality of Chagos songs (%) 50
40
30
c
20
Kimberley
24
10 22
20
0
Jan Feb 18
hours/day present
Mar Apr
May Jun 16
Jul Aug
Sep Oct
Nov Dec
b 14
40
12
Average seasonlaity of Chagos songs (%)
Chagos Archipelago DGN
35 10
DGS
8
30
6
25
4
20 2
15 Dec-12 Jan-13 Feb-13 Mar-13 Apr-13 May-13 Jun-13 Jul-13 Aug-13 Sep-13
date
10
5
0
Jan Feb Mar
Apr May Jun
Jul Aug Sep
Oct Nov Dec
Figure 9. (a) Seasonality of Chagos songs at RAMA in 2013, presented as a percentage of songs per month
(i.e. monthly number of songs divided by total number of songs detected in the year); (b) Seasonality of Chagos
song averaged over the years (±SE) on the western (DGN—gray) and eastern (DGS—orange) sides of the
Chagos Archipelago. This average seasonality is calculated as such: the monthly number of songs is divided by
the total number of songs detected in the corresponding year, and averaged over the years. Note that due to
the low number of recording days at DGN in 2007 and 2014, and in 2007 at DGS, these years were removed
from the averaging (DGN: 11 years and DGS: 15.5 years); (c) Hourly presence of Chagos songs in Kimberley
(Western Australia) in 2012–2013. Note that the metric and thus the graphic representation used for this site is
different from that for RAMA and DGN/DGS: in the Kimberley data set, Chagos songs were logged upon visual
inspection of the spectrograms, and a metric of hourly presence/absence of the song per day was used (see the
Methods section for details).
Predictor variable Df Test statistic Adjusted p-value
Month 11 21.79 0.02459
Year 12 437.12 < 2e−16
Year:Month 110* 1963.07 < 2e−16
Table 1. Assessing the likelihood of an effect on the number of Chagos songs per day at site DGN (n = 3917
days). Test statistics and p-values obtained via type 1 ANOVA likelihood ratio tests from a negative binomial,
generalized additive model. p-values have also been adjusted to account for multiple hypothesis testing using
the Holm a djustment45. *Degrees of freedom are smaller than expected due to some years (n = 4) having
missing months.
pelago), Chagos songs were detected from January to June (with peaks in May), and in November (Fig. 9a). Off
Kimberley, in the north of Western Australia, low SNR Chagos songs were found from the 22 January 2012 to
the 20 May 2012, with a peak in March (Fig. 9c).
We found strong evidence at both Chagos Archipelago sites (DGN and DGS) that the number of Chagos
songs changes not only across months (Table 1; p = 0.02417, Table 2; p < 0.001) and years (Table 2; p < 0.001,
Table 2; p < 0.001), but also that there is an interaction between months and years (Table 1; p < 0.001, Table 2;
p < 0.001; Fig. 10). This provides evidence to suggest that there is variation in the pattern of whale songs across
years at both sites. Although Chagos songs were detected throughout the year, there were more songs detected
at restricted times (Fig. 10). The timing of peaks in song detection was different between the sites. At DGN most
songs were detected in 2 to 3 months, whereas at DGS songs were detected over a longer period, from 2 to 6
Scientific Reports | (2021) 11:8762 | https://doi.org/10.1038/s41598-021-88062-5 11
Vol.:(0123456789)www.nature.com/scientificreports/
Predictor variable Df Test statistic Adjusted p-value
Month 11 197.8 < 2e−16
Year 12 1077.8 < 2e−16
Year:Month 161* 4208.6 < 2e−16
Table 2. Assessing the likelihood of an effect on the number of Chagos songs per day at site DGS (n = 5557
days). Test statistics and p-values obtained via type 1 ANOVA likelihood ratio tests from a negative binomial,
generalized additive model. p-values have also been adjusted to account for multiple hypothesis testing using
the Holm a djustment45. *Degrees of freedom are smaller than expected due to some years (n = 4) having
missing months.
months. At DGN, where the Chagos song distribution in most years shows clear peaks towards December and
January, in a few years, peaks were outside this time (e.g., 2005 in March and September, 2006 in September and
2008 in July and August; Fig. 10). Conversely, in DGS most songs were observed between June and November,
although there were inter-annual differences (Fig. 10).
Discussion
We suggest that there is a previously unknown pygmy blue whale acoustic population, the Chagos blue whale, in
the central Indian Ocean. These whales migrate between the waters of the central and northeastern Indian Ocean.
The songs of the Chagos blue whale represent a large part of the soundscape in the equatorial Indian Ocean and
have done so for nearly two decades. A high number of songs detected across 17 years of continuous acoustic
data suggests that they were produced by a large number of whales, rather than by a few individuals. Until very
recently, it was believed that there was only one pygmy blue whale population, the Sri Lankan pygmy blue whale,
in the northern Indian Ocean3,7,46–49. In 2020, Cerchio et al. showed the existence of another pygmy blue whale
population in the north-western Indian Ocean. We now suggest that there is a third acoustic population, located
in the central and north-eastern Indian Ocean (Fig. 11).
Our findings support Sousa and Harris (2015) proposal that the Chagos song, which they referred to as ‘DGD’
call, is produced by a blue whale. Although we propose that rather than ‘Diego Garcia Downsweep’, or DGD call,
it is renamed as the Chagos song because it is a three-unit complex sound, repeated in sequence, rather than a true
‘downsweep.’ The comparison of the Chagos song with the Indian Ocean pygmy blue whale songs and the Omura’s
whale songs indicates that the Chagos song is likely produced by a pygmy blue whale. Although Sousa and Harris
(2015) recorded the Diego Garcia Omura’s whale (DGC) song alongside the recordings of the Chagos (DGD)
song14, we found no support for the hypothesis that the Chagos song was also produced by an Omura’s whale.
We show that the pygmy blue whale songs have a complex structure, with multiple unit types different in
nature including: simple tones to harmonic, pulsed and biphonation sounds. The structure of the pygmy blue
whale song is indeed more complex than previously described7,8,53, and perhaps this complexity is linked to their
vocal apparatus54–56. Note that such thorough description of the (blue) whale song structure is rarely undertaken
and, put in parallel with the recent knowledge about mysticete vocal apparatus54–56, may help understanding how
their songs are produced. The Chagos song shares with the pygmy blue whales the acoustic complexity, especially
in the first unit which starts pulsed, continues as a pulsed sound with a frequency upsweep, and then becomes
a tonal frequency-modulated sound. Interestingly, the first unit of the Chagos song is so similar to the first unit
of the Sri Lankan pygmy blue whale song (i.e., both are non-tonal pulsed sounds with a similar pulsed rate of ∼
3.2 Hz), that it is easy to misidentify the first unit of Chagos song with the first unit of the Sri Lankan song when
the recordings are of poor SNR. If, as suspected by Mc Donald et al., blue whales show geographic similarities
in their songs5, this might explain similarity between the first units of the Chagos and the Sri Lankan blue whale
songs and argues in favour of a blue whale source species for the Chagos song. Also, similarly to blue whale
songs, deterministic chaos was present in a small proportion of the Chagos song, and was only slight (Fig. 7).
By contrast, Omura’s whale song-types have very different features to Indian Ocean pygmy blue whales, which
seem to be highly characteristic of the Omura’s whale species (Fig. 6) and independent of their geographic origin:
their energy is distributed between 15 and 55 Hz, with a peak around 20 Hz and another one around 40–45 Hz.
The pulse rate of their pulsed units is very low (< 2.3 Hz) and unlike the blue whale songs they are all character-
ized by a high proportion of a moderate to strong deterministic chaos (> 60%). Finally, their songs are likely
to contain biphonation and even triphonation sounds with two or three very clear independent fundamental
frequencies. None of these very particular characteristics are shared by the Chagos song.
We also show that the Chagos song has been produced with a gradual frequency decline over time, for the past
two decades (Fig. 4). This progressive decline in frequency (a downwards shift) is a trait observed worldwide for
blue whale s ongs36,38,39,57,58. We argue that the frequency decline observed in the Chagos song is further support
in favour of the Chagos song being produced by a blue whale.
Allometry studies have shown a relationship between the size of an animal and their acoustic behaviour, for
example, larger mammals produce lower frequency sounds than smaller mammals, as they have a larger vocal
apparatus59,60. Although an allometric relationship has yet to be established between the source level of the sound
a mammal produces and its body size, it is likely that larger mammals, with larger vocal apparatus, are capable
of making louder sounds than smaller mammals. The Chagos song is loud (i.e., 187 ± 6 dB re:1 µPa at 1 m in the
frequency range of 15-60 H z61), well within the source level estimates reported for blue whale songs (i.e., range
from 174 to 196 dB re:1 µPa at 1 m 6,62–65). Although the source level of the Omura’s whale song is unknown,
the smaller body size of the Omura’s whale (i.e., 12 m66), similar to the Bryde’s, minke and sei whales, would
Scientific Reports | (2021) 11:8762 | https://doi.org/10.1038/s41598-021-88062-5 12
Vol:.(1234567890)www.nature.com/scientificreports/
DGN DGS
J F M A M J J A S O N D J F M A M J J A S O N D
10000 10000
2002 5000 5000 2002
0 0
10000
10000
2003 5000 5000 2003
0 0
10000
No Data
10000
2004 2004
No Data
5000 5000
0 0
2005 10000 10000
2005
5000 5000
0 0
5000
2006 5000 2006
No Data No Data No Data
0 0
2007 10000 5000 2007
5000 No Data No Data
0 0
2000 2000
2008 1000 1000 2008
Number of Chagos songs
0 0
20000
20000
2009 10000 10000 2009
0 0
20000
2010 10000
10000 2010
0 0
50000 20000
2011 10000 2011
0 0
50000 20000
2012 10000 2012
0 0
20000
20000
2013 10000
10000 2013
0 0
5000 10000
2014 No Data 5000
2014
0 0
J F M A M J J A S O N D 20000
2015 No Data 10000 2015
0
20000
2016 No Data 10000 2016
0
20000
2017 No Data 10000 2017
0
10000
2018 No Data
No Data 2018
0 x x
J F M A M J J A S O N D
Time (month)
Figure 10. Number of Chagos songs per month for each year at DGN and DGS. Note that the scale of the
y-axis differs among years to highlight the seasonal patterns. Months without data are indicated by ‘No Data’,
and months with more than 50% of missing days are indicated by a black dot.
suggest that they produce songs of similar source level (i.e., range from 147 to 169 dB re:1 µPa at 1m67–69). These
are relatively wide source level ranges, that incorporate uncertainties as well as the inter-individual variations,
however there is no overlap between the source level ranges reported for blue whales with the smaller baleen
whales. Thus, it seems safe to postulate that the high source level of the Chagos song, well within the blue whale
range, is further indication that it is produced by a large baleen whale, the size of a blue whale, rather than the
much smaller Omura’s whale.
Note that Sousa and Harris ruled out the possibility of a Bryde’s whale source species of the Chagos song,
based on the time and frequency characteristics of the s ounds14. As the vocal repertoire of the Bryde’s whale is
still not well known, one might argue that the Chagos song is part of it. However, despite the scarcity of reports
of Bryde’s whale vocalisations along with sightings, the described sounds are mostly pulses and “bursts” (often
Scientific Reports | (2021) 11:8762 | https://doi.org/10.1038/s41598-021-88062-5 13
Vol.:(0123456789)You can also read