MULTIDISCIPLINARY DRIFTING OBSERVATORY FOR THE STUDY OF ARCTIC CLIMATE (MOSAIC) FIELD CAMPAIGN REPORT
←
→
Page content transcription
If your browser does not render page correctly, please read the page content below
DOE/SC-ARM-21-007

Multidisciplinary drifting Observatory for the Study
of Arctic Climate (MOSAiC) Field Campaign Report

M Shupe        D Chu
D Costa        C Cox
J Creamean     G de Boer
K Dethloff     R Engelmann
M Gallagher    E Hunke
W Maslowski    A McComiskey
J Osborn       O Persson
H Powers       K Pratt
D Randall      A Solomon
M Tjernström   D Turner
J Uin          T Uttal
J Verlinde     D Wagner

June 2021
DISCLAIMER

This report was prepared as an account of work sponsored by the U.S.
Government. Neither the United States nor any agency thereof, nor any of
their employees, makes any warranty, express or implied, or assumes any
legal liability or responsibility for the accuracy, completeness, or
usefulness of any information, apparatus, product, or process disclosed, or
represents that its use would not infringe privately owned rights. Reference
herein to any specific commercial product, process, or service by trade
name, trademark, manufacturer, or otherwise, does not necessarily
constitute or imply its endorsement, recommendation, or favoring by the
U.S. Government or any agency thereof. The views and opinions of
authors expressed herein do not necessarily state or reflect those of the
U.S. Government or any agency thereof.
DOE/SC-ARM-21-007

Multidisciplinary drifting Observatory for the
Study of Arctic Climate (MOSAiC) Field
Campaign Report
M Shupe, University of Colorado (UC)/National Oceanic and Atmospheric
Administration (NOAA), Principal Investigator

D Chu, Los Alamos National Laboratory (LANL)
D Costa, UC/NOAA
C Cox, NOAA Physical Sciences Laboratory (PSL)
J Creamean, Colorado State University (CSU)
G de Boer, UC/NOAA
K Dethloff, Alfred Wegener Institute
R Engelmann, Leibniz Institute for Tropospheric Research
M Gallagher, UC/NOAA
E Hunke, LANL
W Maslowski, Naval Postgraduate School
A McComiskey, Brookhaven National Laboratory (BNL)
J Osborn, NOAA PSL
O Persson, UC/NOAA
H Powers, LANL
K Pratt, University of Michigan
D Randall, CSU
A Solomon, UC/NOAA
M Tjernström, Stockholm University
D Turner, NOAA Global Systems Laboratory
J Uin, BNL
T Uttal, NOAA PSL
J Verlinde, The Pennsylvania State University
D Wagner, WSL Institute for Snow and Avalanche Research SLF
Co-Investigators

June 2021

Work supported by the U.S. Department of Energy,
Office of Science, Office of Biological and Environmental Research
M Shupe et al., June 2021, DOE/SC-ARM-21-007

                                    Executive Summary
The Multidisciplinary drifting Observatory for the Study of Arctic Climate (MOSAiC) expedition
explored the coupled central arctic climate system from late September 2019 to late September 2020. The
project was based on and around the icebreaker Polarstern, as it was frozen into, and drifted with, the
arctic sea ice from the Siberian sector of the Arctic, past the North Pole, and on towards the Fram Strait.
The expedition was designed as a “sea ice Lagrangian” experiment, wherein a specific region of sea ice
was passively followed over the course of a year, serving as an integrator of thermodynamic, dynamic,
chemical, and biological interactions with the atmosphere and ocean. The overall scientific goal for the
mission was to understand the processes driving the ongoing rapid decline of sea ice as well as the
implications of those changes on the regional and global climate systems. In particular, the expedition
was constructed in a way to observe and understand the physical, chemical, and biological processes that
serve to couple and link the arctic atmosphere, sea ice, ocean, and ecosystem. Guiding science questions
for the mission include:
1. What are the seasonally varying energy sources, mixing processes, and interfacial fluxes that affect
   the heat and momentum budgets of the arctic atmosphere, ocean, and sea ice?
2. How does sea ice formation, drift, deformation, and melting couple to atmospheric, oceanic, and
   ecosystem processes?
3. What processes regulate the formation, properties, precipitation, and life time of arctic clouds and
   their interactions with aerosols, boundary-layer structure, and atmospheric fluxes?
4. How do interfacial exchange rates of biogeochemical process-related trace gases trigger the arctic
   climate system?
5. How do sea ice and pelagic ecosystems respond to changes in arctic sea ice?
6. How do ongoing changes in the arctic climate system impact large-scale heat, momentum, and mass
   fluxes and how do these changes feed back into the arctic climate and ecosystem?

Twenty nations and more than 80 world-leading institutions collaborated to manifest this major,
multi-disciplinary effort, led by the Alfred Wegener Institute from Germany. U.S. contributions were
made by the Department of Energy, National Science Foundation, National Oceanic and Atmospheric
Administration, and National Aeronautics and Space Administration. The Department of Energy
Atmospheric Radiation Measurement (ARM) user facility provided the second ARM Mobile Facility
(AMF2) as a core element of the MOSAiC atmosphere program. This user facility included
approximately 60 instruments designed to measure aerosols and gases, clouds and precipitation, the
atmospheric boundary-layer structure, and surface energy fluxes. All of these areas need additional
observations and improved understanding in a region that, thus far, has been observed infrequently,
particularly in winter. Moreover, all of these measurements contribute towards addressing key scientific
questions related to coupling between the atmosphere, sea ice, ocean, and ecosystem.

MOSAiC’s year in the arctic ice was very successful in spite of challenges associated with anomalous
atmospheric circulation, rapid ice drift, a very dynamic ice pack, and a global pandemic. In spite of these
challenges, the expedition returned home with a wealth of new observations that will serve the research
community for decades. This data will serve as a foundation for model evaluation and improvement,
supporting improved climate predictions, weather forecasts, and ecosystem assessments.

                                                     iii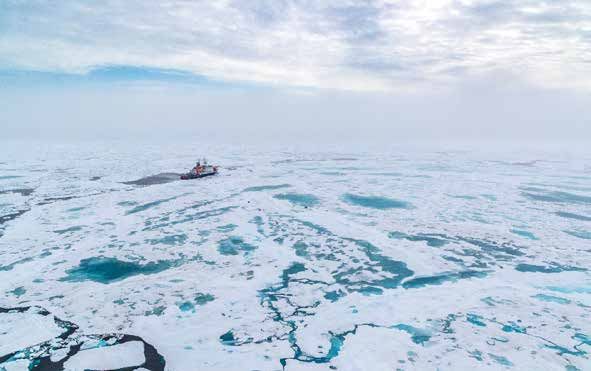
M Shupe et al., June 2021, DOE/SC-ARM-21-007

            Acronyms and Abbreviations
AGU      American Geophysical Union
AMF2     second ARM Mobile Facility
AOS      Aerosol Observing System
ARM      Atmospheric Radiation Measurement
ASR      Atmospheric System Research
ATMOS    MOSAiC atmospheric team
AWI      Alfred Wegener Institute
CIRES    Cooperative Institute for Research in Environmental Sciences
CPC      condensation particle counter
DOE      U.S. Department of Energy
MOSAiC   Multidisciplinary drifting Observatory for the Study of Arctic Climate
NASA     National Aeronautics and Space Administration
NOAA     National Oceanic and Atmospheric Administration
PI       principal investigator
PWD      present weather detector
SWE      snow water equivalent
TROPOS   Leibniz Institute for Tropospheric Research

                                     iv
M Shupe et al., June 2021, DOE/SC-ARM-21-007

                                                                   Contents
Executive Summary ..................................................................................................................................... iii
Acronyms and Abbreviations ...................................................................................................................... iv
1.0 Background........................................................................................................................................... 1
       1.1 The Changing Arctic .................................................................................................................... 1
       1.2 The MOSAiC Expedition ............................................................................................................. 1
       1.3 ARM’s Role in MOSAiC ............................................................................................................. 4
2.0 Notable Events or Highlights ............................................................................................................... 7
       2.1 Highlight by Leg .......................................................................................................................... 7
    2.2 AMF2 Operations and Challenges ............................................................................................. 12
3.0 Results ................................................................................................................................................ 14
4.0 Public Outreach .................................................................................................................................. 19
       4.1 Web Presence ............................................................................................................................. 19
       4.2 Press Conferences ...................................................................................................................... 20
       4.3 Media.......................................................................................................................................... 20
       4.4 Video .......................................................................................................................................... 20
       4.5 Education.................................................................................................................................... 21
    4.6 Public Outreach .......................................................................................................................... 21
5.0 MOSAiC Publications ........................................................................................................................ 21
       5.1 Journal Articles/Manuscripts...................................................................................................... 21
       5.2 Meeting Abstracts/Presentations/Posters ................................................................................... 22
6.0 References .......................................................................................................................................... 24

                                                                              v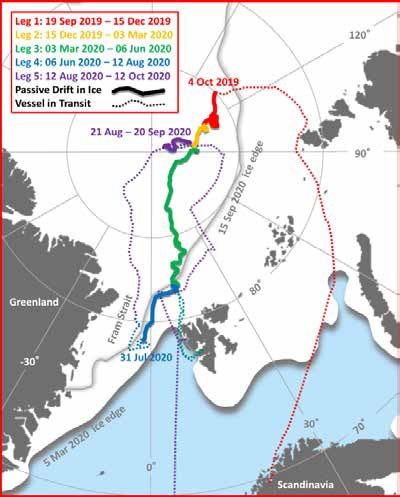
M Shupe et al., June 2021, DOE/SC-ARM-21-007
Figures
1 Polarstern embedded in sea ice, with key installation locations annotated. .......................................... 3
2 The MOSAiC Expedition route, including the passive drift of the MOSAiC ice floe (solid) with
dates of drift annotated, and the transit movements of Polarstern (dashed) delineated by legs
(colors).................................................................................................................................................... 4
3 Estimates of regional annual mean arctic energy fluxes over a mostly ice-covered Arctic Ocean
assuming a cylinder over the Arctic at ~70˚ N. ...................................................................................... 5
4 Leg 1 ARM team including the Principal Investigator (PI) pictured at Met City with ARM
radiation and precipitation equipment as polar night has descended on MOSAiC. ............................... 8
5 Polarstern bow with ARM laboratory containers and equipment visible, including installations
above the bridge. .................................................................................................................................... 9
6 Met City, and ARM’s on-ice installations, cut off from Polarstern in April. ...................................... 10
7 A view of the MOSAiC ice floe during Leg 4, with the on-ice installations visible in the middle
of the photograph, and the Polarstern in the background. ................................................................... 11
8 Re-installing equipment on the ice during Leg 5. ................................................................................ 11
9 Quicklook plots produced by the ARM Data Quality Office for 13 October to 13 November
2019 of unfiltered particle concentrations from the CPC onboard Polarstern. .................................... 15
10 Retrieval of the cloud type classification during 13-16 July using the Cloudnet algorithm applied
by TROPOS. ......................................................................................................................................... 16
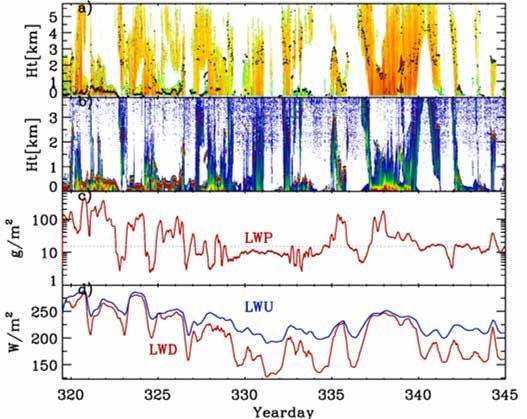
11 Observations from October into November of 2019, including a) cloud radar reflectivity, b) lidar
backscatter, c) liquid water path derived from microwave radiometers, and d) surface
downwelling (red) and upwelling (blue) longwave radiation............................................................... 17
12 Relationships between net surface longwave radiative flux and the subsurface conductive heat
flux, sensible heat flux, and near-surface temperature gradient. .......................................................... 17
13 Cumulative snowfall, in mm of SWE, from multiple ARM sensors, derived from the ARM
KAZR, snow depth measurements along multiple transects on the sea ice, and from the ERA5
reanalysis product. ................................................................................................................................ 18
Tables
1 ARM instruments deployed during MOSAiC. ..................................................................................... 12
vi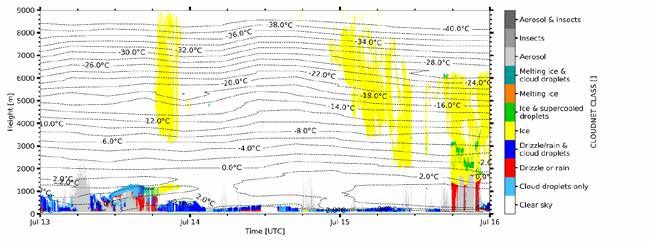
M Shupe et al., June 2021, DOE/SC-ARM-21-007

1.0    Background

 1.1 The Changing Arctic
 The Arctic is rapidly changing, and these changes have substantial societal relevance. First, arctic change
 is a leading sign of global change, as the warming observed in the Arctic is 2-3 times faster than observed
 across the rest of the globe (Overland et al. 2019). This so-called arctic amplification is due to numerous
 feedbacks, including those linked to the declining sea ice. Broad arctic changes are also hypothesized to
 be related to shifts in large-scale circulation patterns that may have implications for mid-latitude weather
 (Cohen et al. 2020) and ocean circulation (Sévellec et al. 2017). Arctic change is further affecting the
 oceans through acidification that threatens food supplies (Qi et al. 2017). Declining sea ice also opens the
 Arctic for new resource development, shipping routes, tourism, and other commercial activities. Lastly,
 the changing Arctic is a hotbed for geopolitical challenges as nations vie for influence and control of this
 resource-rich and newly accessible region. Clearly the Arctic and its changes are playing a huge role in
 our Earth both from a geophysical and socio-political standpoint.

 To navigate, manage, and respond to the challenges associated with arctic change requires a vastly
 improved understanding of the coupled arctic system, and the drivers and implications of these changes. It
 is essential to better understand the physical basis for why the arctic sea ice is declining, the associated
 feedbacks that work to amplify or modulate this decline, and the myriad ways that the Earth system is
 responding. As a result of these changes and uncertainties, there are increasing societal needs for
 improved model predictive skill in the Arctic, to address pressing gaps in global climate prediction, to
 advance forecast skills for regional and hemispheric weather and sea ice, and to ensure robust ecosystem
 models that realistically link physical and biological systems. To fulfill these core needs requires new,
 sophisticated, and cross-cutting observations within the rapidly changing arctic ice pack.

 1.2 The MOSAiC Expedition
 In response to these needs, an international consortium of world-leading arctic researchers, institutions,
 and funding agencies developed and implemented the Multidisciplinary drifting Observatory for the
 Study of Arctic Climate (MOSAiC), which is the most comprehensive study of the central arctic system
 to date. The core scientific question guiding MOSAiC is: What are the causes and consequences of an
 evolving and diminished arctic sea ice cover? Inherent in this question, it is clear that sea ice is the nexus
 of interest and that the scientific exploration will examine the processes driving sea-ice change, and the
 implications of that change on other aspects of the Arctic and global systems. Embedded underneath this
 leading question is a set of more targeted questions that serve to organize MOSAiC’s research and
 illustrate a multidisciplinary approach towards developing the comprehensive understanding that is
 needed. These questions include:
 1. What seasonally varying energy sources, mixing processes, and interfacial fluxes affect the heat and
    momentum budgets of the arctic atmosphere, ocean, and sea ice?
 2. How does sea ice formation, drift, deformation, and melting couple to atmospheric, oceanic, and
    ecosystem processes?

                                                        1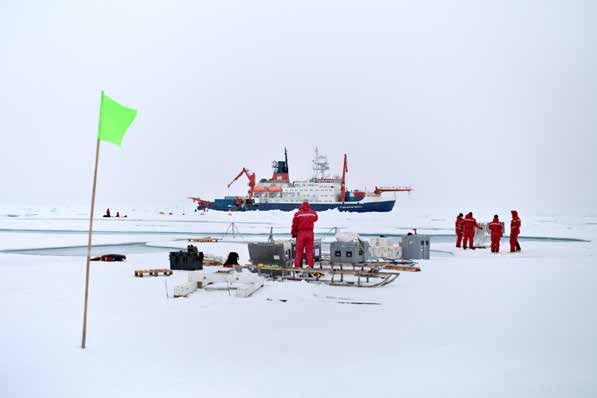
M Shupe et al., June 2021, DOE/SC-ARM-21-007

3. What processes regulate the formation, properties, precipitation and life time of arctic clouds and
   their interactions with aerosols, boundary-layer structure, and atmospheric fluxes?
4. How do interfacial exchange rates of biogeochemical process- related trace gases trigger the arctic
   climate system?
5. How do sea ice and pelagic ecosystems respond to changes in arctic sea ice?
6. How do ongoing changes in the arctic climate system impact large-scale heat, momentum, and mass
   fluxes and how do these changes feed back into the arctic climate and ecosystem?

All of these questions are motivated by important modeling needs and seek to draw together the
observations and analyses that will lead to model advancement. To address these questions, MOSAiC was
designed to examine the physical, chemical, and biological processes that serve to couple the arctic
atmosphere, sea ice, ocean, and ecosystem.

The multi-scale design of MOSAiC was centered around the research vessel Polarstern, a German
icebreaker from the Alfred Wegener Institute (AWI), which served as the leading institution for the
project. Polarstern was embedded within the arctic sea ice to serve as a base of operations for the project
and a stable platform for a wide variety of scientific activities, including onboard observing systems,
laboratories, and facilities to support the scientific participants (Figure 1). Adjacent to Polarstern on the
sea ice was an ice camp called the Central Observatory, all within about 2 km of the vessel. Within the
Central Observatory was a network of pathways, power lines, and scientific installations, laid out in a
manner to minimize the impacts of the vessel on the measurements and to enable direct access to the
undisturbed arctic atmosphere, sea ice, ocean, and ecosystem. One of the major on-ice installations was
called Met City, containing a wide range of atmospheric and other measurements, and was typically about
400-500 m away from the ship. Collectively the Polarstern and Central Observatory were designed to
intensively sample and measure the arctic system from the ocean, through the ice, and into the
atmosphere, including coupled processes. At this scale, the observations are appropriate for direct
comparison and research using high-resolution and single-column models. Extending out to further scales,
the Distributed Network comprised numerous semi-autonomous stations and buoys installed at scales of
5-40 km away from Polarstern in all directions. Many of these stations included coupled observations of
the atmosphere, sea ice, and ocean. Observations made across the Distributed Network were designed to
provide important perspectives on spatial gradients and heterogeneity within the system, on scales that are
relevant to examine sub-grid variability in large-scale models. These MOSAiC observations were then
linked with other observations across the Arctic at land-based stations, from other vessels, from aircraft,
and from satellites.

                                                      2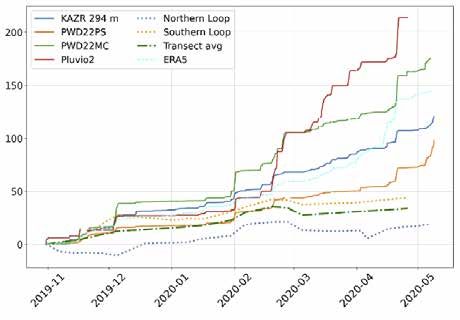
M Shupe et al., June 2021, DOE/SC-ARM-21-007

          Figure 1.   Polarstern embedded in sea ice, with key installation locations annotated.

This collection of observational assets was installed into the Siberian sector of the arctic sea ice in
October 2019 and left to drift with the ice as it traveled along the Transpolar Drift, heading near the North
Pole and then towards Fram Strait (see Figure 2). This design is effectively a “sea-ice Lagrangian” design,
tracking a region of ice as it undergoes transitions over the course of a full year through interactions with
the atmosphere and ocean. In this case the ice serves as an integrator as it responds to thermodynamic and
dynamic forcing from the atmosphere and ocean over the course of the year. During this drifting year,
multiple re-supply missions were conducted using partner vessels wherein personnel, fuel, food, and other
supplies were transferred. Overall there were five legs of the mission. Due to rapid drift of the
observational constellation, related to an anomalous large-scale circulation pattern in early 2020, the
Polarstern reached the edge of the sea ice at the end of July (Leg 4) and was subsequently repositioned
back near the North Pole to complete the full year. The mission finished its scientific observations in late
September 2020 before leaving the sea ice.

Scientific participation in MOSAiC came from 20 different nations and more than 80 world-leading
institutions. The United States had major contributions from the U.S. Department of Energy (DOE), the
National Science Foundation, the National Oceanic and Atmospheric Administration, and the National
Aeronautics and Space Administration. Of particular interest for this report is the DOE Atmospheric
Radiation Measurement (ARM) user facility’s contribution, which was the single largest scientific project
and a major foundation for the MOSAiC atmospheric (ATMOS) team. For MOSAiC, ARM contributed
the second ARM Mobile Facility (AMF2), which included an extensive suite of instruments to measure
the atmospheric state, clouds, precipitation, aerosols, radiation, and more, including two guest aerosol
measurement systems. In addition to the ARM contribution, the DOE Atmospheric System Research
(ASR) program is supporting a collection of scientific research projects designed to capitalize on these
unique measurements towards advancing our knowledge.

                                                      3
M Shupe et al., June 2021, DOE/SC-ARM-21-007
Figure 2. The MOSAiC Expedition route, including the passive drift of the MOSAiC ice floe (solid)
with dates of drift annotated, and the transit movements of Polarstern (dashed) delineated by
legs (colors).
1.3 ARM’s Role in MOSAiC
The involvement of ARM in MOSAiC was guided by a collection of scientific foci that comprise an
important contribution to the overall MOSAiC Science Plan by specifically examining essential
atmospheric processes. As context, it is informative to consider the fluxes of energy through the arctic
system that impact the changing sea ice. Figure 3 provides observational estimates of regional energy
fluxes for an ice-covered Arctic Ocean system, the relative importance of the different processes, and the
intricate coupling among the processes. It is notable that the atmospheric terms are large and dominated
by radiative fluxes. For context on this system it is important to consider that an estimated excess of
~1 W/m2 in the net annual surface energy flux over the past 30 years can account for the observed
reduction in sea ice extent and mass (Kwok and Untersteiner 2011). This excess is small relative to the
uncertainties inherent in most fluxes in Figure 3, related to spatial/temporal variability and measurement
error, as well as the potential trends in many of these terms.
4M Shupe et al., June 2021, DOE/SC-ARM-21-007
Figure 3. Estimates of regional annual mean arctic energy fluxes over a mostly ice-covered Arctic
Ocean assuming a cylinder over the Arctic at ~70˚ N.
While it is clear that atmospheric energy fluxes are critically important for the energy budget of sea ice,
many processes controlling these fluxes, and their interactions are poorly understood and represented in
numerical models. This is particularly true in the sea ice environment due to a serious lack of
process-level observations. Specific processes that control the flow of energy through the system are the
target for the AMF2 deployment through intensive atmosphere and coupled-system observations in the
central arctic ice pack. Primary research themes guiding ARM’s involvement include: the surface energy
budget, clouds and precipitation, aerosols, and boundary-layer structure. Each of these interrelated themes
is briefly outlined here, starting with a list of relevant science questions and the overall science goal that
the ARM measurements are particularly well positioned to address.
Surface Energy Budget
Ø What is the annual evolution of the surface energy budget over young sea ice?
Ø What key process interactions determine the surface energy budget?
v GOAL: Comprehensive observations to close the surface energy budget and understand its
variability in all seasons.
The surface energy budget is one of the primary factors controlling the area and mass distributions of
central arctic sea ice. It comprises large and variable downwelling longwave radiation, persistent radiative
cooling from the surface, seasonal solar radiation, much of which is reflected by the bright surface,
turbulent heat fluxes, and energy passing through the sea ice via transmission and conduction
(e.g., Persson et al. 2002). To understand the net impact on sea-ice mass, it is important to understand
how energy is partitioned into these different components as a function of time. Each term has important
scales of variability in space and time related to solar cycles, surface changes, meteorology, and others.
Similarly, the different components interact. For example, enhanced downwelling longwave radiation due
to clouds can warm the surface and elicit a surface cooling response via enhanced radiative cooling,
sensible heat, and/or conductive heat fluxes. The magnitudes of these responses to the initial forcing are
determined by other environmental properties such as the surface-layer stability or snow depth.
Additionally, key feedback processes, such as the ice-albedo feedback, are essential features of the arctic
5M Shupe et al., June 2021, DOE/SC-ARM-21-007
system leading to amplified change. These feedbacks and process interactions, particularly over a
distribution of thin sea ice, must be understood so they can be correctly represented in coupled models.
Clouds and Precipitation
Ø What factors determine arctic cloud phase partitioning?
Ø What role do clouds and precipitation play in determining low-level atmospheric structure?
Ø How does surface inhomogeneity influence the spatial structure of cloud-precipitation
systems?
v GOAL: Full characterization of microphysical, macrophysical, and spatial structure of
clouds and precipitation over a continuous year.
Clouds have two competing effects on the radiative balance at the surface: (a) trapping longwave
radiation leading to a net surface warming and (b) reflecting solar radiation leading to a net cooling. The
balance of these effects depends on environmental conditions (sun angle, surface albedo, and
temperature) and cloud properties (phase, microphysics). Phase in particular has been shown to be a
primary driver of the surface radiation balance (Shupe and Intrieri 2004). Clouds are also a vehicle for
precipitation, which is an essential aspect of atmospheric moisture and surface mass budgets. While some
progress has been made on understanding the common arctic stratiform clouds, substantial work is still
needed to develop a representative understanding of cloud-scale processes associated with phase
partitioning that can be reproduced by models (Morrison et al. 2012). Moreover, relatively little is
understood about the spatial organization and energetics of deeper precipitating cloud systems and their
net impact on the surface. Changes in cloudiness as a result of broader arctic change can elicit different
responses in the surface energy and mass budgets depending on when they occur. The ultimate role that
clouds play in the observed regional changes in sea ice is yet to be determined, but requires a more
detailed understanding of the processes through which clouds form, transform, and interact with the
surface and atmosphere.
Aerosols
Ø How do aerosol physical, chemical, and optical properties over sea ice vary seasonally?
Ø What sources and transport patterns cause variability in arctic aerosol?
Ø What are the radiative and cloud-nucleating properties of the aerosol?
v GOAL: Produce the first annual cycle characterization of central arctic aerosol physical,
chemical, optical, and cloud-active properties, including source attribution.
Aerosols play two important roles in the climate system: 1) Direct impacts on atmospheric radiation; and
2) Indirect impacts on radiation and precipitation by influencing cloud formation and microphysical
composition. Arctic aerosols are complex due to marked temporal and vertical variability, and disparate
potential origins (e.g., Quinn et al. 2009). Chemical and physical properties dictate the ultimate impacts of
aerosols on radiation and clouds, and these depend on source regions, which can range from locally
produced marine biogenic species to long-range transport of biomass burning and anthropogenic
particulate matter (Saha et al. 2010). The interplay of large-scale meteorology with the persistent,
near-surface arctic inversion affects the mixing state, aging, and vertical structure of aerosol and its
distribution across the Arctic. The role of black carbon in the arctic system is not well understood and
likely changing with enhanced access to the Arctic. Overall, with so little known about central arctic
6M Shupe et al., June 2021, DOE/SC-ARM-21-007
aerosols, there is the opportunity for significant advances in even the most basic level of understanding,
which will provide major constraints on how central arctic aerosols are represented in models.
Boundary-Layer Structure
Ø What are the properties and effects of stably stratified turbulence in the lower atmosphere?
Ø What are the effects of a thinned ice cover on low atmospheric stability and heat fluxes?
Ø How do surface- and cloud-driven dynamics impact the low atmosphere structure?
v GOAL: Annual cycle assessment of boundary-layer stability, the processes that erode it,
and the resulting vertical structure.
Two unique properties of the arctic atmosphere are a persistent temperature inversion and frequent stable
stratification within the atmospheric boundary layer. These features can occur throughout the year, while
stable boundary layers are particularly frequent and long-lived during the arctic night due to the lack of a
diurnal cycle to force shallow convection (e.g., Zhang et al. 2011). Periodic destabilizing influences
include cloud-driven dynamics, large-scale baroclinicity, and surface heterogeneities such as leads.
Boundary-layer processes are the links that connect the local sea-ice system with the free troposphere,
which is itself the primary conduit to the large-scale, global climate system. These processes, which may
be changing as a result of thinning ice pack, control how energy and mass are transferred, interact with
radiation and are important for cloud formation, impact the vertical atmospheric structure including the
distribution of aerosol, impact momentum transfer to the surface, and modulate the surface energy budget.
Moreover, these interactions are critical in the hemispheric linkages between arctic change and the global
system. Formulations of boundary-layer turbulent processes used in numerical models rely on empirical
relationships, yet often struggle to achieve a realistic balance between mixing and growth of surface
stable layers.
2.0 Notable Events or Highlights
The MOSAiC year in the arctic sea ice was a tremendous experience for all involved, with unique and
notable events throughout the year that provide important context for the measurements made and the
science they will support. Each leg of the MOSAiC expedition brought its own interesting highlights.
There are also several overall operational highlights for the AMF2.
2.1 Highlight by Leg
LEG 1 − Installation. In preparation for the start of MOSAiC, the AMF2 facility was installed over the
course of a couple of weeks onboard Polarstern. The ARM installation (see Figure 1) included six sea
container units on Polarstern’s bow, housing a wide range of remote sensors and a full Aerosol
Observing System (AOS) for sampling aerosols and gases. ARM equipment was also installed on
Polarstern’s P-deck, offering a clear view of the atmosphere in multiple directions. Once Polarstern
arrived within the ice pack and selected the MOSAiC ice floe, installations were also set up on the sea ice.
ARM had a presence at the Met City site with where precipitation and radiation instruments were
installed at some distance from Polarstern (Figure 4). Most installations went exceedingly smoothly,
considering the overall challenging and remote conditions. Moreover, the arctic winter descended quickly
on the expedition, with 4 months of continual darkness starting in later October. During this first phase of
the expedition there was a notable storm in the middle of November, bringing high winds and leading to
7M Shupe et al., June 2021, DOE/SC-ARM-21-007
the first major fractures of the sea ice through the camp. As a result of these ice dynamics, the MOSAiC
and ARM teams learned a great deal about how to support measurements on the ice in spite of a moving
surface.
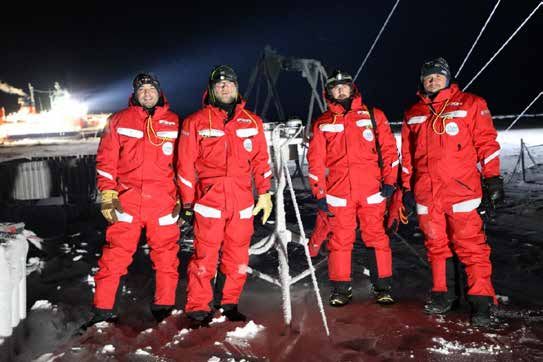
Figure 4. Leg 1 ARM team including the Principal Investigator (PI) pictured at Met City with ARM
radiation and precipitation equipment as polar night has descended on MOSAiC. Photo:
Matthew Shupe.
LEG 2 − Winter. In mid-December a new set of personnel came to support the expedition through the
heart of the dark winter season. While at the MOSAiC ice floe, this crew did not see the sun, with
sunlight only greeting them as they were on their voyage home in March. Leg 2 was relatively uneventful
compared to the rest of the year. A late February storm represented the second-lowest pressure minimum
observed during the year, with persistent high winds and a significant mid-winter warming of ~10˚ C
relative to temperatures over the preceding month. Additionally, during these early months of 2020, the
arctic region experienced record high positive values of the Arctic Oscillation Index, consistent with a
strong polar vortex, the largest ozone hole observed to date in the Arctic, and anomalous winds near the
surface that pushed the MOSAiC drift rapidly along its drifting course. See Figure 5 for a picture of ARM
installations onboard Polarstern.
8M Shupe et al., June 2021, DOE/SC-ARM-21-007
Figure 5. Polarstern bow with ARM laboratory containers and equipment visible, including
installations above the bridge. Early March 2020. Photo: Michael Gutsche.
LEG 3 − Rising Sun. As the sun rose again after the arctic winter, Leg 3 began with an extended
high-pressure, clear-sky period and the coldest near-surface temperatures observed for the year at
-42.3 ˚C. Within a few weeks the transition from complete darkness to 24 hours of sunlight was complete.
The continued high Arctic Oscillation Index meant very fast drift with a lot of ice dynamics that
threatened operations at times (Figure 6), even leading to one ARM instrument being damaged by ridging
sea ice. In mid-April, a warm air intrusion represented a major shift from temperatures consistently below
-25 ˚C to those consistently warmer than -15 ˚C, and pushed the system towards the melt onset. This shift
occurred as a result of a transition in the dominant large-scale circulation pattern and a breakdown of the
influence of the polar vortex on the near-surface environment. Leg 3 was extended due to the COVID-19
pandemic and challenges with implementing the original resupply plan. As a result, Polarstern had to
leave the ice to enable a rotation of crew, necessitating the removal of most equipment from the ice
during the transition.
9M Shupe et al., June 2021, DOE/SC-ARM-21-007
Figure 6. Met City, and ARM’s on-ice installations, cut off from Polarstern in April. Photo:
Christopher Cox.
LEG 4 – Summer Melt. After rotating crew near Svalbard, Polarstern headed back to the MOSAiC ice
floe, identifying a remnant and robust section of the floe on which to re-establish the Central Observatory.
The melt season had started by this point, with significant snow melt leading to the formation of melt
ponds on the surface (Figure 7). MOSAiC and ARM measurements at this time were able to document
the atmospheric influences on variability of the surface energy budget, which controlled the speed and
extent of melt. Key transitions during this leg included the complete melt of the snow, the formation of
melt ponds, and the growth and drainage of melt ponds. Melt also revealed a great deal of sediment
embedded within the sea ice, impacting the surface albedo. With persistent drift towards the south over
the preceding months, the MOSAiC ice floe was much further south than initially planned, and by the end
of July the ice floe reached the ice edge in the Fram Strait. With impeccable timing, all equipment was
again de-installed from the sea ice and brought onboard Polarstern about one day prior to the complete
disintegration of the original MOSAiC ice floe.
LEG 5 − Freeze Up. The final leg of the expedition required taking Polarstern back north into the ice
pack near the North Pole to finish out the year. A suitable ice floe was identified, and for the third time, a
Central Observatory was established on the ice (Figure 8), this time to capture the energy transitions
leading to freeze up of the surface. Freezing started to occur, but an early September storm brought warm
air that halted the freeze up temporarily. Thereafter, melt ponds began to freeze over, and some of the
season’s first snowfall helped to diminish the surface albedo and push the system permanently back
towards freeze. By late September 2020, after nearly a full year in the arctic ice, all equipment was again
packed onboard Polarstern and the journey home began.
10M Shupe et al., June 2021, DOE/SC-ARM-21-007
Figure 7. A view of the MOSAiC ice floe during Leg 4, with the on-ice installations visible in the
middle of the photograph, and the Polarstern in the background. Photo: Lianna Nixon.
Figure 8. Re-installing equipment on the ice during Leg 5. Photo: Michael Gallagher.
11M Shupe et al., June 2021, DOE/SC-ARM-21-007
2.2 AMF2 Operations and Challenges
Operations of ARM equipment were generally robust and continuous, with relatively few failures or
interruptions. Since most ARM instruments were installed onboard Polarstern, they did not suffer from
the on-ice challenges related to ice dynamics, which periodically interrupted power. Additionally, most
onboard instruments were able to continue operating even when Polarstern was underway during the
transitions between Legs 3-4 and Legs 4-5. As a result, ARM’s skilled onsite technicians maintained
impressively continuous operations of most equipment for the duration of MOSAiC, in spite of the often
extreme conditions. See summary in Table 1. A few key limitations to the data set did occur, including:
• The scanning X-band radar failed prior to full installation and was never operational.
• The 3-channel microwave radiometer struggled to operate and was not very continuous in time,
although measurements from the 2-channel microwave radiometer were much more reliable.
• The micropulse lidar failed in the beginning of September, about 3 weeks prior to the end of field
operations.
• The aerosol chemical speciation monitor suffered a number of issues that led to very low sensitivity
in an already challenging arctic environment and it is not yet clear if there is any recoverable or useful
information.
• Precipitation: One Altar shield for a precipitation gauge was destroyed by sea ice ridging; however,
the instrument itself was recovered and still used.
• Met City instruments: The radiation and precipitation suites installed on the sea ice suffered a few
periodic power outages as ice dynamics, or polar bears, would lead to interruption of line power from
Polarstern.
In addition to generally robust operations in the field, ARM is serving as a model for how to collect,
quality control, process, and archive data. Most of ARM’s data is already publicly available in the ARM
Data Center, while a great deal of collaborating MOSAiC data is not yet publicly released (all MOSAiC
data must be publicly released by 1 January 2023). This open approach that ARM takes as a DOE user
facility promotes the broad dissemination and use of the data for many applications and by many
stakeholders, and is helping to grow the MOSAiC user community.
Table 1. ARM instruments deployed during MOSAiC. Unless otherwise noted, all instruments were
installed onboard Polarstern. A general assessment of data quality is given (green: mostly
good; yellow: use caution; red: data problems). All aerosol and gas measurements are marked
yellow due to periodic contamination by local pollution, although most instruments operated
well when not sampling pollution.
Instrument Measurement and/or Derived Parameters
Radiosondes Pressure, temperature, relative humidity, winds, 4-daily launched from
ship (contribution to AWI-led effort)
Sky-viewing broadband radiometer suite Downwelling broadband solar and terrestrial radiation, direct and
diffuse solar partitioning, sky infrared temperature, deployed on sea ice
Sky-viewing broadband radiometer suite Downwelling broadband solar and terrestrial radiation, two systems
12M Shupe et al., June 2021, DOE/SC-ARM-21-007
Instrument Measurement and/or Derived Parameters
Surface-viewing broadband radiometer Upwelling broadband solar and terrestrial radiation, infrared surface
suite temperature, deployed on sea ice
Multifilter rotating shadowband Upwelling irradiance at 6 wavelengths, deployed on sea ice
radiometer
Marine atmospheric emitted radiance Spectral infrared radiation (sky, surface), trace gas and cloud properties
interferometer
Sun photometer Solar irradiance & sky radiance at 6 wavelengths, fixed pointing zenith
Beam-steerable radar wind profiler Wind profiles, typically below 4 km
Doppler lidar Wind profiles, vertical velocity, turbulent dissipation rate, below 1 km
Ceilometer Backscatter, cloud base height
Micropulse lidar Backscatter, depolarization; profiles of cloud and aerosol properties
High-spectral-resolution lidar Backscatter, depolarization; profiles of cloud and aerosol properties
Ka-band ARM Zenith Radar Doppler radar moments and spectra, profiles of cloud properties
Marine W-band ARM Cloud Radar Doppler radar moments and spectra, profiles of cloud properties
Ka-band Scanning ARM Radar Doppler radar moments, spatial cloud distribution and properties
X-band Scanning ARM Radar Doppler radar moments, spatial cloud distribution and properties
Total sky imager Visible hemispheric sky images, cloud coverage
Microwave radiometer, 2-channel Sky brightness temperature; integrated water vapor & liquid water path
Microwave radiometer, 3-channel Sky brightness temperature; integrated water vapor & liquid water path
Present weather detector Precipitation occurrence and intensity, on ship and on sea ice
Laser disdrometer Precipitation and particle size distribution, on ship and on sea ice
Weighing bucket rain gauge Precipitation occurrence and mass, on sea ice
Siphon rain gauge Precipitation occurrence and mass, on ship
Condensation particle counter Two systems: Total particle concentration >10 nm and >3 nm
Scanning mobility particle sizer Particle size distribution 10-500 nm
Ultra-high-sensitivity aerosol Particle size distribution 50-1000 nm
spectrometer
Humidified tandem differential mobility Mass, size, and particle size distribution as a function of relative
analyzer humidity, hydroscopicity
Cloud condensation nucleus counter CCN concentration, supersaturation of 0.4% and scanning from 0-0.8%
Aerosol chemical speciation monitor Mass spectrum, particle composition
Single-particle soot photometer Black carbon mass concentration
Nephelometer Light scattering at dry relative humidity at 3 wavelengths
Particle soot absorption photometer Light absorption at 3 wavelengths
13M Shupe et al., June 2021, DOE/SC-ARM-21-007
Instrument Measurement and/or Derived Parameters
Total aerosol filter sampler Aerosol loadings for offline ice nucleating particle analysis, offline
DNA sequencing (Guest instrument: Colorado State Univ.)
Davis rotating-drum unit for monitoring Size-resolved aerosol loadings for offline ice nucleating particle
analysis, 3 bins 0.15-12 µm (Guest instrument: Colorado State Univ.)
Davis rotating-drum unit for monitoring Size-resolved aerosol loadings, offline single-particle morphology and
elemental composition (Guest instrument: Univ. Michigan)
Ozone monitor Ozone concentration
Trace gas monitor Carbon monoxide, nitrous oxide, and water vapor concentration
3.0 Results
Scientific research using ARM’s observations from MOSAiC is just starting, but early insights into the
data suggest exciting and interesting future outcomes. A few examples are provided here.
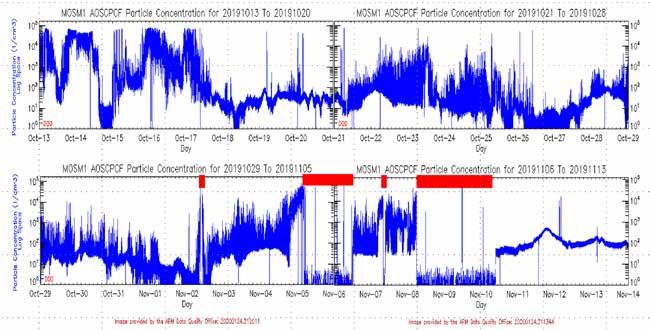
Aerosol variability. Relatively few observations exist of aerosols over the central arctic ice pack,
particularly in the winter season. Early observations of particle number concentrations from the MOSAiC
autumn transition into winter (Figure 9) demonstrate a very wide range and highlight some of the
interesting features and challenges associated with aerosol measurements in this environment. First, there
were numerous periods when the total particle concentration from the condensation particle counter
(CPC) exceeded 104 cm-3. These periods were influenced directly by local emissions from the Polarstern
itself during unfavorable winds. At times a back-pressure purge was applied to the aerosol inlet,
preventing samples of ship emissions (red bars in Figure 9), but there were also plenty of these periods
that were not purged (e.g., 13-17 October). Currently several groups are working to identify and
characterize the impacts of ship pollution on the aerosol data sets.
In addition to these measurement challenges, the timeseries reveals some very interesting temporal
variability. Typically, the timeseries, when not impacted by ship emissions, shows particle concentrations
ranging from 50-2000 cm-3; this is a common range for the arctic atmosphere. However, there are periods,
such as 18 October, 25-27 October, and 1-2 November, when the particle concentration dipped well
below 10 cm-3. These exceedingly clean conditions are likely due to long airmass trajectories within the
Arctic with few local sources of additional aerosol but a steady sink of aerosol due to wet and dry
deposition. Under these conditions, it is likely that aerosol availability limits cloud formation
(e.g., Mauritsen et al. 2011), with potential implications for the surface energy budget at this important
time of year.
14M Shupe et al., June 2021, DOE/SC-ARM-21-007
Figure 9. Quicklook plots produced by the ARM Data Quality Office for 13 October to 13 November
2019 of unfiltered particle concentrations from the CPC onboard Polarstern.
A number of other aerosol-related studies are underway with ARM- and DOE-supported measurements
from MOSAiC. These include filter-based offline analysis of particle composition, the first annual cycle
of near-surface ice nucleating particle concentrations, a detailed assessment of the impact of local
pollution on aerosol timeseries, temporal variability in cloud condensation nucleus concentrations, and
more. One paper has been submitted by colleagues at the Leibniz Institute for Tropospheric Research
(TROPOS) that examines aerosols from wildfires with potential impacts on clouds
(Engelmann et al. 2021). In addition to these current research efforts, there is a great deal of potential
within the ARM measurements to better understand the origins of arctic atmospheric particles and how
aerosol concentrations are influenced by air mass processes, boundary-layer dynamics, cloud interactions,
and other factors.
Clouds and Cloud-Surface Interactions. ARM measurements are very well suited to examine detailed
cloud properties and processes, and their interactions with the surface through radiation and dynamics.
The ARM Ka-band Zenith Radar (KAZR) data has been incorporated into the Cloudnet cloud retrieval
package to provide a time series of vertical classifications of cloud type, cloud microphysics, and
numerous other properties (see Figure 10). These cloud properties are useful for examining processes and
for evaluating models.
15M Shupe et al., June 2021, DOE/SC-ARM-21-007
Figure 10. Retrieval of the cloud type classification during 13-16 July using the Cloudnet algorithm
applied by TROPOS. This classification uses the ARM KAZR data in addition to other data
from collaborating institutions.
Detailed cloud measurements from autumn 2019 (Figure 11) reveal the complexity of cloud types
observed over MOSAiC, including classic shallow mixed-phase clouds (i.e., days 321-323) and deep
storms with significant precipitation (i.e., days 336-340), among many others. The complementary nature
of ARM measurements enables a straightforward assessment of cloud phase and a clear identification of
the presence of supercooled liquid water (e.g., Shupe 2007). Consistent with previous arctic observations
made at ARM’s North Slope of Alaska site and elsewhere, a clear bimodal state of surface longwave
radiation is driven by the presence, or absence, of these liquid-containing clouds. When liquid is present,
the net surface longwave radiation is small (i.e., downwelling nearly matches upwelling). However, when
liquid-containing clouds are absent, the atmospheric emitted radiation is significantly decreased relative
to surface cooling, and there is a deficit of 40 to 60 W/m2 of longwave radiation at the surface (i.e.,
Figure 11d). Detailed cloud observations of this type will be the foundation for numerous large-eddy
simulation model studies to examine the formation, evolution, and impacts of arctic mixed-phase clouds.
MOSAiC’s detailed observations provide additional insight into how these cloud-driven radiative states
impact other surface energetic terms. Initial relationships (Figure 12) show that in response to cloud
radiative warming in winter, the surface sensible heat flux responds by cooling the surface by ~10 W/m2.
The remaining energy goes into increasing the surface temperature by an average of 7 ˚C, which impacts
near-surface stratification, while also diminishing the upward conduction of heat from the warm ocean to
the ice surface. Based on measurements at multiple sites, it is clear that snow depth modifies these
processes locally, and importantly modulates the amount of heat conducted through the sea ice. Overall,
these cloud-driven processes modify the temperature structure of the sea ice (not shown), while
inhibitions of conductive heat flux diminish the heat lost at the bottom of the ice, which is responsible for
ice growth. Many of these surface energetic process relationships, such as that between net longwave
radiation and sensible heat flux, are being used to perform a process-based assessment of many arctic
regional and global models in coordination with the World Meteorological Organization Polar Prediction
Project’s Year of Polar Prediction.
16M Shupe et al., June 2021, DOE/SC-ARM-21-007
Figure 11. Observations from October into November of 2019, including a) cloud radar reflectivity, b)
lidar backscatter, c) liquid water path derived from microwave radiometers, and d) surface
downwelling (red) and upwelling (blue) longwave radiation.
Figure 12. Relationships between net surface longwave radiative flux and the subsurface conductive heat
flux, sensible heat flux, and near-surface temperature gradient. The two states including cloud
liquid water (“Cloudy”) and not including cloud liquid water (“Clear”) are highlighted.
17M Shupe et al., June 2021, DOE/SC-ARM-21-007
Precipitation. Measurements of snowfall are difficult due to the slow fall speeds of snowflakes relative to
the effects of horizontal winds, as well as the complicating effects of blowing snow relative to falling
snow. To help constrain snowfall at MOSAiC, ARM deployed numerous sensors for measuring snow,
including laser disdrometers, present weather detectors (PWD), and a Pluvio2 weighing gauge, both
onboard Polarstern and at Met City on the sea ice. Additionally, ARM’s KAZR radar can be used to
derive snowfall via reflectivity-based retrievals (e.g., Matrosov 2007). Through a partnership with the
Swiss Federal Institute for Forest, Snow, and Landscape Research, an assessment of ARM’s various
snowfall estimates was conducted through comparison with estimates of the surface snow water
equivalent (SWE) derived from physical samples, manual measurements of density, and transects of snow
depth. The analysis incorporated additional measurements of near-surface winds and particle
concentrations to assess the potential role of blowing snow and snow redistribution on the comparisons of
snowfall over the winter accumulation season.
Results of this snow analysis (Figure 13; Wagner et al. 2021), when also considering erosion of snow
from the surface, suggest that the PWD that was mounted onboard the Polarstern was potentially the
most accurate measure of snowfall reaching the surface, in part because this sensor was installed at a
relatively high altitude that likely limited the adverse impacts of blowing snow. Additionally, the
radar-based retrieval of snowfall also proved to be quite reliable, likely also because of the higher altitude
of derived snowfall. Beyond a simple assessment of methods, this study also provided an important,
process-based perspective on snow over the MOSAiC winter that included documenting the impact of
storms on snow accumulation, blowing snow and erosion of the surface, compaction, and other processes.
For example, it is estimated that at certain times of the year at least 50% of the atmospheric snowfall is
eroded away over time, which has an important implication on the potential insulative effects on the sea
ice. Beyond this observational analysis, these results have also contributed to a model-based paper that
examines the spatial distribution and re-distribution of snow on sea ice (Hames et al. 2021).
Figure 13. Cumulative snowfall, in mm of SWE, from multiple ARM sensors, derived from the ARM
KAZR, snow depth measurements along multiple transects on the sea ice, and from the ERA5
reanalysis product. Note that the transect SWE values can be affected by erosion of snow
during wind events, particularly in the spring. Figure from Wagner et al. (2021).
18M Shupe et al., June 2021, DOE/SC-ARM-21-007
Boundary-Layer Processes. Multiple groups are engaged in studies of the atmospheric boundary layer
and its interactions with the surface, including studies that use ARM measurements as well as
measurements from collaborating projects. These studies include the use of both uncrewed aircraft
systems and tethered balloons (both from collaborating projects) to examine detailed boundary-layer
structure, its relation to cloudiness, its impact on atmospheric turbulent mixing, and its influence on
surface energy fluxes. Additionally, an international team is developing a comprehensive view of
boundary-layer winds during MOSAiC. This effort will incorporate ARM’s beam-steerable radar wind
profiler and Doppler lidar, both of which performed better than expected in this environment, where
signals are typically weak. These wind measurements will help to examine processes such as the
formation of low-level jets, and can also be coupled to surface momentum flux estimates to quantify the
atmospheric forcing of ice motion. Looking in more detail at this surface interaction, one research team is
leveraging ARM observations to study how this atmospheric forcing affects mesoscale sea ice dynamics,
including the relation between divergence in the atmosphere and ice pack. Lastly, ARM boundary-layer
measurements are contributing to preliminary modeling studies of the low-atmosphere structure, both
during the very stable conditions experienced at times in winter, and during spring and summer when
leads in the ice can modify surface turbulent heat exchange and might have implications for atmospheric
mixing and moisture.
4.0 Public Outreach
For many reasons, MOSAiC has been a tremendous opportunity for public outreach through numerous
channels and to many communities. The Arctic itself is an extreme and photogenic location, with amazing
natural scenes, adventurous experiences, and exciting science, all of which is appealing and compelling to
a broad audience. Additionally, the international nature of MOSAiC also broadened the base of interest.
As such a large, international project, there was a lot of emphasis on outreach including dedicated
outreach coordination efforts through a collaboration between the expedition’s lead institution (AWI) and
PI Shupe’s team at the Cooperative Institute for Research in Environmental Sciences (CIRES) at the
University of Colorado and the National Oceanic and Atmospheric Administration (NOAA). These
various avenues for outreach fall into the following categories.
4.1 Web Presence
The main MOSAiC web page (http://www.mosaic-expedition.org) was initially built and maintained by
PI Shupe, but was eventually handed off to AWI for further development and management. This web
page provides extensive details about the project and had a nice map feature during the field year where
the public could follow the progress of Polarstern as it drifted across the Arctic, including daily updates
on field conditions, an updated blog posting, and relevant photos. An additional web site was established
at the University of Colorado (http://mosaic.colorado.edu), primarily as a source of information on
MOSAiC-related education and outreach activities. MOSAiC activities have also been featured
prominently on the ARM web page via many articles and photo collections that highlighted numerous
MOSAiC participants and their science, including (partial list):
• https://www.arm.gov/news/features/post/52304
• https://www.arm.gov/news/blog/post/54709
• https://www.arm.gov/news/blog/post/58450
19You can also read