Overview of the SLOPE I and II campaigns: aerosol properties retrieved with lidar and sun-sky photometer measurements
←
→
Page content transcription
If your browser does not render page correctly, please read the page content below
Atmos. Chem. Phys., 21, 9269–9287, 2021
https://doi.org/10.5194/acp-21-9269-2021
© Author(s) 2021. This work is distributed under
the Creative Commons Attribution 4.0 License.

Overview of the SLOPE I and II campaigns: aerosol properties
retrieved with lidar and sun–sky photometer measurements
Jose Antonio Benavent-Oltra1,2,3 , Juan Andrés Casquero-Vera2,3 , Roberto Román4 , Hassan Lyamani2,3 ,
Daniel Pérez-Ramírez2,3 , María José Granados-Muñoz2,3 , Milagros Herrera5 , Alberto Cazorla2,3 , Gloria Titos2,3 ,
Pablo Ortiz-Amezcua2,3,6 , Andrés Esteban Bedoya-Velásquez3,7 , Gregori de Arruda Moreira3,8 , Noemí Pérez9 ,
Andrés Alastuey9 , Oleg Dubovik5 , Juan Luis Guerrero-Rascado2,3 , Francisco José Olmo-Reyes2,3 , and
Lucas Alados-Arboledas2,3
1 Department    of Civil, Chemical and Environmental Engineering, University of Genoa, Genoa, Italy
2 Department    of Applied Physics, Universidad de Granada, Granada, Spain
3 Andalusian Institute for Earth System Research, IISTA-CEAMA, Granada, Spain
4 Group of Atmospheric Optics (GOA-UVa), Universidad de Valladolid, Valladolid, Spain
5 Laboratoire d’Optique Atmosphérique (LOA), UMR8518 CNRS, Université de Lille, Villeneuve D’ASCQ, France
6 Institute of Geophysics, Faculty of Physics, University of Warsaw (IGFUW), Warsaw, Poland
7 The French Aeorospace Lab, ONERA, Toulouse, France
8 Federal Institute of São Paulo (IFSP), Campus Registro, São Paulo, Brazil
9 Institute of Environmental Assessment and Water Research (IDAEA), CSIC, Barcelona, Spain

Correspondence: Jose Antonio Benavent-Oltra (jbenavent@ugr.es)

Received: 22 January 2021 – Discussion started: 5 February 2021
Revised: 7 May 2021 – Accepted: 12 May 2021 – Published: 17 June 2021

Abstract. The Sierra Nevada Lidar aerOsol Profiling Exper-          The statistical analysis of aerosol optical and microphys-
iment I and II (SLOPE I and II) campaigns were intended to       ical properties, both column-integrated and vertically re-
determine the vertical structure of aerosols by remote sens-     solved, from May to July 2016 and 2017 shows a large vari-
ing instruments and test the various retrieval schemes for ob-   ability in aerosol load and types. The results show a strong
taining aerosol microphysical and optical properties with in     predominance of desert dust particles due to North African
situ measurements. The SLOPE I and II campaigns were de-         intrusions. The vertically resolved analysis denotes a decay
veloped during the summers of 2016 and 2017, respectively,       of the atmospheric aerosols with an altitude up to 5 km a.s.l.
combining active and passive remote sensing with in situ         Finally, desert dust and biomass burning events were cho-
measurements at stations belonging to the AGORA obser-           sen to show the high potential of GRASP to retrieve verti-
vatory (Andalusian Global ObseRvatory of the Atmosphere)         cal profiles of aerosol properties (e.g. absorption coefficient
in the Granada area (Spain). In this work, we use the in situ    and single scattering albedo) for different aerosol types. The
measurements of these campaigns to evaluate aerosol prop-        aerosol properties retrieved by GRASP show good agree-
erties retrieved by the GRASP code (Generalized Retrieval        ment with simultaneous in situ measurements (nephelome-
of Atmosphere and Surface Properties) combining lidar and        ter, aethalometer, scanning mobility particle sizer, and aero-
sun–sky photometer measurements. We show an overview of          dynamic particle sizer) performed at the Sierra Nevada Sta-
aerosol properties retrieved by GRASP during the SLOPE I         tion (SNS) in Granada. In general, GRASP overestimates the
and II campaigns. In addition, we evaluate the GRASP re-         in situ data at the SNS with a mean difference lower than
trievals of total aerosol volume concentration (discerning be-   6 µm3 cm−3 for volume concentration, and 11 and 2 Mm−1
tween fine and coarse modes), extinction and scattering co-      for the scattering and absorption coefficients. On the other
efficients, and for the first time we present an evaluation of   hand, the comparison of GRASP with airborne measure-
the absorption coefficient.                                      ments also shows an overestimation with mean absolute dif-

Published by Copernicus Publications on behalf of the European Geosciences Union.
9270                                                 J. A. Benavent-Oltra et al.: Overview of the SLOPE I and II campaigns

ferences of 14 ± 10 and 1.2 ± 1.2 Mm−1 for the scattering           ficient data (Veselovkii et al., 2015; Ortiz Amezcua et al.,
and absorption coefficients, showing a better agreement for         2020). As an alternative, during the last few years, several
the absorption (scattering) coefficient with higher (lower)         synergetic retrievals algorithms have been developed to re-
aerosol optical depth. The potential of GRASP shown in this         trieve aerosol optical and microphysical properties combin-
study will contribute to enhancing the representativeness of        ing data from sun–sky photometers and backscatter lidar
the aerosol vertical distribution and provide information for       measurements, such as LIRIC (LIdar-Radiometer Inversion
satellite and global model evaluation.                              Code) by Chaikovsky et al. (2016) and Granados-Muñoz
                                                                    et al. (2020) and GARRLiC (Generalized Aerosol Retrieval
                                                                    from Radiometer and Lidar Combined data) by Lopatin et
                                                                    al. (2013). One of the most popular advanced inversion algo-
1   Introduction                                                    rithms is the Generalized Retrieval of Atmosphere and Sur-
                                                                    face Properties code (GRASP; Dubovik et al., 2011, 2014). It
The characterization of atmospheric aerosol optical and mi-         should be noted here that GARRLiC is a branch of GRASP.
crophysical properties is difficult due to their high spatial and   The versatility of GRASP allows the retrieval of aerosol
temporal variability in the atmosphere. This, together with         vertical and surface properties combining different types of
the complexity of the aerosol–radiation interaction (scatter-       measurements, such as sun photometers, lidar, ceilometers,
ing and absorbing incident solar and outgoing thermal radi-         satellite, sky cameras, and nephelometers (e. g. Lopatin et al.,
ation) and cloud–aerosol interaction (modifying cloud prop-         2013; Espinosa et al., 2017; Román et al., 2017; Torres et al.,
erties), results in a large uncertainty in the radiative forcing    2017; Benavent-Oltra et al., 2017; Titos et al., 2019, Herreras
of climate due to aerosols (IPCC, 2013).                            et al., 2019; Dubovik et al., 2019). The aerosol properties re-
   During the last few decades, several field campaigns have        trieved by GRASP have been evaluated in previous works
been carried out for studying atmospheric aerosol properties        using the volume concentration provided by the LIRIC al-
(e.g. Tanré et al., 2003; Mallet et al., 2016; Veselovskii et       gorithm (differences ∼ 20 %; Benavent-Oltra et al., 2017) as
al., 2016; Vandenbussche et al., 2020) using observatories          reference and the backscatter and extinction coefficients cal-
with in situ measurements and that are included in global           culated with Klett–Fernald and Raman methods (differences
networks based on passive and active remote sensing instru-         below 30 %; Benavent-Oltra et al., 2017, 2019; Tsekeri et
ments, such as the AERosol RObotic NETwork (AERONET;                al., 2017). In addition, the GRASP retrievals have been used
Holben et al., 1998) and European Aerosol Research LIdar            to evaluate forecast models as constraints for global models
NETwork (EARLINET; Pappalardo et al., 2014). On one                 and as inputs for radiative transfer models (e.g. Tsekeri et
hand, the in situ ground-based observatories only represent a       al., 2017; Chen et al., 2018, 2019; Granados-Muñoz et al.,
limited atmospheric sample in the layer closest to the surface.     2019). It is important to explore the potential of these kinds
Passive remote sensing instruments, such as sun–sky pho-            of algorithms by applying them to different input data and for
tometers or satellites, provide aerosol properties in the entire    different atmospheric conditions. In this regard, the exten-
atmospheric column, while they have very limited informa-           sive measurement dataset obtained during the Sierra Nevada
tion about variations within the column. Hence, vertically re-      Lidar aerOsol Profiling Experiment I and II (SLOPE I and
solved aerosol observations are needed to discern between           SLOPE II) campaigns in May, June, and July of 2016 and
the different aerosol layers and to study their radiative prop-     2017, respectively, allows an evaluation of the atmospheric
erties. In this regard, lidar systems are used for aerosol op-      aerosol properties retrieved by the GRASP code combining
tical and microphysical properties profiling. Basic lidar sys-      lidar and sun–sky photometer measurements. This database
tems only have information on the backscatter elastic signals       was successfully utilized in several previous studies of the
that allow the retrieval of the aerosol backscatter coefficient     atmospheric aerosol (e.g. de Arruda Moreira et al., 2018,
(β) vertical profiles using the Klett–Fernald method (Fer-          2019; Bedoya-Velásquez et al., 2018; Horvath et al., 2018;
nald et al., 1972; Fernald, 1984; Klett, 1981, 1985) assum-         Casquero-Vera et al., 2020).
ing a constant aerosol lidar ratio (LR). However, advanced             The main objective of this work is to provide an overview
lidar systems provide information on the backscatter elastic        of the aerosol optical and microphysical properties during
and inelastic signals allowing the retrieval of vertical profiles   the SLOPE I and II campaigns using the GRASP code. We
of aerosol backscatter and extinction (α) coefficients using        checked the GRASP retrievals against the in situ measure-
the Raman technique (e.g. Ansmann et al., 1992; Whiteman            ments performed at the Sierra Nevada Station (SNS, Spain;
et al., 1992). These measurements allow for the retrieval of        2500 m a.s.l.) and instrumented flights. This is the first long-
particle vertical microphysical properties by inversion algo-       term evaluation of GRASP that combines sun–sky photome-
rithms using the 3β + 2α configuration (e.g. Müller et al.,         ter and multi-wavelength lidar measurements to retrieve pro-
1999; Böckmann, 2001; Veselovskii et al., 2002).                    files of aerosol intensive properties separately for both fine
   The main drawback of these algorithms is the scarcity of         and coarse modes instead of only one mode such as when us-
Raman lidar measurements during the daytime, which rep-             ing ceilometer measurements (e.g. Román et al., 2018; Titos
resents a limitation to the retrievals of the extinction coef-      et al., 2019). In addition, a statistical analysis of both to-

Atmos. Chem. Phys., 21, 9269–9287, 2021                                               https://doi.org/10.5194/acp-21-9269-2021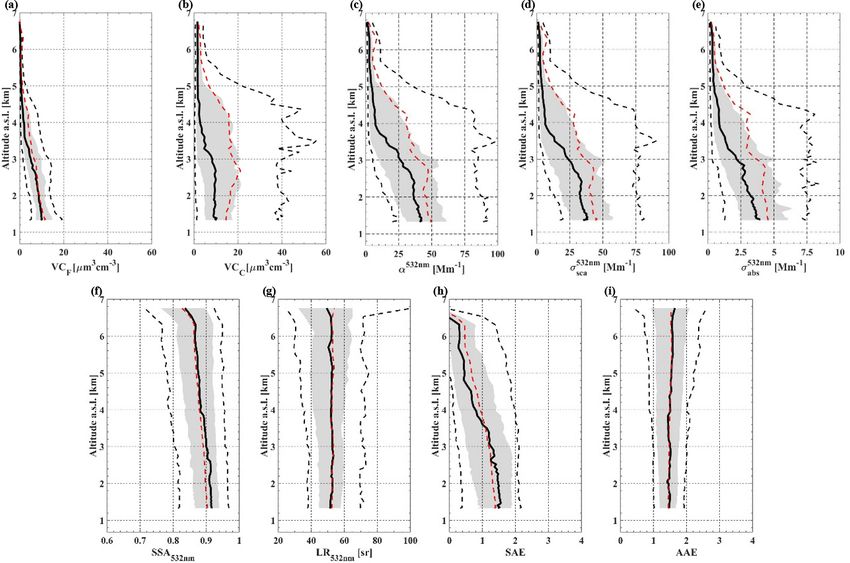
J. A. Benavent-Oltra et al.: Overview of the SLOPE I and II campaigns 9271
tal column and vertically resolved aerosol properties is per-
formed, and two extreme events of desert dust and biomass
burning are evaluated.
2 Sites and measurements
The SLOPE I and II campaigns took place in Granada
(Spain) during the summers of 2016 and 2017 and were
designed to determine the vertical structure of aerosols by
remote sensing instruments through the application of var-
ious retrieval schemes for obtaining aerosol microphysical
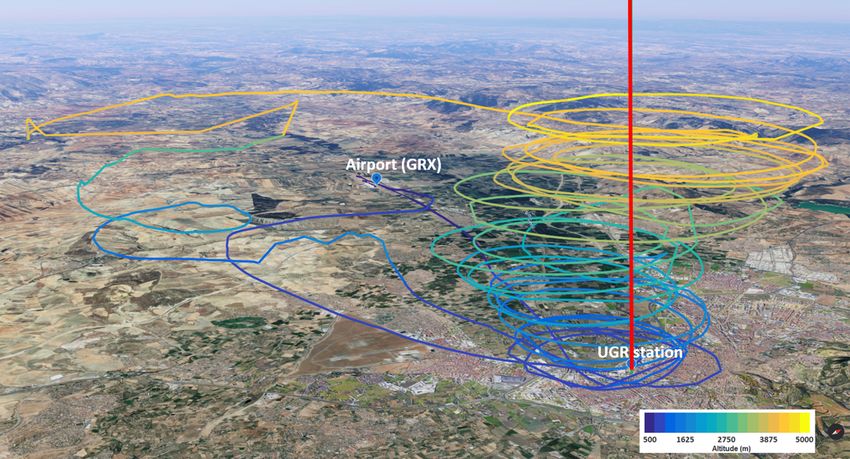
and optical properties. The main objective of this campaign Figure 1. Map illustrating the UGR station. The coloured line indi-
was to perform a closure study by comparing remote sens- cates the trajectory of the aircraft and its altitude during the SLOPE
II campaign. The red line indicates the vertical of the lidar measure-
ing system retrievals of atmospheric aerosol properties with
ments. © Google Earth.
various in situ measurements (Román et al., 2017; Benavent-
Oltra et al., 2019). The study area typically presents vari-
able aerosol loads and type, with a large presence of an-
thropogenic aerosols mainly in winter (e.g. Lyamani et al., been included in EARLINET since 2005 and contributes
2010; del Aguila et al., 2018; Casquero-Vera et al., 2021), to the ACTRIS research infrastructure. This instrument is
frequent Saharan dust intrusions (e.g. Pérez-Ramírez et al., composed of a Nd : YAG pulsed laser that emits at 1064 nm
2012; Valenzuela et al., 2012), and primary aerosols associ- (110 mJ per pulse), 532 nm (65 mJ per pulse), and 355 nm
ated with the local phenology (Cariñanos et al., 2020). The (60 mJ per pulse). The detection branch has seven channels:
region is often affected by episodes of aerosol stagnation due four to measure the backscattered light at 355, 532 (paral-
to its complex geography (e.g. Lyamani et al., 2010), while lel and perpendicular components), and 1064 nm; two chan-
Atlantic air masses are usually responsible for cleaning the nels at 353.9 and 530.2 nm (387 and 607 nm until Decem-
atmosphere (Pérez-Ramírez et al., 2016). ber 2016; Ortiz-Amezcua et al., 2020) for the detection of
During SLOPE I and II, the instrumentation was de- Raman scattering from N2 , and one channel to detect the
ployed at the three stations of the AGORA (Andalusian water vapour Raman scattering at 408 nm. More informa-
Global ObseRvatory of the Atmosphere) observatory. The tion on this instrument can be found in Guerrero-Rascado
main AGORA station is in the Andalusian Institute for et al. (2008, 2009) and Ortiz-Amezcua et al. (2020).
Earth System Research/IISTA-CEAMA (UGR; 37.16◦ N, Each AGORA station is equipped with a sun–sky pho-
3.61◦ W; 680 m a.s.l.) in the city of Granada. The UGR sta- tometer CE-318 (Cimel Electronique S.A.S.) that operates in
tion operates many remote sensing and in situ instruments, the AERONET network. This instrument performs measure-
mostly in the framework of ACTRIS (Aerosols, Clouds, ments of sun direct irradiance, which is used to derive the
and Trace gases Research InfraStructure Network, https:// aerosol optical depth (AOD) usually at 340, 380, 440, 500,
www.actris.eu/, last access: 11 June 2021) research infras- 675, 870, and 1020 nm, and sky radiance in almucantar con-
tructure. The other two AGORA observatory stations are figuration at 440, 675, 870, and 1020 nm. The instrument at
in the Sierra Nevada Mountain range Cerro Poyos (CP; the UGR station and SNS during SLOPE I and II was the
37.11◦ N, 3.49◦ W; 1820 m a.s.l.) and the Sierra Nevada Sta- sun–sky–lunar photometer Cimel CE318-T, which also per-
tion (SNS; 37.10◦ N, 3.39◦ W, 2500 m a.s.l.). The SNS is lo- forms lunar direct irradiance measurements to retrieve the
cated ∼ 20 km south-east of Granada city and 1.8 km above AOD during the nighttime between the first and third Moon
the UGR station (see Fig. 1 in Herreras et al., 2019 for de- quarters (e.g. Barreto et al. 2016, 2019; Román et al., 2020).
tails). During the SLOPE field campaigns, a large set of in In this work, we used AERONET Version 3 Level 1.5 (cloud-
situ instrumentation was deployed at the SNS and on board screened) data (e.g. Giles et al., 2019; Sinyuk et al., 2020).
the Partenavia P68 aircraft. The in situ measurements al- The ground-based MWR (RPG-HATPRO G2, Radiome-
lowed the validation of aerosol optical and microphysical ter physics GmbH) located at the UGR station as part of
properties obtained by remote sensing techniques at the UGR the MWRnet (Rose et al., 2005; Caumont et al., 2016) is
station. Table 1 summarizes the main instrumentation oper- used here for retrieving temperature profiles. MWR is a pas-
ating at the UGR station, the SNS, and on board the aircraft. sive remote sensor that performs unattended measurements
of the temperature brightness of oxygen and water vapour
2.1 Remote sensing instrumentation in the atmosphere. The oxygen is measured in the K-band
(51–58 GHz) and the water vapour in the V -band from 22
The UGR station is equipped with a multi-wavelength Ra- to 31 GHz with a radiometric resolution between 0.3 and
man lidar system (LR331D400, Raymetrics S.A.), which has 0.4 rms errors at 1.0 s integration time. The retrievals of
https://doi.org/10.5194/acp-21-9269-2021 Atmos. Chem. Phys., 21, 9269–9287, 2021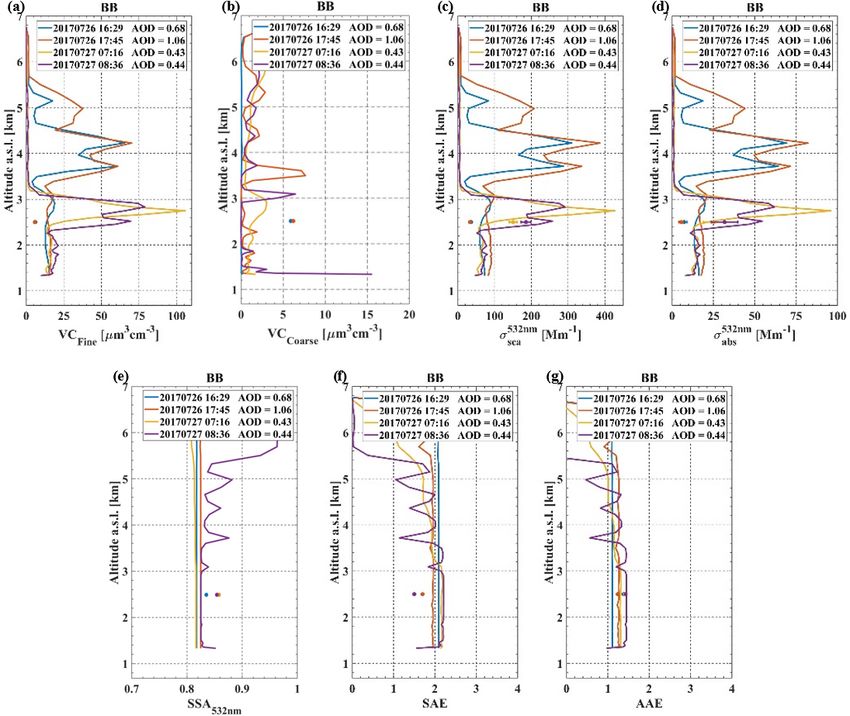
9272                                                 J. A. Benavent-Oltra et al.: Overview of the SLOPE I and II campaigns

Table 1. Instruments deployed during the SLOPE I and II campaigns at the AGORA stations.

        Instrument                     Location                     Measurement variable           Wavelength (nm)/
                                                                                                   nominal size range (µm)
        Raman lidar system             UGR station                  Elastic backscattered signal   355, 532, and 1064 nm
        Sun–sky photometer             UGR, CP and SNS stations     Aerosol optical depth          440, 675, 870, and 1020 nm
                                                                    and sky radiances
        Nephelometer TSI 3563          SNS station                                                 450, 550, and 700 nm
                                                                    Scattering coefficient
        Nephelometer Aurora Ecotech    Aircraft                                                    450, 525, and 635 nm
        Aethalometer AE-33             SNS station                                                 370, 470, 520, and 590
                                                                    Absorption coefficient
        Aethalometer AVIO AE-33        Aircraft                                                    660, 880, and 950 nm
        Scanning mobility particle     SNS station                  Aitken + accumulation          0.012–0.615 µm
        sizer, TSI 3082                                             mode conc.
        Aerodynamic particle           SNS station                  Coarse mode conc.              0.5–20 µm
        sizer, TSI 3321

temperature profiles from the measured brightness temper-           fusion losses and multiple charges by AIM software (ver-
atures are performed using a standard feed forward neural           sion 10.2.0, TSI, Inc., St Paul, MN, USA). The SMPS mea-
network (Rose et al., 2005). The uncertainty of the MWR             surements followed ACTRIS and GAW recommendations
temperature profiles varies according to the weather condi-         (Wiedensohler et al., 2012, 2018) and high-quality data were
tions (cloud-free or cloudy), ranging between 1.8 and 3 K           guaranteed after the successful participation of the instru-
(Bedoya-Velásquez et al., 2019). A detailed description of          ment in the ACTRIS inter-comparisons workshops (TRO-
this system can be found in Navas-Guzmán et al. (2014) and          POS, Leipzig, Germany) and in situ inter-comparison (AC-
Bedoya-Velásquez et al. (2018, 2019).                               TRIS Round Robin Tour). The aerodynamic particle sizer
                                                                    (APS; TSI Mod. 3321) provides the coarse particle number
2.2    In situ instrumentation                                      size distribution within the 0.25–10 µm aerodynamic radius
                                                                    range. The APS also measures number aerosol concentra-
The integrating nephelometer (model TSI 3563) at the SNS            tions up to 1000 particles cm−3 with coincidence errors in-
measures the particle light scattering coefficient (σsca ) at       ferior to 5 % and 10 % at 0.25 and 5 µm radius, respectively.
three wavelengths (450, 550, and 700 nm) with 1 min tempo-          By the combination of SMPS and APS measurements, to-
ral resolution. The aerosol flow in the nephelometer was set        tal aerosol volume concentrations were obtained in the 0.05–
to 30 L min−1 . The nephelometer measurements are within            10 µm radius range with 5 min time resolution. Since SMPS
the angular range 7–170◦ , so the data were corrected for           and APS measurement principles are based on mobility and
truncation and non-Lambertian illumination errors (Ander-           aerodynamic particle properties, conversion from aerody-
son and Ogren, 1998). The Aethalometer AE-33 (Magee Sci-            namic to mobility diameter is needed to combine both mea-
entific Company, 206 Berkeley, USA) is based on a filter            surements. In this sense, both measurements could be related
technique and provides aerosol absorption coefficients (σabs )      by a factor Q (Sorribas et al., 2015) that depends on chem-
at seven wavelengths (370, 470, 520, 590, 660, 880, and             istry and aerosol shape. Due to the absence of information of
950 nm). The aethalometer was inter-compared with other             both properties, Q-value = 1 has been assumed for conver-
similar systems during the ACTRIS inter-comparison (AC-             sion from aerodynamic to mobility size distribution (mobility
TRIS 2 Absorption Photometer Workshop, September 2015,              diameter equal to aerodynamic diameter).
Leipzig, Germany), which assures the data quality. The com-
bination of integrating nephelometer and aethalometer data          2.3   Aircraft instrumentation
allows the calculation of the aerosol extinction coefficients
(α).                                                                During the campaigns, dedicated flights with an aircraft
   The scanning mobility particle sizer (SMPS) composed of          (Partenavia P68) equipped with in situ instrumentation were
an electrostatic classifier (TSI Mod. 3082) and a conden-           carried out over the study area between 15 and 18 June 2016
sation particle counter (CPC; TSI Mod. 3772) provide the            for the SLOPE I campaign and between 21 and 24 June 2017
sub-micron particle number size distribution within the 6–          for the SLOPE II campaign. The aircraft campaigns con-
307.5 nm particle mobility radius range with 5 min temporal         sisted of three flights each year. Figure 1 shows the spiral
resolution. SMPS data have been corrected of internal dif-          trajectories of one flight; each flight consisted of several as-

Atmos. Chem. Phys., 21, 9269–9287, 2021                                                https://doi.org/10.5194/acp-21-9269-2021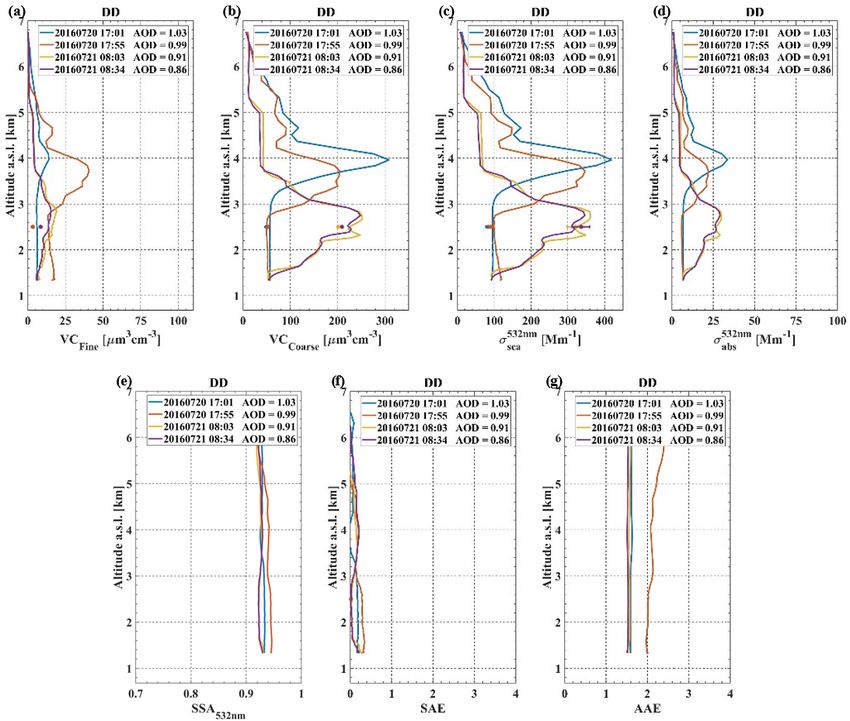
J. A. Benavent-Oltra et al.: Overview of the SLOPE I and II campaigns                                                       9273

cending and descending spiral profiles centred on the loca-           Individual GRASP retrievals are performed for each sky
tion of the UGR station. The radius of the spirals were about      radiance almucantar sequence available from AERONET
500 m. On each flight, only ascending profiles were used in        with correlative lidar measurements in a ± 15 min time win-
the following analysis. To avoid the potential partial sam-        dow. Specifically, the normalized lidar range corrected sig-
pling of the exhaust of the aircraft, the descending profiles      nal profile used in each retrieval was previously 30 min av-
were performed at a different location.                            eraged and computed for 60 log-spaced heights between the
   Air flows to the instruments through a near-isokinetic          minimum and maximum heights as proposed by Lopatin et
isoaxial inlet designed by Aerosol d.o.o. (https://www.            al. (2013). Here, the minimum height has been chosen as
aerosol.si, last access: 11 June 2021) at a flow rate of           400 m above the ground to minimize the effect of incomplete
10 L min−1 . The main flow is divided by two flow splitters        overlap and the maximum height as 6000 m above the ground
that divide the sampled air among the instruments. Yus-Díez        to have a higher signal-to-noise ratio. This GRASP configu-
et al. (2021) reported minimal losses in the inlet system for      ration is described in detail in Benavent-Oltra et al. (2019).
small particles, while larger differences were observed for        The data used in this study were recorded between May and
particles with radius > 2–2.5 µm. The Ecotech Aurora neph-         July of 2016 and 2017 with 286 retrievals in 69 d that passed
elometer is an integrating nephelometer that measures the          the filter imposed to the inversion process (relative residual
particle light scattering coefficient at three wavelengths (450,   < 15 %; Torres et al., 2017).
525, and 635 nm) with a time resolution of 10 s. This instru-
ment measures the scattering coefficient in the angular range      3.2   Aircraft data
10–170◦ , and the correction of Müller et al. (2011) was used
to account for the angular truncation errors. The Aethalome-       In order to make comparable the profiles from the aircraft
ter AVIO AE33 (Aerosol d.o.o.) is the aircraft version of the      data and the remote sensing retrievals, there are some correc-
Aethalometer AE-33 described above. Using the same mea-            tions to consider. Remote sensing data are provided at am-
surement principle (Drinovec et al., 2015), it provides par-       bient conditions (temperature and pressure), but the aircraft
ticle absorption coefficients at seven wavelengths (370, 470,      data are registered at different conditions. Nephelometer data
520, 590, 660, 880, and 950 nm) with a time resolution of 1 s.     from the aircraft were recorded at cabin temperature and am-
The position of the aircraft was tracked using GPS and all in-     bient pressure, and aethalometer data were registered at 0 ◦ C
struments on board the aircraft were time synchronized. Fur-       and 1013.25 hPa. The cabin temperature used was the neph-
ther information on the aircraft instrumentation can be found      elometer sampling temperature (Ts ), i.e. the temperature in-
in Yus-Díez et al. (2021).                                         side the nephelometer, and the profile atmospheric pressure
                                                                   used was the nephelometer pressure sensor (Ps ). The cabin
                                                                   on the aircraft was not pressurized so the pressure inside the
3     Methodology                                                  nephelometer can be considered the outside pressure. The
                                                                   aircraft did not register the outside temperature, so an ex-
3.1    GRASP retrievals                                            ternal source of temperature profile was required. We used
                                                                   a temperature profile from a microwave radiometer MWR
In this work, we use the GRASP code following the scheme           (Tmwr ) as described in Sect. 2.1 using an average profile dur-
proposed by Lopatin et al. (2013), which combines lidar and        ing the time of the entire aircraft profile and interpolated to
sun–sky photometer measurements to retrieve the optical and        the exact altitudes of the aircraft profile.
microphysical properties of aerosol particles. This scheme            Aircraft profiles show some noise, especially at higher al-
uses normalized backscattered range corrected signal at 355,       titudes, so a convolution with a mean filter was applied to the
532, and 1064 nm from lidar, the AOD, and sky radiance (al-        aircraft in situ data in order to smooth the profiles. We ob-
mucantar scan) both at 440, 675, 870, and 1020 nm from             served that using 100 m for the nephelometer and 200 m for
AERONET version 3 level 1.5. It should be noted that the           the aethalometer data in the vertical profiles reduced noise
GRASP retrievals were performed during the daytime with            while preserving the profile features. Finally, Aurora neph-
solar zenith angles larger than 40◦ and clear-sky conditions.      elometer wavelengths were converted to the TSI wavelengths
This configuration of GRASP allows the retrieval of aerosol        using the Ångström exponent law to make the aircraft and
properties for both fine (radii range 0.05 to 0.576 µm) and        ground based in situ data comparable.
coarse (radii range 0.33 to 15 µm) modes separately, the com-
plex refractive index, single-scattering albedo (SSA), and li-
dar ratio (LR). In addition, GRASP provides vertical concen-
tration of fine and coarse mode separately, and the vertically
resolved profiles of the extinction, absorption, and scatter-
ing coefficients, SSA, LR, Ångström exponent of absorption
(AAE), and scattering (SAE).

https://doi.org/10.5194/acp-21-9269-2021                                            Atmos. Chem. Phys., 21, 9269–9287, 2021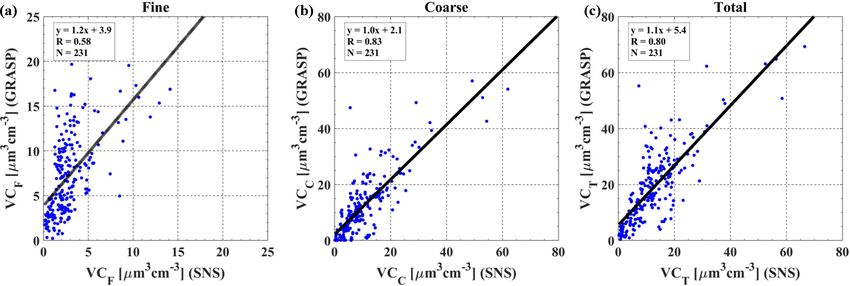
9274 J. A. Benavent-Oltra et al.: Overview of the SLOPE I and II campaigns
4 Results ments at the SNS. The comparison was performed by inter-
polating the GRASP values at 355, 532, and 1064 nm to the
4.1 Evaluation of the GRASP retrievals versus in situ wavelengths of the nephelometer (450, 550, and 700 nm) and
data the aethalometer (370, 520, and 880 nm) using the Ångström
exponent law. For σsca , we can observe that generally the
4.1.1 At the high mountain station agreements between GRASP and in situ data are similar at
the three wavelengths (R ∼ 0.95). The slopes of the linear
For the inter-comparison between the GRASP retrievals and fits are equal to 1 with an intercept lower than 10 Mm−1 that
the SNS in situ data, we selected the in situ measurements decreases for larger wavelengths. Globally, GRASP over-
averaged in ± 15 min around the GRASP retrieval time and estimates in situ data at the SNS with a mean difference
the 400 m averaged data of the GRASP retrieval profile (± standard deviation) of 11 ± 17, 6 ± 14, and 4 ± 11 Mm−1
at 2500 m a.s.l. (SNS altitude). The number of coincident at 450, 550, and 700 nm, respectively. On the other hand, for
GRASP retrievals with in situ measurements are 231, 202, σabs , GRASP shows good correlation with the in situ data
154, and 151 for volume concentration, σsca , σabs , and α co- with correlation coefficients around 0.85. In general, GRASP
efficients, respectively. Therefore, the results and discussion overestimates the in situ data at the SNS as shown by the
about the comparison between the GRASP and the SNS in slopes (∼ 1.2) and intercepts (from 0.5 to 1.5 Mm−1 ) of the
situ measurements refer exclusively to this height range. regressions. The mean differences (± standard deviation) of
Figure 2 shows the aerosol total (VCT ), fine mode (VCF ), σabs are 2 ± 6, 1 ± 3, and 0.8 ± 1.7 Mm−1 at 370, 520, and
and coarse mode (VCC ) volume concentration retrieved by 880 nm, respectively. Furthermore, the differences between
GRASP versus those measured with in situ instruments at GRASP and in situ measurements are less than ± 2.5 Mm−1
the SNS. The aerosol volume concentrations at the SNS were for 61 %, 81 %, and 90 % of the data at 370, 520, and 880 nm,
calculated for the 0.05–0.5 and 0.5–10 µm radius size ranges respectively. The results from Fig. 3 for the validation of σsca
for the fine and coarse modes, respectively. Due to the sen- are similar to previous validations of the GRASP retrievals
sitivity of linear regression to outliers, VCT concentrations with in situ data from high mountain sites (e.g. Titos et al.,
larger than 190 µm3 cm−3 (99 percentile) and their corre- 2019; Benavent-Oltra et al., 2019). However, it should be
sponding fine and coarse data have been excluded in this noted that the results presented here are the first direct val-
analysis. In general, volume concentrations retrieved by the idation of retrieved σabs .
GRASP code show good correlation with the SNS measure- Finally, the comparison between the GRASP retrievals and
ments with correlation coefficients (R) of 0.58, 0.83, and in situ data for the extinction coefficient at 532 nm showed
0.80 for fine, coarse, and total volume concentrations, re- evidence of better agreement (Fig. 4a). The in situ extinction
spectively. The results show that the GRASP retrievals over- coefficient at 532 nm is the sum of the scattering and absorp-
estimate in situ measurements with a mean difference (± tion coefficients interpolated to 532 nm using the Ångström
standard deviation) of 4 ± 4 and 6 ± 8 µm3 cm−3 for fine exponent law. The GRASP retrievals and in situ data show
and total volume concentrations, respectively. In contrast, good agreement (slope equals 1) and are highly correlated
better correlation is observed for coarse mode volume con- (R = 0.9). Figure 4b shows the frequency histogram of the
centrations (slope equals 1) with a lower mean difference differences in extinction coefficient (1α) between GRASP
(2 ± 6 µm3 cm−3 ). In terms of absolute concentrations, 65 % and in situ, showing a skewed histogram to positive differ-
(91 %), 70 % (88 %), and 45 % (71 %) of the differences ences that implies slight overestimation by GRASP. These
are observed within ± 5 µm3 cm−3 (± 10 µm3 cm−3 ) for fine, overestimations can be associated with the differences in
coarse, and total volume concentrations, respectively. These scattering coefficient.
results are similar to those found in previous GRASP as-
sessments by Benavent-Oltra et al. (2017) and Tsekeri et 4.1.2 Aircraft profiles
al. (2017). These authors also showed an overestimation of
VCF compared with in situ data, while for VCC , similar A total of six flights were carried out on 15, 17, and
GRASP retrievals to in situ data were found for cases where 18 June 2016 during SLOPE I and 21, 23, and 24 June 2017
coarse particles are predominant. The observed overestima- during SLOPE II. During the SLOPE I flights, the aerosol
tion is lower than the obtained by Román et al. (2018) us- conditions were characterized by AOD values at 440 nm
ing GRASP with ceilometer data and by Benavent-Oltra et (AOD440 ) lower than 0.1 and an Ångström exponent (AE),
al. (2019) using GRASP with lidar emission signals at 355, computed with AOD at 440 and 870 nm (AE440−870 ), be-
532, and 1064 nm. Titos et al. (2019) found that the agree- tween 0.6 and 1.3. On the other hand, during the week of
ment between the GRASP retrievals (from ceilometer mea- flights for SLOPE II, there was a dust intrusion from the Sa-
surements) and in situ data improved when the contribution hara with higher AOD440 values (ranging from 0.13 to 0.36
of fine particles was negligible. on 23 and 24 June 2017, respectively) and low AE440−870
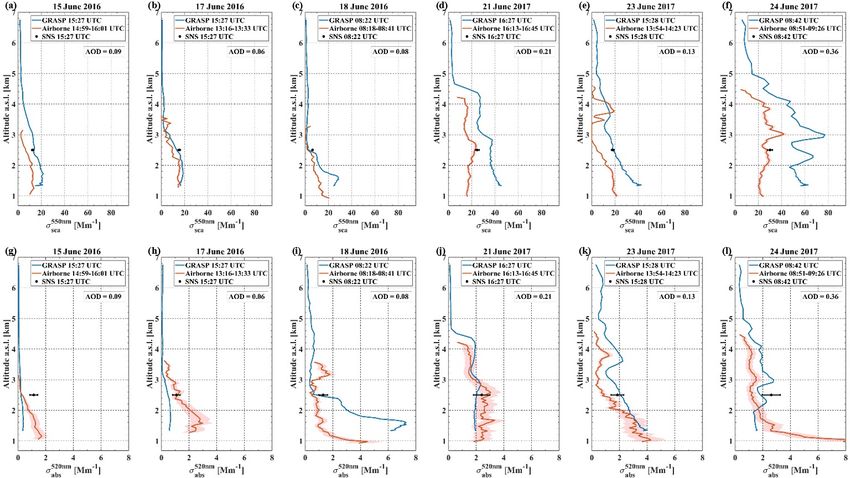
Figure 3 shows σsca and σabs obtained by GRASP at values between 0.3 and 0.8. Figure 5 shows the vertical pro-
∼ 2.5 km height versus those obtained by in situ measure- files of scattering and absorption coefficients retrieved by the
Atmos. Chem. Phys., 21, 9269–9287, 2021 https://doi.org/10.5194/acp-21-9269-2021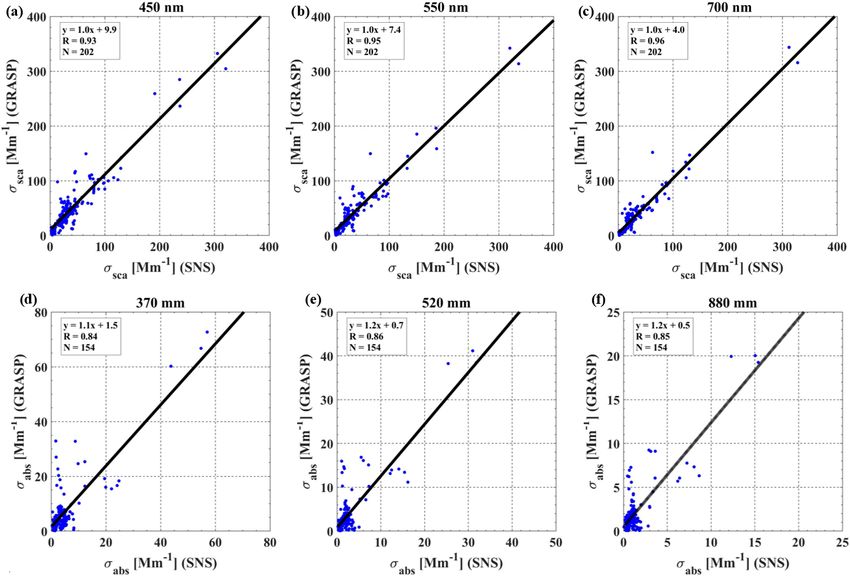
J. A. Benavent-Oltra et al.: Overview of the SLOPE I and II campaigns                                                                      9275

Figure 2. Volume concentration (VC) retrieved by GRASP at the SNS height versus in situ measurements at the SNS for (a) fine, (b) coarse,
and (c) total modes.

Figure 3. (a, b, c) Scattering (σsca ) and (d, e, f) absorption (σabs ) coefficients retrieved by GRASP at the SNS height versus in situ measure-
ments at the SNS.

GRASP code and measured by the on-board instrumenta-                       ever, during SLOPE II, the differences between GRASP and
tion. This figure also includes the mean value measured at                 in situ measurements (both airborne and SNS) are larger,
the SNS during the flights. For the sake of comparison, the                reaching values of 30 Mm−1 . In the case of σabs , the GRASP
GRASP values at 355, 532, and 1064 nm have been inter-                     and airborne profiles show large differences during SLOPE I
polated to the nephelometer and aethalometer wavelengths                   with mean absolute differences between 0.5 and 3 Mm−1
using the Ångström exponent law.                                           and reaching differences around 6 Mm−1 on 18 June 2016.
   For σsca , both GRASP and airborne measurements follow                  On the other hand, the absorption coefficients retrieved by
the same pattern where GRASP overestimates the airborne                    GRASP show good agreement with in situ measurements
data with a mean absolute difference of 14 ± 10 Mm−1 . Dur-                (both airborne and SNS) with a mean absolute difference of
ing SLOPE I, these mean absolute differences are lower than                0.7 ± 0.4 Mm−1 during SLOPE II. In general, the differences
8 Mm−1 and there is a good agreement between GRASP                         between GRASP and in situ measurements are close to the
and the SNS measurements (differences < 4 Mm−1 ). How-                     detection limit for the aethalometer on board the aircraft and

https://doi.org/10.5194/acp-21-9269-2021                                                      Atmos. Chem. Phys., 21, 9269–9287, 2021
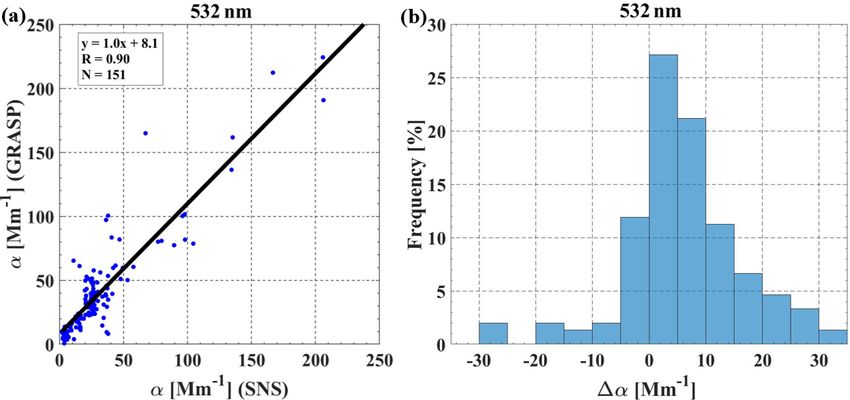
9276                                                     J. A. Benavent-Oltra et al.: Overview of the SLOPE I and II campaigns

Figure 4. (a) Extinction (α) coefficient retrieved by GRASP at the SNS height versus the in situ measurements at the SNS and (b) the
histogram of the absolute difference between GRASP and the SNS in situ measurements.

Figure 5. Scattering (σsca ) and absorption (σabs ) coefficients at 520 nm retrieved by GRASP (blue), aircraft (red), and the SNS (black) in situ
measurements on (a, g) 15, (b, h) 17, and (c, i) 18 June 2016 and (d, j) 21, (e, k) 23, and (f, l) 24 June 2017. The AOD shown is at 440 nm.

the SNS. The differences obtained both for σsca and σabs can               4.2     Aerosol properties during SLOPE I and II
be explained due to the low AOD440 (below 0.40), which rep-
resents a challenge for the retrieval of the aerosol properties            4.2.1    Column integrated
both for AERONET (Dubovik and King, 2000; Dubovik et
al., 2000) and inversion algorithms such as GRASP (Lopatin                 Figure 6 shows the temporal evolutions of AOD440 and
et al., 2013). However, the very good agreement in absorp-                 AE440−870 daily mean values retrieved by the GRASP code
tion coefficient during SLOPE II indicates the good capabil-               at the UGR station during the SLOPE I and II campaigns.
ity of GRASP to retrieve vertical profiles of absorption to                Daily averaged values of AOD440 retrieved by the GRASP
AOD440 higher 0.1.                                                         code range from 0.06 to 1.0 with a mean (± standard devia-

Atmos. Chem. Phys., 21, 9269–9287, 2021                                                       https://doi.org/10.5194/acp-21-9269-2021
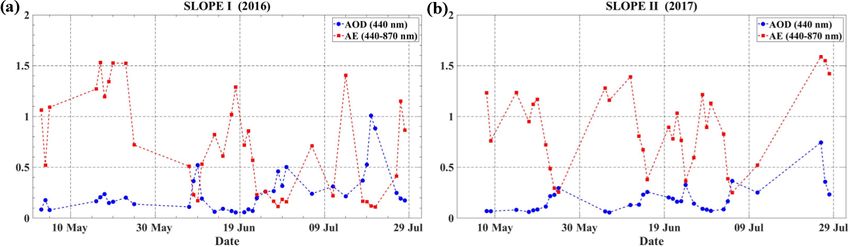
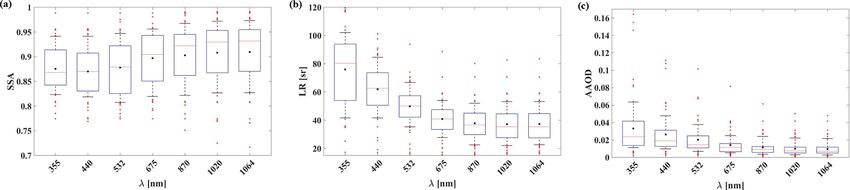
J. A. Benavent-Oltra et al.: Overview of the SLOPE I and II campaigns                                                                    9277

Figure 6. Temporal evolution of aerosol optical depth (AOD) at 440 nm and Ångström exponent (440–870 nm) retrieved by GRASP during
the (a) SLOPE I and (b) SLOPE II campaigns.

Figure 7. Statistics of (a) single-scattering albedo (SSA), (b) lidar ratio (LR), and (c) absorption aerosol optical depth (AAOD), at 355, 440,
532, 675, 870, 1020, and 1064 nm retrieved by the GRASP code during the SLOPE I and II campaigns represented as box diagrams. In these
box diagrams, the mean is represented by a black dot and the line segment in the box is the median. The bottom and top edges of the box
indicate the 25th and 75th percentiles, respectively. In addition, the error bars of the box are the 10th and 90th percentiles and the crosses
represent the outliers.

tion) value of 0.22 ± 0.18, while AE440−870 varies from 0.11              length variability with mean values ranging from 80 ± 30 sr
to 1.6 with a mean value of 0.8 ± 0.4. The large variability              at 355 nm to 35 ± 16 sr at 1064 nm, which are typical for Sa-
of the AODs and Ångström exponents observed in Fig. 6 are                 haran dust (Shin et al., 2018). For aerosol extensive proper-
typical for this season in the study area (e.g. Pérez-Ramírez             ties, the highest AAODs (> 0.10) correspond both to dust and
et al., 2012). Large AODs and low AE values like those                    biomass-burning events, with an absorption Ångström expo-
observed on 20 July 2016 are related to Saharan dust out-                 nent (AAE; computed in the spectral range 355–1064 nm)
breaks (e.g. Román et al., 2018; Benavent-Oltra et al., 2019),            higher than 1.5 for the desert dust event and around 1.0 for
while large AODs and AE values like those observed on                     the biomass burning event. The variability in AAE can be
26 July 2017 are related to biomass burning transport (from               explained by the differences in particle chemical composi-
Portugal in this case) (Turco et al., 2019).                              tions (e.g. Russell et al., 2010; Cazorla et al., 2013; Liu et
   Figure 7 shows the box-and-whisker diagrams of retrieved               al., 2018), but in the context of the current capabilities of the
aerosol columnar-integrated properties such as SSA, LR,                   GRASP retrievals, we could not advance with such analy-
and aerosol absorption optical depth (AAOD) at 355, 440,                  ses. Nevertheless, GRASP revealed a small contribution of
532, 675, 870, 1020, and 1064 nm retrieved by the GRASP                   aerosol absorption in the total aerosol optical depth during
code during the study period. For aerosol intensive proper-               the SLOPE I and II field campaigns even for cases with rela-
ties, the SSA values are typical for Saharan dust outbreaks               tively low AODs.
at the study region (e.g. Valenzuela et al., 2012), ranging                  The large standard deviations and percentiles observed
from 0.88 ± 0.05 at 355 nm to 0.90 ± 0.06 at 1064 nm, re-                 in Fig. 7 for all aerosol optical properties agree with
spectively. These relatively large values of SSA for all wave-            the variability of aerosol types deduced from Fig. 6. The
lengths indicate a small concentration of absorbing aerosol               aerosol variability can be caused by the fact that different
particles (e.g. mineral dust). The LR values show large wave-             air masses reach the south-east of Spain. Usually, the air

https://doi.org/10.5194/acp-21-9269-2021                                                    Atmos. Chem. Phys., 21, 9269–9287, 2021
9278                                                     J. A. Benavent-Oltra et al.: Overview of the SLOPE I and II campaigns

Figure 8. Variability of the GRASP vertical profiles. Volume concentration for (a) fine and (b) coarse modes. (c) Extinction (α), (d) scattering
(σsca ), and (e) absorption (σabs ) coefficients. (f) Single-scattering albedo (SSA) and (g) lidar ratio (LR) at 532 nm. (h) Scattering Ångström
exponent (SAE) and (i) absorption Ångström exponent (AAE) computed between 355 and 1064 nm. The black line represents the median and
the red dashed line is the mean. The shaded area is the interquartile range and the black dashed lines represent the 10th and 90th percentiles.
Statistics are based on daily average profiles.

masses in the study region come from the Atlantic bring-                  GRASP: volume concentration, differentiating between fine
ing clean air, or from north of Africa transporting min-                  and coarse mode, and for the aerosol optical properties the
eral dust, or from the Mediterranean transporting anthro-                 extinction, scattering, and absorption coefficients plus SSA
pogenic particles (e.g. Pérez-Ramírez et al., 2016). An-                  and LR, all at the reference wavelength of 532 nm. Addi-
other frequent source of aerosol particles are the biomass                tionally, we include the AAE and SAE computed between
burning events near the study region (Alados-Arboledas                    355 and 1064 nm. As mentioned in Sect. 3.1., a total of 286
et al., 2011; Ortiz-Amezcua et al., 2017; Sicard et al.,                  GRASP retrievals passed the filter imposed. For the statisti-
2019). According to the natural aerosol episode warning                   cal overview, we compare point by point the 60 log-spaced
system from MITECO (Spanish Ministry for Ecological                       heights of each aerosol property profiles. The solid black
Transition and Demographic Challenge, https://www.miteco.                 lines represent the medians and red dashed line the means.
gob.es/es/calidad-y-evaluacion-ambiental/temas/, last ac-                 The shaded area is the interquartile range and the black
cess: 1 June 2020), on around 66 % and 10 % of the evalu-                 dashed lines represent the 10th and 90th percentiles.
ated days with the GRASP retrievals there were associated                    For aerosol microphysical properties (Fig. 8a, b) we ob-
North African intrusions and biomass burning events in the                serve an approximately linear decay with altitude until they
south-east of Spain, respectively.                                        reach approximately zero at 4–5 km a.s.l. The largest values
                                                                          are at the lowest altitudes (with average ∼ 10 µm3 cm−3 ).
4.2.2   Vertically resolved                                               The VCF profile shows lower variability (a smaller interquar-
                                                                          tile range) than the VCC profile. The highest variability in the
Figure 8 shows a statistical overview of the aerosol op-                  coarse particles profile, which is the 90th percentile with val-
tical and microphysical properties profiles retrieved by

Atmos. Chem. Phys., 21, 9269–9287, 2021                                                       https://doi.org/10.5194/acp-21-9269-2021
J. A. Benavent-Oltra et al.: Overview of the SLOPE I and II campaigns 9279
ues between 40 and 60 µm3 cm−3 , is mainly caused by the mineral dust outbreak (DD) in July 2016, and the second was
intrusion of desert dust particles during the SLOPE I and II a biomass burning transport event (BB) in July 2017 with
campaigns. fires originating in Portugal. Figures 9 and 10 show the pro-
The extinction, scattering and absorption coefficient pro- files of aerosol optical and microphysical properties for the
files at 532 nm (Fig. 8c, d, e) show similar behaviour as VC DD and BB events, respectively. Also included in these fig-
profiles. These patterns of extinction coefficient profiles for ures is the time when retrievals were obtained, the AOD at
long-term statistical analyses have been observed in Europe each moment, and the SNS measurements at the available
for previous studies using Raman lidar data (e.g. Amiridis periods.
et al., 2005; Navas-Guzmán et al., 2013). The largest values Figures 9 and 10 show that for the first day of each event
for the particle extinction, scattering, and absorption coef- (20 July 2016 and 26 July 2017) decoupled aerosol layers
ficients are observed for the altitudes below 2 km a.s.l. (40, were observed at approximately ∼ 4 km a.s.l. Such decou-
35, and 4 Mm−1 for α, σsca , and σabs , respectively). This pled layers went gradually downward until they reached the
behaviour of the σsca profile has been previously observed altitude of ∼ 2–3 km a.s.l. in the morning of the second day
in other statistical lidar studies (e.g. Titos et al., 2019). The of the event, on 21 July 2016 and 27 July 2017, respectively.
SSA profile at 532 nm decreases with values from 0.92 at This phenomenon is known as an entrainment event and it
the lowest altitude to 0.86 at the highest altitude and with has been observed previously in Granada (Bravo-Aranda et
interquartile range ∼ 0.025, which is close to the uncertain- al., 2015). These figures suggest that these entrainments af-
ties claimed for SSA retrievals using remote sensing tech- fect both the intensive and extensive aerosol properties.
niques (e.g. Pérez-Ramírez et al., 2019). The combination The analyses of microphysical properties profiles show
of σabs and SSA reveals that for the entire profile approxi- important differences in volume concentration between these
mately 10 % of the total extinction corresponds to absorption. two extreme events. For the DD event, coarse particles
Thus, the GRASP retrievals show the capability of this code are predominant with VCC between 200 and 300 µm3 cm−3
to characterize aerosol absorption coefficients with vertical on the aerosol layer, while for the BB event, the VCC is
resolution, which is a step towards aerosol characterization. very low (∼ 10 µm3 cm−3 ) and fine particles are predomi-
The profiles of intensive properties such as LR, AAE, and nant with maximum values between 60 and 105 µm3 cm−3 .
SAE can provide information about the predominance of dif- In general, GRASP VCF overestimates the SNS measure-
ferent aerosol particle types. For LR at 532 nm (Fig. 8g), ments with differences below 10 µm3 cm−3 , whereas GRASP
a constant mean profile is observed with a mean value of VCC is similar to the SNS measurements for values around
∼ 52 sr. LR at a given wavelength depends mainly on both 55 µm3 cm−3 as shown in Sect. 4.1.1. However, for higher
chemical composition and particle shapes (Müller et al., values of VCC , GRASP overestimates the SNS data with dif-
2007), which explains the variability in the retrieved val- ferences between 10 and 20 µm3 cm−3 as shown in Benavent
ues for the different aerosol types with a strong contribu- et al. (2019).
tion of mineral dust. The LR values obtained are very similar For extensive optical properties, the σsca profiles at 532 nm
to those observed in other studies (e.g. Guerrero-Rascado et show similar values between both events, with values be-
al., 2009; Navas-Guzmán et al., 2013a). For SAE (Fig. 8h), tween 200 and 400 Mm−1 . However, for σabs there are sig-
which is more related to the predominant particle size, the nificant differences between both events, with larger values
highest value is found at the lowest altitude, suggesting larger observed during the BB event probably because of the pres-
predominance of fine particles closer to the surface This ence of organic and black carbon particles. Nevertheless, we
pattern agrees with the assumption of higher anthropogenic remark that σabs is not negligible as expected for mineral dust
aerosol loads at these altitudes, which are dominated by fine- particles (e.g. Valenzuela et al., 2012). These findings are
mode particles. Furthermore, it agrees with the low mixture supported by SSA profiles that show lower SSA values for
of transported mineral dust with anthropogenic pollution at biomass burning (mean values ∼ 0.83) and higher values for
altitudes above the atmospheric boundary layer top. Finally, dust events (mean values ∼ 0.93).
AAE (Fig. 8i), which is related to the chemical composition Finally, Figs. 9 and 10 also show the profiles obtained
of the absorbing aerosol, follows a constant pattern with alti- for intensive properties such as SAE and AAE computed
tude with a mean value of ∼ 1.45 with the 10th and 90th per- from the GRASP retrievals (spectral range 355–1064 nm).
centiles equal to 1 and 2, respectively. These are the values The analyses of these variables can provide an indication
typically found for Saharan mineral dust particle transport of aerosol types. On 20 and 21 July 2016, the SAE values
and their mixture with anthropogenic pollutants (Russell et lower than 0.5 corroborate the predominance of coarse par-
al., 2010). ticles for mineral dust particles (Bergstrom et al., 2007) and
the AAE values, ranging from 1.5 to 2.1, suggest a mixture of
4.2.3 Special events mineral dust and absorbing particles of anthropogenic origin
(e.g. Giles et al., 2011; Valenzuela et al., 2015). During the
During the SLOPE I and II campaigns two extreme events BB event, the SAE values are around 2, indicating a scatter-
occurred with AOD440 ∼ 1.0. The first one was a Saharan ing dominated by sub-micron particles, and the AAE values
https://doi.org/10.5194/acp-21-9269-2021 Atmos. Chem. Phys., 21, 9269–9287, 20219280 J. A. Benavent-Oltra et al.: Overview of the SLOPE I and II campaigns
Figure 9. Volume concentration for (a) fine and (b) coarse modes, (c) scattering (σsca ) and (d) absorption (σabs ) coefficients, (e) single
scattering albedo (SSA) at 532 nm, (f) scattering Ångström exponent (SAE), and (g) absorption Ångström exponent (AAE) retrieved by
GRASP (line) and the SNS measurements (point) during the desert dust event on 20 and 21 July 2016. The AOD shown is at 440 nm.
between 1.1 and 1.45 suggest the presence of carbonaceous June, and July 2016 and 2017 were used as input data in
particles (Giles et al., 2012). Nevertheless, further advance- GRASP to retrieve these aerosol properties.
ment in the interpretation of aerosol chemical composition is The in situ measurements performed at the Sierra Nevada
currently challenging; however, new developments aimed at Station during the SLOPE I and II campaigns and the air-
the characterization of aerosol compositions are being added borne measurement gathered during special periods on both
to GRASP (Li et al., 2019, 2020) and will be explored in the campaigns allowed for the assessment of the aerosol proper-
future. ties retrieved by the GRASP code at 2.5 km a.s.l. and for the
whole profile, respectively. The volume concentration com-
parison shows better agreement for the coarse mode (R =
5 Conclusions 0.83) than for the fine and total modes. The range of values
for the fine mode is small due to the few cases (15 % of cases)
In this study, we presented an overview of aerosol optical with predominant fine particles; therefore, we cannot con-
and microphysical properties retrieved with the GRASP code clude that there is agreement between the GRASP retrievals
during the SLOPE I and II field campaigns. The measure- and in situ measurements for the fine mode. For the scat-
ments from lidar and sun–sky photometer performed on May, tering and absorption coefficients, the differences between
Atmos. Chem. Phys., 21, 9269–9287, 2021 https://doi.org/10.5194/acp-21-9269-2021J. A. Benavent-Oltra et al.: Overview of the SLOPE I and II campaigns 9281 Figure 10. Volume concentration for (a) fine and (b) coarse modes, (c) scattering (σsca ) and (d) absorption (σabs ) coefficients, (e) single scattering albedo (SSA) at 532 nm, (f) scattering Ångström exponent (SAE), and (g) absorption Ångström exponent (AAE) retrieved by GRASP (line) and the SNS measurements (point) during biomass burning event on 26 and 27 July 2017. The AOD shown is at 440 nm. the GRASP data at 2.5 km a.s.l. and in situ measurements (AOD440 = 0.22 ± 0.18) and Ångström exponent are lowest for the longest wavelengths, with differences of (AE440−870 = 0.8 ± 0.4) that are typical of those months 11 ± 17 Mm−1 at 450 nm and 2 ± 6 Mm−1 at 370 nm for σsca in Granada. The large variety of aerosol properties values and σabs , respectively. The agreement between GRASP and denotes a large variability of aerosol loads and types with in situ measurements at the SNS is solid for both scatter- a desert mineral dust predominance associated with North ing and absorption coefficients. In general, GRASP some- African intrusions in the south-east of Spain. The statistical what overestimates the in situ data at 2.5 km a.s.l. These dif- overview of the volume concentration profiles shows a ferences (14 ± 10 and 1.2 ± 1.2 Mm−1 for σsca and σabs , re- decay of the properties with altitude, reaching approximately spectively) are also observed in the whole profile when com- zero at 4–5 km a.s.l. The coarse mode shows the highest paring the GRASP retrievals and the airborne measurements variability with the 90th percentile values being between performed on 15, 17, and 18 June 2016 and 21, 23, and 40 and 60 µm3 cm−3 . The largest value for the absorption 24 June 2017. coefficient is observed at the lowest altitudes (4 Mm−1 ). The statistical analysis of the SLOPE I and II cam- Finally, two extreme events (AOD440 > 1.0) were studied: paigns shows the values of aerosol optical depth a Saharan dust intrusion and biomass burning from fires https://doi.org/10.5194/acp-21-9269-2021 Atmos. Chem. Phys., 21, 9269–9287, 2021
9282                                                     J. A. Benavent-Oltra et al.: Overview of the SLOPE I and II campaigns

in Portugal in July 2016 and 2017, respectively. The study               knowledge the FEDER programme for the instrumentation used in
of these events shows the high capabilities of GRASP to                  this work, the University of Granada, which supported this study
retrieve volume concentration profiles in both fine and                  through the Excellence Units Program, and the Sierra Nevada Na-
coarse mode and the potentially interesting capability of                tional Park. We also thank Dr. Grisa Monick who provided the
the algorithm to derive the profiles of the single scattering            Aethalometer AVIO AE-33 installed on the aircraft. Thanks to
                                                                         AERONET and ACTRIS/AERONET Europe for the scientific and
albedo and absorption coefficients for different types and
                                                                         technical support. Finally, the authors would like to acknowledge
sizes of atmospheric aerosols.                                           the use of the GRASP inversion algorithm software (http://www.
                                                                         grasp-open.com, last access: 1 April 2020), in this work.

Data availability. The GRASP inversion algorithm software used
in this work is free and publicly available at http://www.grasp-open.
                                                                         Financial support. This article is based upon work from COST
com (last access: 1 April 2020). Lidar and in situ data are available
                                                                         Action CA18235 PROBE (PROfiling the atmospheric Boundary
from the authors upon request. Sun–sky photometer data are acces-
                                                                         layer at European scale) and supported by COST (European Co-
sible on the AERONET website (http://aeronet.gsfc.nasa.gov/, last
                                                                         operation in Science and Technology; http://www.cost.eu, last ac-
access: 1 April 2020).
                                                                         cess: 25 May 2021). This study was also supported by the Marie
                                                                         Skłodowska-Curie Research Innovation and Staff Exchange (RISE)
                                                                         GRASP-ACE (grant no. 778349) project.
Author contributions. The conceptualization was done by JABO
and LAA. JABO performed the GRASP retrievals, analysed the
data, and wrote the manuscript. RR helped perform the GRASP re-
                                                                         Review statement. This paper was edited by Matthias Tesche and
trievals. JACV and HL operated and processed the in situ measure-
                                                                         reviewed by three anonymous referees.
ment at the Sierra Nevada Station. GT, NP, and AA performed the
installation of the instrumentation on board the aircraft and operated
the instruments during the flights. AC processed the airborne in situ
data. The lidar data acquisition was performed by JABO, GdAM,            References
JLGR, POA, RR, and AEBV. MH and OD provided feedback on
the GRASP algorithm. The formal analysis, investigation, writing         Alados-Arboledas, L., Muller, D., Guerrero-Rascado, J. L., Navas-
of the original draft, preparation, review of the writing, and edit-       Guzman, F., Pérez-Ramírez, D., and Olmo, F. J.: Optical and
ing were performed by JABO, JACV, RR, DPR, HL, and MJGM.                   microphysical properties of fresh biomass burning aerosol re-
The project administration, funding acquisition, and design of the         trieved by Raman lidar, and star-and sun-photometry, Geophys.
SLOPE I and II campaigns were done by FJOR and LAA. Coordi-                Res. Lett., 38, L01807, https://doi.org/10.1029/2010GL045999,
nation of the campaign was the responsibility of LAA. All authors          2011.
provided comments on the manuscript and helped with manuscript           Amiridis, V., Balis, D. S., Kazadzis, S., Bais, A., Gian-
corrections.                                                               nakaki, E., Papayannis, A., and Zerefos, C.: Four-year
                                                                           aerosol observations with a Raman lidar at Thessaloniki,
                                                                           Greece, in the framework of European Aerosol Research Li-
Competing interests. The authors declare that they have no conflict        dar Network (EARLINET), J. Geophys. Res., 110, D21203,
of interest.                                                               https://doi.org/10.1029/2005JD006190, 2005.
                                                                         Anderson, T. L. and Ogren, J. A.: Determining aerosol radiative
                                                                           properties using the TSI 3563 integrating nephelometer, Aerosol
Acknowledgements. Jose Antonio Benavent-Oltra is funded by the             Sci. Technol., 29, 57–69, 1998.
University of Granada through “Plan Propio. Programa 7, Convoca-         Ansmann, A., Riebesell, M., Wandinger, U., Weitkamp, C., Voss,
toria 2019”. Roberto Román is funded by MINECO under the post-             E., Lahmann, W., and Michaelis, W.: Combined Raman elastic
doctoral programme Juan de la Cierva-Incorporación (IJCI2016-              backscatter LIDAR vertical profiling of moisture, aerosol extinc-
30007). Juan Andrés Casquero-Vera is funded by MINECO un-                  tion, backscatter and LIDAR ratio, Appl. Phys. B, 55, 18–28,
der the predoctoral programme FPI (BES-2017-080015). Maria                 1992.
J. Granados-Muñoz received funding from the European Union’s             Barreto, Á., Cuevas, E., Granados-Muñoz, M. J., Alados-Arboledas,
Horizon 2020 research and innovation programme under the Marie             L., Romero, P. M., Gröbner, J., Kouremeti, N., Almansa, A.
Skłodowska-Curie grant agreement No 796539. Oleg Dubovik                   F., Stone, T., Toledano, C., Román, R., Sorokin, M., Hol-
was supported by the Labex CaPPA project, which is funded by               ben, B., Canini, M., and Yela, M.: The new sun-skylunar
the French National Research Agency under contract “ANR-11-                Cimel CE318-T multiband photometer – a comprehensive
LABX0005-01”. This work was also supported by the Spanish Min-             performance evaluation, Atmos. Meas. Tech., 9, 631–654,
istry of Economy and Competitiveness (projects CMT2015-66742-              https://doi.org/10.5194/amt-9-631-2016, 2016.
R, CGL2016-81092-R, CGL2017-85344-R, RTI2018-097864-B-                   Barreto, Á., Román, R., Cuevas, E., Pérez-Ramírez, D., J.
I00 and CGL2017-90884-REDT), by the Andalusia Regional Gov-                Berjón, A., Kouremeti, N., Kazadzis, S., Gröbner, J., Maz-
ernment through project P18-RT-3820 and the Unity of Excellence            zola, M., Toledano, C., Benavent-Oltra, J. A., Doppler,
“María de Maeztu” (project MDM-2016-0600) financed by the                  L., Juryšek, J., Almansa, A. F., Victori, S., Maupin, F.,
Spanish State Research Agency (AEI). The authors thankfully ac-            Guirado-Fuentes, C., González, R., Vitale, V., Goloub, P.,
                                                                           Blarel, L., Alados-Arboledas, L., Woolliams, E., Greenwell,

Atmos. Chem. Phys., 21, 9269–9287, 2021                                                    https://doi.org/10.5194/acp-21-9269-2021
You can also read


