Dating of the GV7 East Antarctic ice core by high-resolution chemical records and focus on the accumulation rate variability in the last ...
←
→
Page content transcription
If your browser does not render page correctly, please read the page content below
Clim. Past, 17, 2073–2089, 2021
https://doi.org/10.5194/cp-17-2073-2021
© Author(s) 2021. This work is distributed under
the Creative Commons Attribution 4.0 License.

Dating of the GV7 East Antarctic ice core by high-resolution
chemical records and focus on the accumulation rate
variability in the last millennium
Raffaello Nardin1 , Mirko Severi1,2 , Alessandra Amore1 , Silvia Becagli1,2 , Francois Burgay3,4 , Laura Caiazzo5 ,
Virginia Ciardini6 , Giuliano Dreossi2,3 , Massimo Frezzotti7 , Sang-Bum Hong8 , Ishaq Khan3 , Bianca Maria Narcisi6 ,
Marco Proposito6 , Claudio Scarchilli6 , Enricomaria Selmo9 , Andrea Spolaor2,3 , Barbara Stenni2,3 , and
Rita Traversi1,2
1 Department  of Chemistry “Ugo Schiff”, University of Florence, Florence, Italy
2 Institute
          of Polar Sciences of the National Research Council of Italy (ISP-CNR), Venice, Italy
3 Department of Environmental Sciences, Informatics and Statistics of the Ca’ Foscari University of Venice,

Venice, Italy
4 Laboratory of Environmental Chemistry (LUC), Paul Scherrer Institut, Villigen PSI, Switzerland
5 National Institute of Nuclear Physics (INFN), Florence, Italy
6 ENEA, Laboratory of Observations and Measures for the environment and climate, Rome, Italy
7 Department of Science, Geologic Sciences section, Roma 3 University, Rome, Italy
8 Division of Glacial Environmental Research, Korea Polar Research Institute (KOPRI), Incheon, South Korea
9 Department of Chemistry, Life Sciences and Environmental Sustainability, University of Parma, Parma, Italy

Correspondence: Mirko Severi (mirko.severi@unifi.it)

Received: 23 April 2021 – Discussion started: 3 May 2021
Revised: 27 August 2021 – Accepted: 15 September 2021 – Published: 13 October 2021

Abstract. Ice core dating is the first step for a correct        last millennium. A small yet consistent rise in accumulation
interpretation of climatic and environmental changes. In         rate (Tr = 1.6, p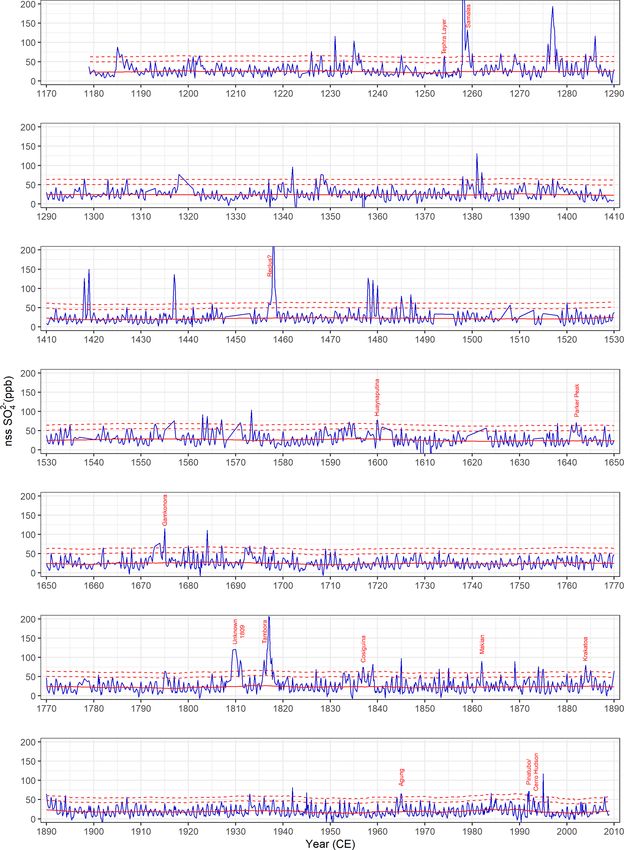
2074                                                                R. Nardin et al.: Dating of the GV7 East Antarctic ice core

tion, ITASE; East Antarctic International Ice Sheet Traverse,
EAIIST), a large part of the Antarctic ice sheet is still un-
explored and additional cores are needed to properly recon-
struct the past climate and to integrate this information in
climate modeling simulations. In particular, the last millen-
nium is a critical time frame for evaluating the more recent
human-related climate change into a longer temporal context
and to disentangle natural versus human impacts on climate
variability, but it is still poorly investigated, particularly in
Antarctica. New ice core records from Antarctica are needed
for a better assessment of the surface mass balance (SMB)
of the Antarctic continent, which is highly relevant for un-
derstanding its role in sea-level rise in recent decades and in
the near future (DeConto and Pollard, 2016; Krinner et al.,
2007). Spatial coverage of climatic observation in Antarc-
tica and the Southern Ocean is still poor (Jones et al., 2016;
Neukom et al., 2018) and ice core records have the potential
to investigate past SMB beyond the instrumental and satel-
lite period. Recently, Thomas et al. (2017) investigated the
Antarctic snow accumulation variability over the last millen-
nium at regional scale using a large number of snow accu-           Figure 1. GV7 (70◦ 410 17.100 S, 158◦ 510 48.900 E; 1950 m a.s.l.)
mulation records, grouped and assigned to different regional        drilling site (red square). Hercules Nevé (HN), Talos Dome (TD),
Antarctic areas and compared them with modeled SMB.                 GV5, GV2, D66, Dome C and Law Dome ice core drilling sites are
   In the framework of the Programma Nazionale di Ricerche          also shown (Greene et al., 2017; Fretwell et al., 2013).
in Antartide (PNRA) project “IPICS–2kyr-IT”, represent-
ing the Italian contribution to the project “The IPICS 2k
Array: a network of ice core climate and climate forcing            is found in both major sea-salt and non-sea-salt ions mea-
record for the last two millennia”, the latter being one of         sured in ice cores and their records have been used in ice
the four topics of the International Partnerships in Ice Core       core dating (e.g., nitrate, methanesulfonic acid (MSA) and
Sciences (IPICS), several drillings have been carried out on        the non-marine fraction of the sulfate (nssSO2− 4 ); Pasteris et
the Oates Coast, East Antarctica. In this framework, the site       al., 2014; Piccardi et al., 1994; Stenni et al., 2002; Udisti,
named GV7 (Fig. 1) was chosen to retrieve ice cores cover-          1996). MSA and nssSO2−   4 mainly arise from the atmospheric
ing at least 1000 years of climatic and environmental history       oxidation of their precursor dimethyl sulfide (DMS), which
of this area of Antarctica. The drillings were accomplished         in turn is produced by metabolic activities of marine phy-
through a bilateral Italy–South Korea collaboration, during         toplanktonic species (Stefels et al., 2007). The strong sea-
the 2013/2014 Antarctic summer.                                     sonality of DMS production leads to an analogous seasonal
   One of the most critical aspects of the study of the ice core    pattern of nssSO2−4 and MSA with the highest concentration
records is the dating of each ice layer, which is fundamen-         peaks during the phytoplanktonic bloom, occurring in austral
tal for putting the records into a temporal scale. Different        spring–summer (November–March) (Becagli et al., 2012).
methods were developed since the second half of the last cen-          Unlike MSA, which only arises from marine DMS
tury (Hammer, 1980) including the identification of seasonal        (Gondwe et al., 2003), nssSO2−  4 is formed also from the oxi-
pattern in chemical and physical records (Alley et al., 1997;       dation in the troposphere of SO2 , emitted during explosive
Cole-Dai et al., 1997; Extier et al., 2018; Sigl et al., 2016),     volcanic eruptions, to sulfuric acid (Delmas et al., 1985).
ice flow models and identification of temporal horizons such        These acidic components, thanks to tropospheric and strato-
as volcanic eruptions that cause spikes in the acidity of an        spheric circulation (Delmas et al., 1985) could be deposited
ice layer and/or trace element concentration (Castellano et         in polar regions during a period of 2–3 years after the event
al., 2005; Igarashi et al., 2011; Winstrup et al., 2012, 2019).     (Sigl et al., 2015), and their signal is superimposed over the
   Here, we focused on the identification of seasonal patterns      biogenic background of the nssSO2−    4 . The identification of
in the ionic and isotopic composition of the core, the latter       such volcanic signatures in ice core records is commonly
being one of the most reliable and extensively used meth-           used to synchronize ice core timescales (Severi et al., 2007,
ods used to date many ice cores. Since δ 18 O in falling snow       2012; Winski et al., 2019) and widely used to assign an abso-
varies with seasons (Dansgaard, 1964), showing maxima in            lute date to ice layers in a core (Castellano et al., 2005; Sigl
summer and minima in winter, it is possible to identify an an-      et al., 2013) in conjunction with the annual layer counting.
nual cycle in δ 18 O which is useful in the dating of a core. A
similar annual pattern with either summer or winter maxima

Clim. Past, 17, 2073–2089, 2021                                                        https://doi.org/10.5194/cp-17-2073-2021
R. Nardin et al.: Dating of the GV7 East Antarctic ice core                                                                  2075

   A similar seasonality (with a maximum in the austral sum-        finally constrain the dating by means of the major absolute
mer) is also observed in the nitrate concentration through-         temporal horizons provided by historically known volcanic
out the year. As one of the most abundant ions found in             eruptions. The obtained age scale allowed us to reconstruct
the cores (Legrand et al., 1999), nitrate is considered the fi-     the snow accumulation rate variability at GV7 over the last
nal sink of atmospheric NOx and due to its interaction with         millennium.
the main oxidant cycles in the atmosphere, it is considered
one of the potential markers to reconstruct the oxidizing ca-
pacity of the past atmosphere (e.g., Dibb et al., 1998; Hast-       2     Materials and methods
ings et al., 2005). Since some of these oxidizing processes,
combined with the photochemical ones, occur more intensely          2.1    Sampling site and fieldwork
during summer (Erbland et al., 2013; Grannas et al., 2007),
this marker can show a seasonal pattern as found in polar           The GV7 drilling site is on the Oates Coast, a coastal area of
records (Stenni et al., 2002; Wolff, 1995). However, it must        the East Antarctica (Fig. 1). The site was chosen for its rel-
be noted that the sources, transport and preservation of ni-        atively high snow accumulation rate (241 ± 13 mm w.e. yr−1
trate in the Antarctic snow layers are still not well under-        over the past 50 years), the limited post-depositional pro-
stood, and that the aforementioned processes are not the only       cesses due to the reduced intensity of katabatic winds along
factors affecting ion concentrations in the snowpack. Deposi-       the ice divide (Becagli et al., 2004; Frezzotti et al., 2007;
tion of HNO−  3 , post-depositional loss and recycling of NO3
                                                               −
                                                                    Magand et al., 2004) and the excellent chemical and iso-
(e.g., Röthlisberger et al., 2002; Shi et al., 2015; Zatko et       topic stratigraphies (Caiazzo et al., 2017; Frezzotti et al.,
al., 2016) are all variables influencing the final nitrate con-     2007). Internal layers of strong radar reflectivity observed
centration in ice cores. In particular, ultraviolet photolysis of   with ground-penetrating radar (GPR) are isochronous, and
nitrate and re-evaporation of HNO3 can affect the concentra-        surveys along continuous profiles provide detailed informa-
tion in the uppermost layers of snow, especially for sites with     tion on the spatial variability of snow accumulation. Esti-
low snow accumulation rate (Mulvaney et al., 1998; Röth-            mates of snow accumulation were calculated from GPR layer
lisberger et al., 2000, 2002; Berhanu et al., 2014). Despite        (dated to 1905 ± 9 AD) during the 2001–2002 ITASE expe-
that these processes might partially mask the seasonal pat-         dition from 150 km north of GV7 up to Talos Dome (Frez-
tern, nitrate records were successfully used for annual layer       zotti et al., 2007). Spatial distribution of snow accumulation
counting of ice cores from both hemispheres (Rasmussen et           from the GPR layer upstream from GV7 site shows that in-
al., 2006; Thomas et al., 2007; Wolff, 2013). An opposite           ternal layering and surface elevation are continuous and hor-
seasonal trend can be found for major sea-salt ions, show-          izontal up to 10 km from the site, revealing low ice velocity
ing late winter concentration maxima even in the innermost          0.3 ± 0.01 m yr−1 , no distortion of isochrones due to ice flow
regions of Antarctica (Udisti et al., 2012) due to a large in-      dynamics and very low snow accumulation spatial variability
flux of sea-salt aerosol during winter months (Bodhaine et          (less than 5 %, Frezzotti et al., 2007). An extensive chemical
al., 1986). This seasonal pattern was observed at coastal sta-      dataset covering 7 years of deposition on site obtained from
tions (Mulvaney and Wolff, 1994; Weller et al., 2011), and          the analysis of two snow pits is already available (Caiazzo
Na+ and Mg2+ records were successfully used in the dating           et al., 2017), as well as a detailed reconstruction of the past
of ice cores (Herron and Langway, 1979; Winski et al., 2019).       volcanic history (Nardin et al., 2020).
However, multiple sources contribute to the concentration of           During the 2013/14 Antarctic campaign, six shallow firn
sea-salt ions in an ice core, and during winter months, the         cores (ranging in length between 5 and 50 m) and two inter-
increase of sea ice extent (SIE) could in principle reduce          mediate firn-ice cores (87 and 250 m deep) were retrieved.
the amount of sea spray delivered to the site. Since sea-salt       The 250 m deep core (named GV7(B) was used in this study.
aerosol is generated over open water by bubble bursting (de         The ice core was retrieved using an electromechanical drill
Leeuw et al., 2011), the increase of SIE during the winter          (Eclipse ice drill instrument).
months could increase the distance from this source result-            The drilling started at 3 m from the snow surface and
ing in a loss of particles from the ocean during the long-range     reached a depth of 250.2 m. Drilling fluid (Exxsol D40) was
transport (Abram et al., 2013), potentially masking the sea-        used from a depth of 80 m (close-off at 75 m) and added to
sonal pattern. Here, we present the dating of the uppermost         the borehole with a tube. A stand of 4 m of fluid was found to
197 m of the 250 m deep ice core collected at GV7, focusing         be ideal to aid the drilling operation and to maintain an ade-
on the interpretation of ion concentration records. We inves-       quate quality of the core. No casing of the borehole was used
tigated the seasonality of the major ion markers in order to        to complete this shallow drilling. The Eclipse system has ex-
select the most reliable ones for annual layer-counting pur-        perienced problems during the drilling below 100 m depth;
poses. Non-sea-salt sulfate revealed to be the most suitable        the brittleness of the ice, breaks in the core and the presence
parameter to point out the annual layers. For the uppermost         of drilling fluids in these cracks proved to be a problem in
38 m of the ice core, the dating was corroborated by the high-      the decontamination of the deeper sections of the core. The
resolution δ 18 O record. Volcanic signatures were then used to     presence of numerous breaks prevented us from analyzing

https://doi.org/10.5194/cp-17-2073-2021                                                        Clim. Past, 17, 2073–2089, 2021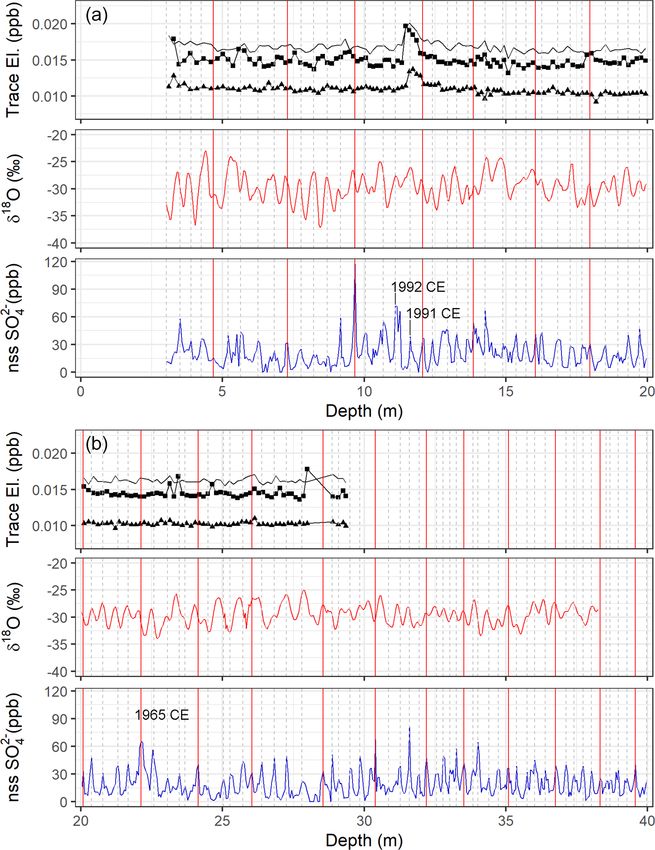
2076                                                               R. Nardin et al.: Dating of the GV7 East Antarctic ice core

the deeper part of the core and only the upper 194 m were          versity of Venice, using both the IRMS water–CO2 equilibra-
analyzed.                                                          tion technique (Thermo-Fisher Delta Plus Advantage cou-
                                                                   pled with a HDO automatic equilibration device) and the
2.2    Ice core analysis
                                                                   cavity ring-down spectroscopy (CRDS) technique (Picarro
                                                                   L1102-I). The Thermo-Fisher Delta Plus and the Delta Plus
The 60 cm long ice core sections (cut and logged directly          advantage are both characterized by an analytical precision
in field) were shipped to the EUROCOLD laboratory of the           of 0.05 ‰ for δ 18 O, while the Picarro L1102-I has an an-
University of Milano–Bicocca (Italy) where they were cut           alytical precision of 0.10 ‰ for δ 18 O. All measurements
longitudinally and transversally and distributed among dif-        were calibrated using internal isotopic standards periodically
ferent research groups. The 4×4×60 cm core strips for ionic        calibrated against the certified International Atomic Energy
content analysis were sealed in plastic bags, shipped frozen       Agency (IAEA) standards Vienna Standard Mean Ocean Wa-
to the cold room of the Department of Chemistry of the Uni-        ter 2 (VSMOW2) and Standard Light Antarctic Precipitation
versity of Florence (Italy) and stored at −20◦ C until the mo-     2 (SLAP2). All the isotopic data are reported in the SMOW-
ment of analysis. Conversely, both the bag (60 cm) and the         SLAP δ scale.
high-resolution (4 cm) samples for the isotopic analysis were
melted at room temperature and transferred in 25 mL HDPE           2.3   Major ion contributions
bottles at the EUROCOLD laboratory and then sent to the
Ca’ Foscari University of Venice and the University of Parma       Chemical records of the ion markers were obtained by plot-
for the isotopic measurements.                                     ting the concentration (in µg L−1 ) against the mid-depth of
   The strips for ionic content were manually decontaminated       the sample, logged during the decontamination procedure.
inside the cold room of the Department of Chemistry of the         The raw data set of ion concentration was kept as close as
University of Florence (Italy) by scraping the outermost layer     possible to the original, and only extremely high concen-
of ice (approximately 1 cm) using ceramic knives to remove         tration points (i.e., spikes in the concentration of a single
external contamination (Candelone et al., 1994; Chisholm et        ion) were discarded and attributed to external contamina-
al., 1995; Tao et al., 2001; Caiazzo et al., 2016).                tion. Hence, all the points above the 99th percentile for all
   All decontamination procedures were carried on under a          the ions taken into account for the dating procedure were re-
class-100 laminar-flow hood and the subsamples (mean res-          moved; this was chosen as a fair compromise to keep high
olution of 4.5 cm) were stored inside pre-cleaned plastic vials    values of concentration due to particular events (e.g., vol-
and analyzed within a week to avoid external contamination.        canic eruptions) and at the same time to remove those due
Some sections of the ice core were too badly damaged to            to possible contamination. The nssSO2−  4 concentration was
be manually decontaminated, likely due to problems in the          calculated by Eq. (1).
drilling operations and handling of the ice. In this case, the
fractures were logged and the sample decontaminated just           nssSO2−       2−           +
                                                                        4 = totSO4 − 0.25 · Na ,                              (1)
before the analysis by quickly submerging it three times (10 s
for the first wash, then 5 s for the remaining two) in ultrapure   where 0.253 is the average SO2−          +
                                                                                                     4 / Na ratio in seawater
                                                                                           2−         +
water (18.2 M 25 ◦ C) in order to remove the outer layer          (Bowen, 1979), tot-SO4 and Na are the total measured
of ice. Each subsample was melted at room temperature un-          concentration of the two ions, respectively. We assumed that
der a class-100 laminar-flow hood just before the analysis.        the only contribution for sodium is the sea spray aerosol
The subsamples were then analyzed for ionic content using          (Legrand and Delmas, 1984; Maupetit and Delmas, 1992).
two ion chromatographs operating simultaneously: a Thermo          Both in inland (Röthlisberger et al., 2002) and coastal sites
Dionex ICS-1000 for the determination of the cations (Li+ ,        (Benassai et al., 2005; Nyamgerel et al., 2020), the crustal
Na+ , NH+       +     2+      2+
           4 , K , Mg , Ca ) and a Thermo Dionex DX-500            contribution of sodium is found to be very low or negligible
for anions (F , formate, methanesulfonate (MS− , referred
                −                                                  compared to the marine one. We calculated the terrestrial and
                                               2−
to in the text as MSA), Cl− , NO−     3 and SO4 ). Further de-     marine contributions for Na+ and Ca2+ in GV7(B) core by
tails about the separation methods used and the daily cali-        using a simple equation system (Eq. 2) (Becagli et al., 2012;
bration procedures for each ion chromatographic system are         Udisti et al., 2012):
described in Caiazzo et al. (2016) and Morganti et al. (2007).
   Samples for isotopic analysis did not require any de-            tot−Na+ = ss−Na+ + nss−Na+
contamination procedure. Bag samples (60 cm) were ana-              tot−Ca2+ = ss−Ca2+ + nss−Ca2+
lyzed for δ 18 O at the University of Parma, using a Thermo-                                                                  (2)
                                                                    ss−Na+ = tot−Na+ −0.562 nss−Ca2+
Fisher Delta Plus isotope-ratio mass spectrometer (IRMS)            nssCa2+ = tot−Ca2+ −0.038 ss−Na+ ,
coupled with a HDO automatic equilibration device, fol-
lowing the classical water–CO2 equilibration technique de-         where 0.562 and 0.038 represent the Na+ / Ca2+ w/w ratio
scribed by Epstein and Mayeda (1953). High-resolution sam-         in the crust (Bowen, 1979) and seawater (Nozaki, 1997), re-
ples (4 cm) were analyzed for δ 18 O at the Ca’ Foscari Uni-       spectively. The non-sea-salt fraction of Na+ was found to

Clim. Past, 17, 2073–2089, 2021                                                      https://doi.org/10.5194/cp-17-2073-2021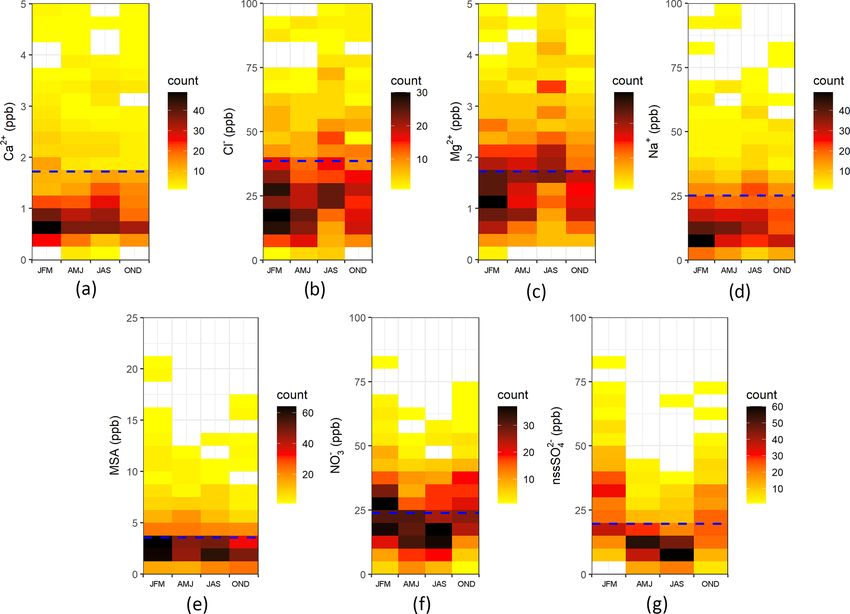
R. Nardin et al.: Dating of the GV7 East Antarctic ice core                                                                  2077

be about 3 % of tot-Na+ on average, supporting our choice          randa (2004). The methodology consists of a least-squares
of using tot-Na+ instead of ss-Na+ for the calculation of          approach to compute the best continuous set of straight lines
nssSO2−4 fraction.                                                 that fit a given time series, subject to a number of constraints
   The nssSO2− 4 was used to identify volcanic signatures
                                                                   on the minimum distance between breakpoints and, option-
in the GV7(B) ice core using already established methods           ally, on the minimum trend change at each breakpoint. We
(Castellano et al., 2004, 2005; Sigl et al., 2013; Traufetter et   chose a period of 150 years as the minimum distance to iden-
al., 2004) on Arctic and Antarctic ice cores. The biogenic         tify trend at centennial scale. The choice is not objective but
background was calculated as the running average of the            complies with the high computational request for too-small
nssSO2−4 concentrations and its standard deviation (σ ) was
                                                                   minimum distance and the risk of non-significance for too-
used to set the threshold over which a sample point was to be      large minimum distance. Due to possible noise connected to
attributed to a volcanic eruption. Both 2σ and 3σ were used        local spatial variability (Frezzotti et al., 2007) at the three
as thresholds added to the average biogenic background, de-        sites (Talos Dome, GV7 and Law Dome), we applied the pro-
scribed more in detail in Nardin et al. (2020).                    cedure to a 7-year smoothed average in order to make all the
                                                                   cores comparable among them.
2.4   Trace element analysis
                                                                   3     Results and discussion
The ice samples were analyzed with an inductively coupled
plasma single-quadrupole mass spectrometer (ICP-qMS, Ag-           The relatively high snow accumulation rate at the site (well
ilent 7500 series, USA) equipped with a quartz Scott spray         above 200 mm w.e. yr−1 , Frezzotti et al., 2007) allows for ac-
chamber. A 120 s rinsing step with 2 % HNO3 (Suprapure,            curate dating of the core by counting successive snow lay-
Romil, UK) was performed after each sample to limit any            ers, identifiable by markers having seasonal pattern and/or
possible memory effect; the vials used for standard prepara-       the identification of specific dated event, mainly as volcanic
tion were cleaned following the same procedure adopted for         eruptions identified in the records as spikes of nssSO2−
                                                                                                                          4 sta-
ice samples. Quantification of 209 Bi, 205 Tl and 238 U was per-   tistically higher than the biogenic background (Nardin et al.,
formed using external calibration curves with acidified stan-      2020).
dards (2 % HNO3 , Suprapure, Romil, UK) from dilution of
certified IMS-102 multi-elemental standard (10 ppm ±1 %,           3.1    Ice core dating procedure – upper section
Ultra Scientific). The resulting external calibration curves
for the three elements always showed regression coefficients       Previous work on snow pit dating at the GV7 site (Caiazzo
higher than 0.999. The limit of detection (LoD) for Tl and         et al., 2017) revealed that nssSO2−         18
                                                                                                      4 and δ O records show
U was 0.001 µg L−1 , while for Bi it was 0.004 µg L−1 , calcu-     the clearest seasonal pattern with in phase summer maxima.
lated as 3 times the standard deviation of the blank.              Therefore, for the uppermost section of the core (38.27 m)
                                                                   for which the δ 18 O high-resolution record was available, ac-
                                                                   curate dating was obtained using nssSO2−          18
                                                                                                            4 and δ O records
2.5   Snow accumulation rate and trend analysis                                                                   2−
                                                                   (Fig. 2). The seasonal maxima in the nssSO4 record were
On the basis of the achieved dating, the annual snow accumu-       confirmed by corresponding maxima in the δ 18 O profile. Mi-
lation rate at the site was calculated in millimeters of water     nor discrepancies between the two profiles were to be ex-
equivalent per year (mm w.e. yr−1 ) by using the density of the    pected and are probably due to the slightly different depth
core sections and a correction of the layer thickness through      resolution of the two series (4.5 and 4 cm on average for
a thinning function. The density (in g cm−3 ; see Fig. S3) was     nssSO2−          18
                                                                           4 and δ O, respectively). The reliability of this dat-
evaluated by weighting each section of the core directly in the    ing was further supported when compared with the volcanic
field after logging. The effects of layer thinning due to verti-   signatures identified in the nssSO2−4 and the trace element
cal strain rate were accounted for using a linear least-squares    profiles (Fig. 2). The 1992 Pinatubo sulfate deposition (10.9–
fitting model (Dansgaard and Johnsen, 1969) considering a          11.4 m depth) and 1964 Agung volcanic sulfate deposition
constant vertical strain rate on the upper 200 m and an ice        (21.8–22.4 m) were used to constrain the dating.
thickness of 1530 m for the GV7 site. We did not consider             As discussed in a previous study (Nardin et al., 2020), nei-
any flow-induced layer thinning since: (1) GV7 is located on       ther of these volcanic eruptions shows a prominent signal in
the ice divide extending from the Oates Coast to Talos Dome;       the nssSO2−4 profile, and trace element records were used to
(2) the ice velocity at this site is very low (max. 0.3 m yr−1 )   support the 1992 CE tie point identification.
(Frezzotti et al., 2007); (3) the ice thickness upstream GV7 is       Trace element deposition in polar ice caps is mainly as-
nearly constant, and thus we expect a rather constant thinning     sociated with dust deposition. Evidence for anthropogenic
function.                                                          contribution in the global trace element deposition is well
    Trend analysis of the accumulation rate variability was        documented, such as the increase in lead depositional flux in
based on the calculation of breakpoints between periods            connection with the introduction of lead containing gasoline.
with significantly different trends following Tomé and Mi-         Specific trace elements such as Tl and Bi have been proposed

https://doi.org/10.5194/cp-17-2073-2021                                                       Clim. Past, 17, 2073–2089, 2021
2078 R. Nardin et al.: Dating of the GV7 East Antarctic ice core
Figure 2. Concentration profiles of trace elements (205 Tl, solid black line, 209 Bi, black squares, 238 U, black triangles), δ 18 O (red line)
and nssSO2−
4 (blue line) along the uppermost 20 m (a) and 20–40 m intervals (b) of the GV7 (B) core. Vertical dashed gray lines and red
lines mark annual and 5-year intervals, respectively. The Agung and Pinatubo/Cerro Hudson volcanic signatures are also highlighted in the
nssSO2−4 profile with their deposition years.
to be enriched in deposition derived from volcanic eruptions element) deposition often occurs earlier than sulfate, as re-
(Candelone et al., 1995; Kellerhals et al., 2010). In fact, Bi, ported by Hwang et al. (2019) for the same volcanic erup-
Tl and U show an increased concentration between 11.03 tion recorded in snow pits from Dome Fuji area. No clear
and 12.90 m (205 Tl), 11.33 and 12.62 m (209 Bi) and 11.03 evidence of a statistically significant increment in the 205 Tl,
and 13.33 m depth (238 U; see Fig. 2), corresponding to the 209 Bi or 238 U levels was found in correspondence with the
1989–1992 CE time period, according to the annual layer- 1963 Agung eruption. For this section of the core, only the
counting dating. Bi, Tl and U concentration peaks seem to nssSO2−4 signal was used to constrain the dating. As a con-
be not perfectly coeval with the Pinatubo/Cerro Hudson sig- clusion, the uppermost section of the core (3.00 to 38.27 m)
nature in the nss-sulfate profile, being recorded at a slightly was dated and was found to cover the time period (2009–
higher depth with respect to nssSO2− 4 . This small time gap 1920 CE). The uncertainty of this dating is discussed further
can be explained considering that dust (and therefore trace below.
Clim. Past, 17, 2073–2089, 2021 https://doi.org/10.5194/cp-17-2073-2021R. Nardin et al.: Dating of the GV7 East Antarctic ice core 2079
3.2 Ice core dating procedure – lower section we estimated the uncertainty of the annual layer counting as
the sum of the layer uncertainties highlighted in the dating
Due to the lack of high-resolution data for δ 18 O for the procedure, estimated to be 0.5 ± 0.5 years (Rasmussen et al.,
deeper part of the core, only ion signatures could be used for 2006). The uncertainty was estimated between the two con-
the dating of the rest of the core. In order to highlight the sea- secutive known volcanic signatures in the core, dated with an
sonal character of each ion and to assess their reliability for uncertainty of ±1 year from the recorded eruption due to the
dating purposes, we considered the concentration profile of time needed to reach Antarctica.
each ion throughout the 89 years already dated in the above The same level of uncertainty was assigned to the miss-
section. Each year was equally divided in four parts corre- ing sections of the core, where the number of years present
sponding to the Antarctic seasons and roughly to the time was estimated using the average ratio between the number
periods January–March, April–June, July–September and of years and related depth interval calculated in 10-year time
October–December, and bin plots were produced (Fig. 3). In span before and after the break. Uncertainty levels are re-
this way, we were able to point out the markers showing a ported in Table 2; the relatively higher number of uncertain
clear seasonal pattern by using bin plots (Fig. 3). When com- layers in the lower section of the core is due to missing ice
paring the profile of each ion to the average calculated in the (whose percentage is reported in Table 2 as well) that led
considered time interval (dashed blue line in Fig. 3), all the to a non-continuous profile and to a lower resolution of the
species showed a maximum throughout the year. Anyway, as core. There are fewer major eruptions in this section of the
shown in Fig. 3, the most pronounced seasonal pattern was core (Table 1) and as they are further apart, the uncertainty
shown by nssSO2− 4 with a high occurrence of low concen- becomes larger.
tration points during winter months and a high occurrence
of high concentration points at the beginning of the year. 3.3 Mean snow accumulation rate evaluation
Typical sea-salt ions showed winter maxima, and especially
Mg2+ (Fig. 3c), with generally higher values of concentra- A mean accumulation rate of 242 ± 71 mm w.e. yr−1 for the
tion (up to 3.5 µg L−1 compared to an average of 1.7 µg L−1 ), period 2008–2013 CE was found at the same site by Caiazzo
but in general the most populated bins in the winter and sum- et al. (2017). This value is very close to the accumulation
mer periods showed similar concentrations, suggesting a lack rate over the previous 35 years made by Magand et al. (2004)
of clear seasonality. using atomic bomb horizon markers (241 ± 13 mm w.e. yr−1
These considerations only cover a small section of the from 1965 to 2000 CE). Frezzotti et al. (2007) reported
core (approximately the 20 % of its length), but as shown in an accumulation of 252 ± 104 mm w.e. yr−1 for the period
Fig. S1, neither Na+ nor Mg2+ concentration profiles seem 2001–2004 CE using snow stake farm measurements. For a
to show a clear annual pattern at relatively high depths and longer time period (1854–2004 CE), a mean accumulation
not always a maximum in the nssSO2− 4 concentration coin- of 237 mm w.e. yr−1 was assessed using atomic bomb mark-
ciding with a minimum in the other two ions concentration. ers and nssSO2−4 spikes from known volcanic events as age
Based on the seasonality of the ionic markers (here high- markers (Frezzotti et al, 2007).
lighted by the bin plots), we tested several dating procedures The mean GV7(B) accumulation rates here calculated for
for the GV7(B) ice core reported in the literature. We tried the 1965–2000 CE and 1854–2004 CE time intervals (242 ±
both single-parameter and multiparametric approaches as 57 mm w.e. yr−1 and 233±64 mm w.e. yr−1 , respectively) are
proposed, for instance, by Herron and Langway (1979), Ud- in good agreement with those found in the snow pits, stake
isti (1996) and Winski et al. (2019), but the nssSO2− 4 profile measurements and shallow ice cores previously reported.
solely showed the clearest seasonal signal along the whole Considering the full ice core record (195 m), covering the
core (Figs. S1 and S2). The dating of the core was therefore 1179–2009 CE time interval, the mean snow accumulation
carried out with a combination of annual layer counting and resulted to be 205±63 mm w.e. yr−1 , lower than the one pre-
the identification of volcanic signatures, both from nssSO2− 4 viously measured for the last centuries.
profile. The known past volcanic eruptions found in other ice The comparison between GV7(B) and the GV7 ITASE
cores (Sigl et al., 2013, 2015, 2016; Zielinski et al., 1996) as records (Fig. 6) highlights a similar variability in annual
well as a tephra layer (Narcisi et al., 2001, 2012; Narcisi and snow accumulation especially in the period ranging from
Petit, 2021) and their assigned date are reported in Table 1. 1900 to 2001 CE where the linear correlation between the
The complete record of nssSO2− 4 is reported in Fig. 4 and the two cores is high and significant (R = 0.42, p2080 R. Nardin et al.: Dating of the GV7 East Antarctic ice core
Figure 3. Seasonal variability of Ca2+ (a), Cl− (b), Mg2+ (c), Na+ (d), MSA (e), nssSO2− −
4 (f) and NO3 (g) concentrations in the GV7(B)
ice core. Concentration bins are 3 “months” in width (JFM, AMJ, JAS, OND) and 5 ppb in height except for MSA levels (1 ppb) and calcium
and magnesium (0.25 ppb). Dashed blue lines show the average concentration of each ion in the investigated time interval.
Table 1. Past known volcanic eruptions used in the dating of the core.
Volcano Depth (m) Historical eruption date Assigned deposition
Interval Max. nssSO2−
4 (start) year (CE) date year (CE)
Pinatubo/Cerro Hudson 10.91–11.42 11.10 1991 1992
Agung 21.82–22.43 22.12 1963 1965
Krakatoa 49.01–49.53 49.35 1883 1884
Makian 55.55–56.12 55.75 1861 1863
Cosigüina 63.05–63.64 63.27 1835 1837
Tambora 68.16–69.18 68.75 1815 1816
Gamkonora 100.90–101.61 101.25 1673 1675
Parker Peak 108.18–108.77 108.39 1641 1642
Huaynaputina 117.38–117.62 117.48 1600 1600
Reclus? 145.05–145.61 145.41 1460 1460
Samalas 181.40–182.12 181.86 1257 1258
Tephra layer 182.07–183.14 183.07 1253 1254
timation) of the yearly accumulation rate, a stacked record tic region, facing the Southern Indian Ocean, only three ice
was obtained by combining the available records: a snow core records of snow accumulation cover a period longer
pit covering the 2008–2013 CE time interval; GV7(B) core than three centuries: GV7 stacked (1179–2013 CE, this pa-
(1079–2009 CE), stake measurements (2001–2003 CE) and per), Law Dome (−22–2012 CE; Roberts et al., 2015) and
GV7 ITASE core (1849–2001 CE). The new stacked record Talos Dome (1217–2010 CE; Stenni et al., 2001; Thomas et
(Fig. 6) can give valuable information on snow accumula- al., 2017). Other cores (D66, GV5, GV2, HN) have been
tion trend in the Antarctic region through comparison with drilled but their records cover less than 300 years (Frezzotti
other ice cores drilled in the same sector. In the East Antarc- et al., 2013; Thomas et al., 2017). Law Dome (DSS) is a
Clim. Past, 17, 2073–2089, 2021 https://doi.org/10.5194/cp-17-2073-2021R. Nardin et al.: Dating of the GV7 East Antarctic ice core 2081
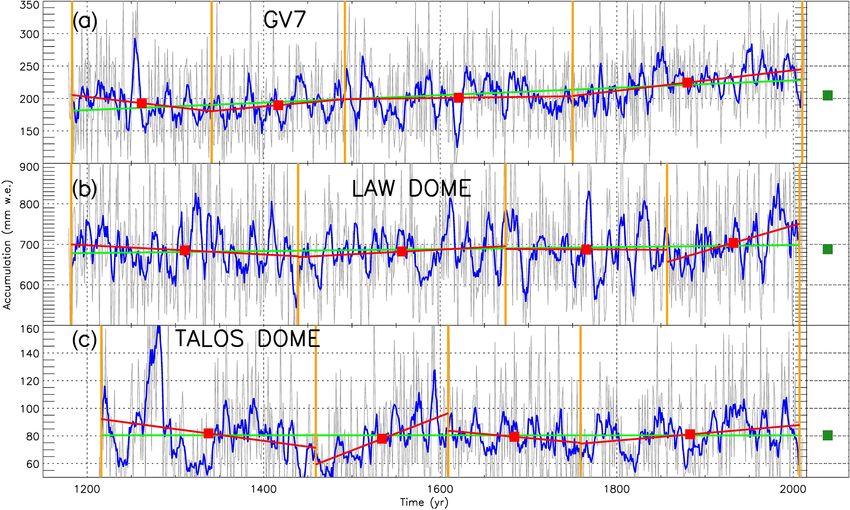
Figure 4. GV7(B) nssSO2−
4 profile plotted on the age scale produced in this paper. Biogenic background (solid red) and thresholds used to
identify the volcanic signatures (2σ and 3σ , dashed red) are also reported.
https://doi.org/10.5194/cp-17-2073-2021 Clim. Past, 17, 2073–2089, 20212082 R. Nardin et al.: Dating of the GV7 East Antarctic ice core
Table 2. Uncertainty of the GV7(B) ice core dating in the depth intervals comprised between two consecutive volcanic eruptions. Missing
sections of the core, as percentages, are also reported.
GV7(B) section Missing ice Local max in Annual layers Duration Counting error
(m) (%) nssSO2−
4 Certain Uncertain (yrs) Abs (yrs) Percentage
3.00–11.10 0.37 17 17 0 17 – –
11.10–22.12 0.18 28 26 2 27 1 3.7
22.12–49.35 0.48 86 76 10 81 5 6.2
49.35–55.75 0.31 27 21 2 22 1 4.5
55.75–68.75 0.38 50 42 12 48 6 12.5
68.75–101.25 2.15 146 136 10 141 5 3.5
101.25–108.39 2.46 34 31 2 32 1 3.1
108.39–117.48 2.53 44 37 8 41 4 9.8
117.48–145.41 8.80 142 133 18 142 9 6.3
145.41–181.86 3.76 200 188 24 200 12 6.0
181.86–183.07 0.82 4 4 0 4 – –
183.07–197.00 0.18 75 69 12 75 6 8.0
crease in accumulation rate higher than 10 % was observed
in coastal and slope regions, in agreement with our find-
ings for the GV7 site. The breaking point analysis (Fig. 7)
showed that each site is characterized by multi-centennial
time intervals with different trends. GV7 shows a low ac-
cumulation rate from the beginning of record (1200 CE) to
the middle of the 14th century; a similar decrease had been
already observed at Law Dome (Roberts et al., 2015) and
Talos Dome (Stenni et al., 2001) (Fig. 7). The GV7 accu-
Figure 5. Age–depth relationship for the GV7(B) ice core. Tem- mulation rate record shows an increase from the middle of
poral horizons used as constraints in the dating procedure are high- the 18th century up to now; the same trend can be observed
lighted with red circles. for Talos Dome (Table 3), whereas at Law Dome such an in-
crease starts about a century later. Previous studies regarding
the Talos Dome–GV7 area pointed out a century-scale vari-
ability with a slight increase (of a few percent) in accumu-
site close to the Southern Ocean (100 km from the shore- lation rates over the last two centuries, particularly since the
line) at about 1400 m a.s.l. with a mean accumulation rate 1960s, compared with the period 1816–1965 CE (Frezzotti et
of 740 mm w.e. yr−1 over the last two millennia (van Om- al., 2007, 2013). At GV7, the observed increase in accumu-
men et al., 2004). We must take into account that the DSS lation during the last 250 years is greater than the observed
site is about 1900 km west of GV7. Talos Dome is located range for the previous 600 years (Fig. 7). For Talos Dome,
at 2316 m a.s.l. and 250 km south inland of GV7, with a Stenni et al. (2001) pointed out a decrease during part of the
long-term accumulation rate of 80 mm w.e. yr−1 over the last Little Ice Age, 1217–1996 CE, followed by an increase of
800 years (Stenni et al., 2001). The comparative analysis about 11 % in accumulation during the 20th century. On the
of the last 800 years of these three records shows a signif- other hand, Roberts et al. (2015) found out that the 2000-
icant trend in the accumulation rate record at GV7 and Law year (22 BCE to 2012 CE) record at Law Dome showed no
Dome (Table 3), with a high increase in the accumulation long-term trend in snow accumulation rates, although sev-
rate at GV7 and a slight increase at Law Dome (47 and eral anomalous periods of accumulation rate can be spotted
20 mm w.e., ∼ 23 % and ∼ 2 % of the mean accumulation in the record. The accumulation variability observed at Law
over 800 years, respectively). On the other hand, no signifi- Dome was associated with both the El Niño–Southern Os-
cant trend at Talos Dome can be pointed out (Table 3). Frez- cillation (ENSO) and Interdecadal Pacific Oscillation (IPO)
zotti et al. (2013) analyzed 67 records from the entire Antarc- (Roberts et al., 2015; Vance et al., 2015), which influence
tic continent over the last 800 years to assess the temporal the meridional component of the large-scale circulation (van
variability of accumulation rates. The temporal and spatial Ommen and Morgan, 2010; Roberts et al., 2015; Vance et
variability of the records highlights that snow accumulation al., 2015). Thomas et al. (2017), using 79 annually resolved
changes over most of Antarctica are statistically negligible snow accumulation records, showed that snow accumulation
and do not exhibit a clear long-term trend. However, an in-
Clim. Past, 17, 2073–2089, 2021 https://doi.org/10.5194/cp-17-2073-2021R. Nardin et al.: Dating of the GV7 East Antarctic ice core 2083
Figure 6. (a) Time series from 1840 to 2020 CE of the GV7 snow pit (2008–2013 CE, gold line), the ITASE core (1849–2001 CE, orange
line) and the GV7(B) core (1179–2009 CE, green line). Blue and black lines highlight the stacked record, obtained by integrating the snow
pit, ITASE and GV7(B) core records, and its smoothing at 7 years, respectively. (b) GV7 stacked time record (1179–2013 CE) with a 7-year
smoothing average (black line). Vertical red bars highlight volcanic eruption horizons, and the red line shows the average accumulation rate
between different volcanic events.
for the entire Antarctic continent increased since 1800, and GV7(B) ice core to accurately date the core with a sub-annual
the annual snow accumulation during the most recent decade resolution. The δ 18 O high-resolution record was compared to
(2001–2010) is higher than the annual average at the start the nssSO2− 4 profile showing negligible discrepancies. The
of the 19th century. The Antarctic Peninsula is the only re- two records were used to achieve a reliable dating of the up-
gion where both of the most recent 50- and 100-year trends permost section of the core (approximately 40 m, covering
are larger than the observed range for the past 300 years. the time period between 1920 and 2009 CE).
This result is coherent with the trend increase highlighted For the deeper section of the core, different strategies
in this paper by breaking point analysis applied to the GV7 were tested and compared, namely single-parameter and
stacked record. Although in different periods some common multi-parametric approaches by considering seasonal mark-
trends are evident in the records, there is not a clear agree- ers to accomplish an annual layer counting. Upon these tests,
ment among all the accumulation records. This can be ex- nssSO2−4 profile was chosen for the dating of the core be-
plained by the different origin and atmospheric pathways of cause of its clearer and better-preserved seasonal pattern all
the air masses responsible of the precipitation at the three along the ice core, even at higher depths, where the temporal
sites, despite being located in the same macro region of East resolution becomes lower due to the thinning of the ice lay-
Antarctica. Indeed, precipitation over the GV7 area is related ers. An accurate annual layer-counting process was applied,
to storms coming from the southern Indian Ocean (Caiazzo et and the volcanic signatures identified in the GV7(B) ice core
al., 2017) as for Law Dome, whereas the precipitation at Ta- were used as temporal horizons and tie points in the dating
los Dome is coming only for 50 % from the southern Indian procedure. In this way, accurate dating of the core with a
Ocean and the remainder is from the Ross Sea (Sodemann sub-annual resolution for the uppermost 197 m was obtained.
and Stohl, 2009; Scarchilli et al., 2011). Unfortunately, beyond the depth of 197 m, the ice core was
strongly damaged and thus heavily contaminated from the
4 Conclusions
drilling fluid also in the inner part. The GV7(B) chronology
covers the 1179–2009 CE period. The average annual snow
In this work, we used the chemical stratigraphies obtained accumulation for this period is 205 mm w.e. This value was
from the analysis of about 3500 discrete samples from the compared with already available records from the same site
https://doi.org/10.5194/cp-17-2073-2021 Clim. Past, 17, 2073–2089, 20212084 R. Nardin et al.: Dating of the GV7 East Antarctic ice core
Figure 7. (a) GV7 stacked record (gray line) with its 7-year smoothing average (blue line); green line represents trend for the 1179–2013 CE
record. Vertical yellow bars show breaking points (1183, 1341, 1492, 1750 and 2010 CE) calculated following Tomé and Miranda (2004).
Red lines and filled squares show partial trends and mean accumulation (with standard deviation error bars) for each subperiod defined by
breaking points. The green-filled square with the error bar highlights mean accumulation at the site and its standard deviation, respectively,
for the whole period (1179–2013 CE). (b) Same as panel (a) but for Law Dome ice core for the period 1179–2013 CE with breaking points at
1182, 1439, 1674, 1857 and 2007 CE. (c) Same as panel (a) but for Talos Dome ice core for the period 1216–2010 CE with breaking points
at 1216, 1459, 1609, 1759 and 2007 CE.
Table 3. Values of trend (Tr, mm w.e. decade−1 ), associated significance (p value) and mean accumulation rate (M, mm w.e. yr−1 ) for GV7
stacked, Law Dome and Talos Dome records smoothed using a 7-year running average. The time intervals reported in the table correspond
to the different periods defined by breaking point analysis.
GV7 1183–2010 1183–1341 1341–1492 1492–1750 1750–2010
stacked Tr = + 0.6 Tr = − 1.6 Tr = 1.2 Tr = 0.2 Tr = 1.6
(pR. Nardin et al.: Dating of the GV7 East Antarctic ice core 2085
ber of cores that are able to cover the same time period is References
still scarce; therefore, the present study could significantly
contribute to the long-term assessment of the surface mass
balance in this area.
Abram, N. J., Wolff, E. W., and Curran, M. A. J.: A review of sea ice
proxy information from polar ice cores, Quaternary Sci. Rev., 79,
168–183, https://doi.org/10.1016/j.quascirev.2013.01.011, 2013.
Data availability. The GV7(B) chronology, volcanic tie points,
Alley, R. B., Shuman, C. A., Meese, D. A., Gow, A. J., Tay-
uncertainty of the age scale and supporting data sets will be made
lor, K. C., Cuffey, K. M., Fitzpatrick, J. J., Grootes, P. M.,
available upon request to the corresponding author.
Zielinski, G. A., Ram, M., Spinelli, G., and Elder, B.: Visual-
stratigraphic dating of the GISP2 ice core: Basis, reproducibility,
and application, J. Geophys. Res.-Oceans, 102, 26367–26381,
Supplement. The supplement related to this article is available https://doi.org/10.1029/96JC03837, 1997.
online at: https://doi.org/10.5194/cp-17-2073-2021-supplement. Becagli, S., Proposito, M., Benassai, S., Flora, O., Genoni,
L., Gragnani, R., Largiuni, O., Pili, S. L., Severi, M.,
Stenni, B., Traversi, R., Udisti, R., and Frezzotti, M.: Chem-
Author contributions. RN, MS, AA, SB, LC, SBH and RT took ical and isotopic snow variability in East Antarctica along
care of the IC sample decontamination and/or ion chromatographic the 2001/02 ITASE traverse, Ann. Glaciol., 39, 473–482,
analysis and performed the annual layer counting. FB, IK and AS https://doi.org/10.3189/172756404781814636, 2004.
analyzed the trace elements content. GD, BS and ES measured wa- Becagli, S., Scarchilli, C., Traversi, R., Dayan, U., Severi,
ter stable isotopes. VC, MF, CS, BMN and MP took care of the ac- M., Frosini, D., Vitale, V., Mazzola, M., Lupi, A., Nava,
cumulation rate analysis. RN, LC, SB, MS and RT wrote the paper S., and Udisti, R.: Study of present-day sources and trans-
with inputs from all authors. port processes affecting oxidised sulphur compounds in at-
mospheric aerosols at Dome C (Antarctica) from year-
round sampling campaigns, Atmos. Environ., 52, 98–108,
Competing interests. Some authors are members of the editorial https://doi.org/10.1016/j.atmosenv.2011.07.053, 2012.
board of Climate of the Past. The peer-review process was guided by Benassai, S., Becagli, S., Gragnani, R., Magand, O., Propos-
an independent editor, and the authors also have no other competing ito, M., Fattori, I., Traversi, R., and Udisti, R.: Sea-
interests to declare. spray deposition in Antarctic coastal and plateau ar-
eas from ITASE traverses, Ann. Glaciol., 41, 32–40,
https://doi.org/10.3189/172756405781813285, 2005.
Disclaimer. Publisher’s note: Copernicus Publications remains Berhanu, T. A., Meusinger, C., Erbland, J., Jost. R., Bhattacharya,
neutral with regard to jurisdictional claims in published maps and S. K., Johnson, M. S., and Savarino, J.: Laboratory study
institutional affiliations. of nitrate photolysis in Antarctic snow. II. Isotopic effects
and wavelength dependence, J. Chem. Phys., 140, 244306,
https://doi.org/10.1063/1.4882899, 2014.
Bertler, N. A. N., Mayewski, P. A., and Carter, L.: Cold conditions
Acknowledgements. The fellowship personnel involved in the
in Antarctica during the Little Ice Age – Implications for abrupt
analysis of the GV7(B) core and the laboratory equipment were par-
climate change mechanisms, Earth Planet. Sci. Lett., 308, 41–51,
tially funded by Fondazione Cassa di Risparmio di Firenze, MIUR-
https://doi.org/10.1016/j.epsl.2011.05.021, 2011.
PNRA IPICS-2kyr-Italia (PNRA 2009/A2.09) MIUR-PNRA “BE-
Bodhaine, B. A., Deluisi, J. J., Harris, J. M., Houmere,
OI” (PNRA16 00124) and “3D” (PNRA16 00212) projects and
P., and Bauman, S.: Aerosol measurements at the South
MIUR-PRIN 2017 “AMICO”.
Pole, Tellus B, 38B, 223–235, https://doi.org/10.1111/j.1600-
0889.1986.tb00189.x, 1986.
Bowen, H. J. M.: Environmental chemistry of the elements, Aca-
Financial support. This research has been supported by the demic Press, London, ISBN: 780121204501, 1979.
MIUR (Italian Ministry of University and Research) – PNRA Caiazzo, L., Becagli, S., Frosini, D., Giardi, F., Severi, M.,
(Italian Antarctic Research Programme) through the IPICS-2kyr-It Traversi, R., and Udisti, R.: Spatial and temporal variability
project (International Partnership for Ice Core Science, reconstruct- of snow chemical composition and accumulation rate at Talos
ing the climate variability for the last 2 kyr, the Italian contribution). Dome site (East Antarctica), Sci. Total Environ., 550, 418–430,
The IPICS-2kyr-It project is carried out in cooperation with KOPRI https://doi.org/10.1016/j.scitotenv.2016.01.087, 2016.
(Korea Polar Research Institute, grant no. PE21100). Caiazzo, L., Baccolo, G., Barbante, C., Becagli, S., Bertò, M.,
Ciardini, V., Crotti, I., Delmonte, B., Dreossi, G., Frezzotti,
M., Gabrieli, J., Giardi, F., Han, Y., Hong, S. B., Hur, S. D.,
Review statement. This paper was edited by Elizabeth Thomas Hwang, H., Kang, J. H., Narcisi, B., Proposito, M., Scarchilli,
and reviewed by Anders Svensson and Daniel Emanuelsson. C., Selmo, E., Severi, M., Spolaor, A., Stenni, B., Traversi,
R., and Udisti, R.: Prominent features in isotopic, chemi-
cal and dust stratigraphies from coastal East Antarctic ice
sheet (Eastern Wilkes Land), Chemosphere, 176, 273–287,
https://doi.org/10.1016/j.chemosphere.2017.02.115, 2017.
https://doi.org/10.5194/cp-17-2073-2021 Clim. Past, 17, 2073–2089, 20212086 R. Nardin et al.: Dating of the GV7 East Antarctic ice core
Candelone, J.-P., Hong, S., and Boutron, C. F.: An improved method mos. Chem. Phys., 13, 6403–6419, https://doi.org/10.5194/acp-
for decontaminating polar snow or ice cores for heavy metal anal- 13-6403-2013, 2013.
ysis, Anal. Chimica Acta, 299, 9–16, 1994. Extier, T., Landais, A., Bréant, C., Prié, F., Bazin, L., Drey-
Candelone, J.-P., Bolshov, M. A., Rudniev, S. N., Hong, S., and fus, G., Roche, D. M., and Leuenberger, M.: On the use of
Boutron, C. F.: Bismuth in recent snow from Central Green- δ18Oatm for ice core dating, Quaternary Sci. Rev., 185, 244–
land: Preliminary results, Atmos. Environ., 29, 1843–1848, 257, https://doi.org/10.1016/j.quascirev.2018.02.008, 2018.
https://doi.org/10.1016/1352-2310(95)00058-7, 1995. Fischer, H., Fundel, F., Ruth, U., Twarloh, B., Wegner, A., Ud-
Castellano, E., Becagli, S., Jouzel, J., Migliori, A., Severi, isti, R., Becagli, S., Castellano, E., Morganti, A., Severi, M.,
M., Steffensen, J. P., Traversi, R., and Udisti, R.: Vol- Wolff, E., Littot, G., Röthlisberger, R., Mulvaney, R., Hutterli,
canic eruption frequency over the last 45 ky as recorded in M. A., Kaufmann, P., Federer, U., Lambert, F., Bigler, M., Hans-
Epica-Dome C ice core (East Antarctica) and its relationship son, M., Jonsell, U., de Angelis, M., Boutron, C., Siggaard-
with climatic changes, Global Planet. Change, 42, 195–205, Andersen, M. L., Steffensen, J. P., Barbante, C., Gaspari, V.,
https://doi.org/10.1016/j.gloplacha.2003.11.007, 2004. Gabrielli, P., and Wagenbach, D.: Reconstruction of millennial
Castellano, E., Becagli, S., Hansson, M., Hutterli, M., Petit, J. R., changes in dust emission, transport and regional sea ice cover-
Rampino, M. R., Severi, M., Steffensen, J. P., Traversi, R., and age using the deep EPICA ice cores from the Atlantic and Indian
Udisti, R.: Holocene volcanic history as recorded in the sulfate Ocean sector of Antarctica, Earth Planet. Sc. Lett., 260, 340–354,
stratigraphy of the European Project for Ice Coring in Antarctica https://doi.org/10.1016/j.epsl.2007.06.014, 2007.
Dome C (EDC96) ice core, J. Geophys. Res.-Atmos., 110, 1–12, Fretwell, P., Pritchard, H. D., Vaughan, D. G., Bamber, J. L., Bar-
https://doi.org/10.1029/2004JD005259, 2005. rand, N. E., Bell, R., Bianchi, C., Bingham, R. G., Blanken-
Chisholm, W., Rosman, K. J. R., Boutron, C. F., Candelone, J. P., ship, D. D., Casassa, G., Catania, G., Callens, D., Conway, H.,
and Hong, S.: Determination of lead isotopic ratios in Greenland Cook, A. J., Corr, H. F. J., Damaske, D., Damm, V., Ferracci-
and Antarctic snow and ice at picogram per gram concentrations, oli, F., Forsberg, R., Fujita, S., Gim, Y., Gogineni, P., Griggs,
Anal. Chim. Acta, 311, 141–151, https://doi.org/10.1016/0003- J. A., Hindmarsh, R. C. A., Holmlund, P., Holt, J. W., Jacobel,
2670(95)00181-X, 1995. R. W., Jenkins, A., Jokat, W., Jordan, T., King, E. C., Kohler,
Cole-Dai, J., Mosley-Thompson, E., and Thompson, L. G.: An- J., Krabill, W., Riger-Kusk, M., Langley, K. A., Leitchenkov,
nually resolved southern hemisphere volcanic history from two G., Leuschen, C., Luyendyk, B. P., Matsuoka, K., Mouginot,
Antarctic ice cores, J. Geophys. Res.-Atmos., 102, 16761– J., Nitsche, F. O., Nogi, Y., Nost, O. A., Popov, S. V., Rignot,
16771, https://doi.org/10.1029/97jd01394, 1997. E., Rippin, D. M., Rivera, A., Roberts, J., Ross, N., Siegert,
Dansgaard, W.: Stable isotopes in precipitation, Tellus, 16, 436– M. J., Smith, A. M., Steinhage, D., Studinger, M., Sun, B.,
468, https://doi.org/10.1111/j.2153-3490.1964.tb00181.x, 1964. Tinto, B. K., Welch, B. C., Wilson, D., Young, D. A., Xiangbin,
Dansgaard, W. and Johnsen, S.: A flow model and a time scale for C., and Zirizzotti, A.: Bedmap2: improved ice bed, surface and
the ice core from Camp Century, Greenland, J. Glaciol., 8, 215– thickness datasets for Antarctica, The Cryosphere, 7, 375–393,
223, 1969. https://doi.org/10.5194/tc-7-375-2013, 2013.
DeConto, R. M. and Pollard, D.: Contribution of Antarctica Frezzotti, M., Urbini, S., Proposito, M., Scarchilli, C., and Gan-
to past and future sea-level rise, Nature, 531, 591–597, dolfi, S.: Spatial and temporal variability of surface mass balance
https://doi.org/10.1038/nature17145, 2016. near Talos Dome, East Antarctica, J. Geophys. Res.-Earth, 112,
de Leeuw, G., Andreas, E. L., Anguelova, M. D., Fairall, C. W., F02032, https://doi.org/10.1029/2006JF000638, 2007.
Lewis, E. R., O’Dowd, C., Schulz, M., and Schwartz, S. E.: Frezzotti, M., Scarchilli, C., Becagli, S., Proposito, M., and
Production flux of sea salt aerosol, Rev. Geophys., 49, Rg2001, Urbini, S.: A synthesis of the Antarctic surface mass bal-
https://doi.org/10.1029/2010RG000349, 2011. ance during the last 800 yr, The Cryosphere, 7, 303–319,
Delmas, R. J., Legrand, M., Aristarain, A. J., and Zanolini, F.: Vol- https://doi.org/10.5194/tc-7-303-2013, 2013.
canic deposits in Antarctic snow and ice., J. Geophys. Res., 90, Gondwe, M., Krol, M., Gieskes, W., Klaassen, W., and de Baar,
12901–12920, https://doi.org/10.1029/JD090iD07p12901, 1985. H.: The contribution of ocean-leaving DMS to the global atmo-
Delmonte, B., Petit, J., and Maggi, V.: Glacial to Holocene im- spheric burdens of DMS, MSA, SO2 , and NSS SO= 4 , Global Bio-
plications of the new 27000-year dust record from the EPICA geochem. Cy., 17, 1056, https://doi.org/10.1029/2002gb001937,
Dome C (East Antarctica) ice core, Clim. Dynam., 18, 647–660, 2003.
https://doi.org/10.1007/s00382-001-0193-9, 2002. Grannas, A. M., Jones, A. E., Dibb, J., Ammann, M., Anastasio, C.,
Dibb, J. E., Talbot, R. W., Munger, J. W., Jacob, D. J., and Beine, H. J., Bergin, M., Bottenheim, J., Boxe, C. S., Carver, G.,
Fan, S. M.: Air-snow exchange of HNO3 and NOy at Sum- Chen, G., Crawford, J. H., Dominé, F., Frey, M. M., Guzmán,
mit, Greenland, J. Geophys. Res.-Atmos., 103, 3475–3486, M. I., Heard, D. E., Helmig, D., Hoffmann, M. R., Honrath, R.
https://doi.org/10.1029/97JD03132, 1998. E., Huey, L. G., Hutterli, M., Jacobi, H. W., Klán, P., Lefer, B.,
Epstein, S. and Mayeda, T.: Variation of O18 content of waters McConnell, J., Plane, J., Sander, R., Savarino, J., Shepson, P. B.,
from natural sources, Geochim. Cosmochim. Acta, 4, 213–224, Simpson, W. R., Sodeau, J. R., von Glasow, R., Weller, R., Wolff,
https://doi.org/10.1016/0016-7037(53)90051-9, 1953. E. W., and Zhu, T.: An overview of snow photochemistry: evi-
Erbland, J., Vicars, W. C., Savarino, J., Morin, S., Frey, M. M., dence, mechanisms and impacts, Atmos. Chem. Phys., 7, 4329–
Frosini, D., Vince, E., and Martins, J. M. F.: Air–snow transfer of 4373, https://doi.org/10.5194/acp-7-4329-2007, 2007.
nitrate on the East Antarctic Plateau – Part 1: Isotopic evidence Greene, C. A., Gwyther, D. E., and Blankenship, D. D.: Antarc-
for a photolytically driven dynamic equilibrium in summer, At- tic Mapping Tools for Matlab, Comput. Geosci., 104, 151–157,
2017.
Clim. Past, 17, 2073–2089, 2021 https://doi.org/10.5194/cp-17-2073-2021You can also read