The triple oxygen isotope composition of phytoliths, a new proxy of atmospheric relative humidity: controls of soil water isotope composition ...
←
→
Page content transcription
If your browser does not render page correctly, please read the page content below
Clim. Past, 17, 1881–1902, 2021
https://doi.org/10.5194/cp-17-1881-2021
© Author(s) 2021. This work is distributed under
the Creative Commons Attribution 4.0 License.

The triple oxygen isotope composition of phytoliths, a new
proxy of atmospheric relative humidity: controls of soil
water isotope composition, temperature, CO2
concentration and relative humidity
Clément Outrequin1 , Anne Alexandre1 , Christine Vallet-Coulomb1 , Clément Piel2 , Sébastien Devidal2 ,
Amaelle Landais3 , Martine Couapel1 , Jean-Charles Mazur1 , Christophe Peugeot4 , Monique Pierre3 , Frédéric Prié3 ,
Jacques Roy2 , Corinne Sonzogni1 , and Claudia Voigt1
1 CNRS,  Aix Marseille Univ, IRD, INRA, CEREGE, Aix-en-Provence, France
2 Ecotron Européen de Montpellier, Univ. Montpellier, UPS 3248 CNRS, Campus Baillarguet, Montferrier-sur-Lez, France
3 Laboratoire des Sciences du Climat et de l’Environnement (LSCE/IPSL/CEA/CNRS/UVSQ), Gif-sur-Yvette, France
4 Hydrosciences Montpellier, IRD, CNRS, Univ. Montpellier, Montpellier, France

Correspondence: Anne Alexandre (alexandre@cerege.fr)

Received: 29 March 2021 – Discussion started: 21 April 2021
Revised: 1 July 2021 – Accepted: 5 August 2021 – Published: 23 September 2021

Abstract. Continental atmospheric relative humidity is a          composition of leaf water, phytolith-forming water and phy-
major climate parameter whose variability is poorly under-        toliths evolves. However, since the 17 O excess varies little
stood by global climate models. Models’ improvement re-           in the growth chamber and natural source waters, this has no
lies on model–data comparisons for past periods. However,         impact on the strong relative humidity dependency of the 17 O
there are no truly quantitative indicators of relative humidity   excess of phytoliths, demonstrated for the 40 %–80% relative
for the pre-instrumental period. Previous studies highlighted     humidity range. This relative humidity dependency is not im-
a quantitative relationship between the triple oxygen isotope     pacted by changes in air temperature or CO2 concentration
composition of phytoliths, particularly the 17 O excess of phy-   either. A relative humidity proxy equation is proposed. Each
toliths, and atmospheric relative humidity. Here, as part of a    per meg of change in phytolith 17 O excess reflects a change
series of calibrations, we examine the respective controls of     in atmospheric relative humidity of ca. 0.2 %. The ±15 per
soil water isotope composition, temperature, CO2 concentra-       meg reproducibility on the measurement of phytolith 17 O ex-
tion and relative humidity on phytolith 17 O excess. For that     cess corresponds to a ±3.6 % precision on the reconstructed
purpose, the grass species Festuca arundinacea was grown          relative humidity. The low sensitivity of phytolith 17 O excess
in growth chambers where these parameters were varying.           to climate parameters other than relative humidity makes it
The setup was designed to control the evolution of the triple     particularly suitable for quantitative reconstructions of con-
oxygen isotope composition of phytoliths and all the water        tinental relative humidity changes in the past.
compartments of the soil–plant–atmosphere continuum. Dif-
ferent analytical techniques (cavity ring-down spectroscopy
and isotope ratio mass spectrometry) were used to analyze         1   Introduction
water and silica. An inter-laboratory comparison allowed to
strengthen the isotope data matching. Water and phytolith         The oxygen isotope composition of leaf water is an effective
isotope compositions were compared to previous datasets ob-       tool to trace processes at the soil–plant–atmosphere interface.
tained from growth chamber and natural tropical sites. The        It imprints the oxygen isotope composition of atmospheric
results show that the δ 018 O value of the source water gov-      CO2 (Hofmann et al., 2017; Koren et al., 2019) and O2 (Blu-
erns the starting point from which the triple oxygen isotope      nier et al., 2002; Brandon et al., 2020; Luz et al., 1999)

Published by Copernicus Publications on behalf of the European Geosciences Union.
1882                                                                    C. Outrequin et al.: 17 O excess of phytoliths, RH proxy

used to reconstruct changes in gross primary production.             Uemura, 2019; Surma et al., 2021), continental vapor recy-
The leaf water also controls the oxygen isotope composition          cling and rain droplet evaporation (Landais et al., 2010; Li et
of organic and mineral compounds formed during the plant             al., 2015; Tian et al., 2019; Surma et al., 2021). The very few
growth (Alexandre et al., 2012; Webb and Longstaffe, 2003,           studies providing information on the variability of 17 O excess
2006). This is the case for phytoliths that are micrometric hy-      in continental atmospheric vapor at low and middle latitudes
drous amorphous silica particles polymerized in abundance            (Lin et al., 2013; Surma et al., 2021; Ranjan et al., 2021)
in plant tissues. Preserved in soils and sediments, phytoliths       show that for a given location, it is in the same order of mag-
can be used for paleovegetation and paleoclimate reconstruc-         nitude as that of rainwater, reflecting continental moisture re-
tions.                                                               cycling in addition to the evaporation conditions in the source
   The main parameters influencing the isotope composition           region. Finally, for a given location, changes in the 17 O ex-
of bulk leaf water have been determined and modeled by nu-           cess of bulk leaf water should be primarily driven by local
merous studies (Farquhar et al., 2007, and references therein;       changes in the amplitude of the kinetic fractionation due to
Cernusak et al., 2016). With regard to grasses, this composi-        leaf water evaporation.
tion can be estimated assuming a mixture between a pool of              Recent calibration studies in growth chambers (Alexandre
unevaporated water that circulate longitudinally in the veins        et al., 2018, 2019) and at a tropical site (Li et al., 2017) con-
and a pool of water that has been subject to evaporation in          firmed this assumption and highlighted a change of 2 to 4 per
the intercellular space of the leaf stomata (Hirl et al., 2019;      meg in the 17 O excess of bulk leaf water for each percent-
Leaney et al., 1985; Farquhar and Lloyd, 1993; Farquhar and          age of RH. One of the growth chamber studies showed that
Gan, 2003). The volume ratio of unevaporated vs. evaporated          this translates to a change of 3 to 5 per meg in phytolith 17 O
water in grass leaves, considered in the mixing equation, can        excess for each percentage of RH (Alexandre et al., 2018)
be set at 0.2 (Alexandre et al., 2019; Hirl et al., 2019) and        and highlighted the potential of the 17 O excess of fossil phy-
is independent of the transpiration rate. The 18 O enrichment        toliths to record past changes in continental atmospheric RH.
of the leaf water at evaporative sites can be estimated from         Atmospheric RH is a major climate parameter. In combina-
the Craig and Gordon (1965) equation adapted to plant water          tion with Tatm , it is used to estimate the concentration of the
(Eq. 4 from Cernusak et al., 2016, equivalent to Eq. 23 from         atmospheric water vapor, a major component of the water
Farquhar and Lloyd, 1993). The main variables of this equa-          cycle and the main natural greenhouse gas (Held and So-
tion are the isotope composition of the source water absorbed        den, 2000; Dessler and Davis, 2010; Chung et al., 2014).
by the roots, equilibrium and kinetic fractionation factors be-      However, global climate models estimate RH from thermo-
tween liquid water and water vapor, the isotope composition          dynamic coupling between atmospheric water vapor and sea
of atmospheric water vapor and the ratio of water vapor mole         surface temperature (Bony et al., 2006; Stevens et al., 2017)
fractions in the atmosphere and at the leaf evaporation sites        and its actual variability is poorly accounted for. Model–data
(wa /wi ). This ratio is equal to the relative humidity (RH)         comparisons for the pre-instrumental period are necessary
when atmospheric and leaf temperatures (respectively Tatm            for models’ improvement but face the lack of truly quanti-
and Tleaf ) are identical. Combining the Craig–Gordon equa-          tative proxies of past RH. A promising proxy is the δD of
tion with the mixing equation correctly depicts the trend of         plant biomarkers (Garcin et al., 2012; Sachse et al., 2012;
bulk leaf water 18 O enrichment when RH decreases (Alexan-           Rach et al., 2017; Schwab et al., 2015; Tuthorn et al., 2015)
dre et al., 2018; Gan et al., 2003; Hirl et al., 2019). However,     recovered from buried soils and sediments. However, in ad-
the estimated 18 O enrichment values are often different from        dition to RH, the δD of plant biomarkers is dependent on
those observed by several ‰. This discrepancy indicates that         other variables such as the δD in rainwater, the plant func-
our understanding of the parameters controlling changes in           tional type and selective degradation of the biomarkers. The
the18 O enrichment of leaf water is still incomplete.                17 O excess of gypsum hydration that records the amplitude

   The triple oxygen isotope composition of bulk leaf water,         of surface water evaporation is also a promising new proxy
particularly its signature in 17 O excess (as defined in Sect. 2),   of RH (Evans et al., 2018; Gázquez et al., 2018; Herwartz
is influenced by fewer processes than δ 18 O alone (Aron et          et al., 2017) but is limited to conditions favorable to gyp-
al., 2020; Luz and Barkan, 2010; Sharp et al., 2018). Indeed,        sum formation. The 17 O excess of phytoliths may hold the
the 17 O excess of rainwater that feeds the soil water absorbed      potential to complement the toolbox of proxies for RH re-
by the roots is less sensitive to temperature (Barkan and Luz,       constructions. However, it is necessary to assess whether and
2005; Uemura et al., 2010) or phase changes that occur dur-          in which magnitude it can be impacted by environmental and
ing the air masses trajectories (Angert et al., 2003; Barkan         climate parameters other than RH that changed over Quater-
and Luz, 2007; Landais et al., 2008; Uemura et al., 2010).           nary glacial–interglacial cycles (Govin et al., 2014; IPCC,
As a result, the 17 O excess of rainwater varies spatially much      2007). This applies to Tatm that drives the difference be-
less than its δ 18 O (from −30 to 60 per meg when δ 18 O varies      tween Tatm and Tleaf and hence the equilibrium fractionation
between −25 ‰ and −5 ‰; Aron et al., 2020). The vari-                between liquid water and water vapor, and the atmospheric
ability range at a given location appears controlled by evap-        concentration of CO2 (CO2 ) that drives the stomatal conduc-
orative conditions at changing oceanic sources (Uechi and            tance and hence the kinetic fractionation in leaf water during

Clim. Past, 17, 1881–1902, 2021                                                         https://doi.org/10.5194/cp-17-1881-2021
C. Outrequin et al.: 17 O excess of phytoliths, RH proxy                                                                                 1883

transpiration. The impact of changes in the triple oxygen iso-
tope composition of soil water and atmospheric water vapor
on the triple oxygen isotope compositions of leaf water and
phytoliths also needs to be examined.
   To address these issues, we present the results of a new
growth chamber experiment in which the grass species Fes-
tuca arundinacea (F. arundinacea) was grown under vari-
able conditions of RH, Tatm and CO2 , mimicking past and
present climate conditions in tropical areas. The setup was
designed to monitor the evolution of the triple oxygen iso-
tope composition of all the water compartments in the soil–
plant–atmosphere continuum, particularly that of the atmo-
spheric vapor. Phytolith isotope compositions were analyzed.
The isotope data are compared to a previous growth chamber
experiment and two datasets obtained from phytolith samples
collected along a RH transect in western Africa (Alexandre et
al., 2018) and a new isotope monitoring at the soil–plant in-       Figure 1. Representation of the three fractionating processes that
terface carried out at the African Monsoon Multidisciplinary        interplay in the leaf boundary layer during evaporation, as conceptu-
Analysis – Coupling the Tropical Atmosphere and the Hy-             alized by the Craig and Gordon model: (a) from 1 to 2: equilibrium
drological Cycle (AMMA-CATCH) natural observatory in                fractionation between initial water (unevaporated) and atmospheric
Benin (western Africa) (this study).                                vapor; (b) from 2 to 3a or 3b: fractionation due to vapor diffusion in
                                                                    humid (3a) or dry air (3b); (c) from 3a to 4a and 3b to 4b: fraction-
                                                                    ation due to exchange between evaporated water and atmospheric
2     Fractionation and notation in the triple oxygen
                                                                    water vapor at high (3a to 4a) and low (3b to 4b) relative humid-
      isotope system
                                                                    ity. Red arrows: magnitude of the resulting 17 O excess describing
                                                                    the departure of d017 O from a reference line with a slope λ of 0.528,
In the triple oxygen isotope system, the mass-dependent frac-       equivalent to the slope of the Global Meteoric Water Line (GMWL).
tionation factors between two phases, A and B (17 αA−B and          θequil : slope of the equilibrium line; θdiff : slope of the diffusion line.
18 α
    A−B ), are related by the exponent θA−B which is ex-
pressed as
17                                                                  be depicted in the δ 017 O vs. δ 018 O space as follows (Fig. 1):
     αA−B = (18 αA−B )θ                                      (1)    (a) water–vapor equilibrium fractionation, which is tempera-
                                                                    ture dependent (Majoube, 1971), drives the isotope compo-
or
                                                                    sition of leaf water along a line of a slope θequil ; (b) vapor
θA−B = ln17 αA−B /ln17 αA−B .                                (2)    diffusion in air, which is dependent on RH (or more specifi-
                                                                    cally on wa /wi ), drives the isotope composition of leaf water
The value of θ is equal to 0.529 for liquid water–water va-         along a line of a slope θdiff ; (c) exchange between leaf water
por equilibrium (θequil ; Barkan and Luz, 2005) and 0.518 for       and atmospheric water vapor, which decreases from turbu-
water vapor diffusion in air (θdiff ; Barkan and Luz, 2007).        lent to laminar and molecular vapor transport, and from high
While θ applies to a particular well-constrained physical           to low atmospheric water vapor concentration, drives the iso-
process, the term λ is used when several fractionation pro-         tope composition of leaf water along a mixing curve linking
cesses occur at the same time. In the δ 018 O vs. δ 017 O space,    the evaporated water and the atmospheric water vapor com-
λ represents the slope of the line linking δ 017 OA − δ 017 OB to   positions. The combination of these processes leads to the
                                                                    17 O excess of evaporated leaf water, describing the departure
δ 018 OA − δ 018 OB with
                                                                    of δ 017 O from a reference line with a slope λ of 0.528, equiva-
λA−B = (δ 017 OA − δ 017 OB )/(δ 018 OA − δ 018 OB )         (3)    lent to the slope of the Global Meteoric Water Line (GMWL,
                                                                    expressed as δ 017 O = 0.528×δ 018 O+0.033, Luz and Barkan,
and                                                                 2010). Thus, 17 O excess is expressed as

δ 0∗ O = ln(δ ∗ O + 1),                                      (4)    17
                                                                         Oexcess = δ 017 O − 0.528 × δ 018 O.                               (5)

where δ ∗ O = (∗ O/16 O)sample /(∗ O/16 O)standard − 1). ∗ stands   The difference of 17 O excess between A and B is expressed
for 18 or 17.                                                       hereafter by 17 O excessA−B . Since the value of 0.528 is close
   When water evaporates, three processes interplay in the          to the θequil value (0.529), measuring the 17 O excess of water
leaf boundary layer, as conceptualized by the Craig and Gor-        is very suitable for quantifying kinetic fractionation due to
don model (Craig and Gordon, 1965). These processes can             evaporation.

https://doi.org/10.5194/cp-17-1881-2021                                                             Clim. Past, 17, 1881–1902, 2021
1884 C. Outrequin et al.: 17 O excess of phytoliths, RH proxy
For the silica–water couple at equilibrium, the evolution For each chamber, the water vapor in the air was mea-
of the exponent λ (λsilica−water ) with temperature has been sured every second over a 420 min period before switching to
synthesized from data and can be calculated from Eq. (10) the next chamber using a 16-port distribution manifold (Pi-
in Sharp et al. (2016). For the 5–35 ◦ C temperature range, carro A0311). After discarding the first 20 min to account for
λsilica−water equals 0.524±0.0002, in agreement with the the- potential memory effects, the raw data were averaged over
oretical θsilica−water values (Cao and Liu, 2011). 80 min, resulting in five averages per vapor measurement pe-
riod. Prior to each 420 min vapor measurement period, three
working standards of liquid water were analyzed for cali-
3 Materials and methods
bration. This high calibration frequency allows to counter-
3.1 Growth chamber experimental setup
act a potential drift of the instrument. In order to estimate
the background noise, the atmospheric water vapor fogged
F. arundinacea, commonly referred to as tall fescue, is a (without fractionation) from a constant water source into the
globally distributed invasive grass species, widely used as three empty chambers was measured for each climate combi-
forage (Gibson and Newman, 2001), and can adapt to a wide nation (except for the growth at 300 ppm CO2 ) and two types
range of climatic conditions. Three growth chambers with of humidifiers. The precision on the means of the 80 min va-
a regulation of light intensity, Tair , RH and CO2 were used por measurements was 0.04 ‰ for δ 18 O and lower than 10
to cultivate the tall fescue in three soil containers at the per meg for 17 O excess (means of SD, n = 19).
Microcosms platform of the Montpellier European Ecotron The liquid water standard measurements necessary for the
(France). The growth chambers as well as the growth pro- calibration of the water vapor measurements consisted of 10
tocol, described in detail in Appendix A, were adapted to injections per vial with the first six being discarded to ac-
allow for the monitoring of the isotope composition of all count for memory effects. The dry air stream used for the
the water compartments in the soil–plant–atmosphere con- liquid measurements was devoid of CO2 , contained less than
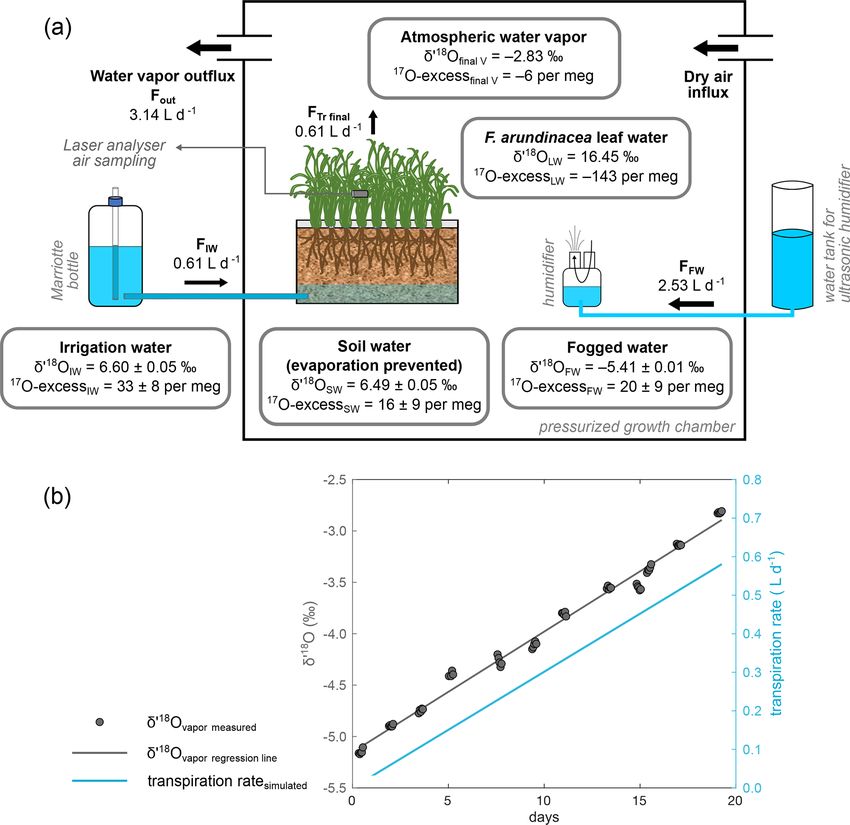
tinuum (Fig. 2). The differences between the isotope com- 400 ppm of water vapor. The same dry air was used for
position of the water used for soil irrigation (6.55 ‰ and flushing the growth chambers to limit measurement bias due
29 per meg for δ 018 O and 17 O excess, respectively) and that to differences in the chemical composition of the analyzed
of the water fogged into the chamber atmosphere (−5.64 ‰ growth chamber atmosphere and the dry gas used for cali-
and 17 per meg for δ 018 O and 17 O excess, respectively) were bration (Aemisegger et al., 2012; Brady and Hodell, 2021).
set close to the water liquid–vapor equilibrium fractionation The volumes of water standards vaporized to the spectrom-
value characteristic of natural systems (e.g., 1018 O ranging eter were adjusted to reach water vapor mixing ratios sim-
from 9.65 ‰ to 9.06 ‰ between 20 and 28◦ C; Majoube, ilar to those of the growth chamber atmospheres (i.e., be-
1971). tween 12 000 and 30 000 ppm which corresponds to tem-
Three treatments which consisted in seven combinations perature / RH conditions of 24 ◦ C / 40 % and 28 ◦ C / 80 %).
of RH (40 %, 60 % and 80 %), Tair (20, 24 and 28 ◦ C) and Thus, no correction for a mixing ratio dependency (e.g.,
CO2 (200, 300 and 400 ppm) were applied to 18 fescue re- Weng et al., 2020) was applied. The mean precision on the
growth (two to three replicates per climate combination), as liquid water measurements for this mixing ratio range was
described in Table 1. At the end of each regrowth (lasting 0.02 ‰ and 12 per meg for δ 018 O and 17 O excess, respec-
between 11 and 26 d), the fescue canopy was harvested. On tively (means of SD, n = 21). The variation for this range of
32 ± 24 g of fresh weight of fescue leaves (average per re- mixing ratio was 0.04 ‰ and 7 per meg for δ 018 O and 17 O
growth), 4 g were immediately inserted into glass gastight excess, respectively (SD of the means, n = 21).
vials for leaf water extraction, while the remaining biomass The irrigation, soil and fogged water samples were ana-
was dried at 50 ◦ C and kept for phytolith extraction. The lyzed at CEREGE (Centre de Recherche et d’Enseignement
humid air of each of the three growth chambers was con- de Géosciences de l’Environnement, France) also using a Pi-
tinuously pumped via three heated lines and sent to a laser carro L2140-i laser spectrometer (same configuration as at
spectrometer for sequential analyses. The irrigation, soil and Ecotron). Each measurement run included three groups of
fogged waters were sampled before each regrowth for anal- three working standards for calibration, three replicates of
yses. The volume of irrigation water consumed by transpira- an additional working standard for quality assurance (QA)
tion was estimated (Table S1 in the Supplement). and three replicates per water sample, with eight injections
per vial. The two first injections were not considered. Each
3.2 Water vapor and liquid water triple oxygen isotope
measurement was corrected for a memory effect (Vallet-
analyses
Coulomb et al., 2021 for Rapid Communications in Mass
Spectrometry). The precision on the QA value measurement
The humid air of the chambers was analyzed at Ecotron by was 0.02 ‰ for δ 17 O and δ 18 O and 11 per meg for 17 O excess
wavelength-scanned cavity ring-down spectroscopy (CRDS) (1 SD; n = 7 measurement sessions). The averaged differ-
with a Picarro L2140-i spectrometer operated in 17 O excess ence from the reference composition of the QA was 0.02‰,
mode.
Clim. Past, 17, 1881–1902, 2021 https://doi.org/10.5194/cp-17-1881-2021Table 1. The growth chamber experiment: three RH, air temperature (Tair ) and CO2 concentration (CO2 ) treatments (seven climate combinations and two to three replicates per
combination), F. arundinacea regrowth duration, harvest fresh weight, productivity, phytolith concentration and percentage of long-cell (LC) phytolith types relative to long- and
short-cell phytolith types.
Treatments Sample1 Chamber Container RH Tatm Tleaf CO2 VPD Regrowth Harvest Productivity Phytolith LC2
duration fresh concentration
weight
no. no. % ◦C ◦C ppm kPa d g g d−1 % d.w. %
https://doi.org/10.5194/cp-17-1881-2021
Av. SD Av. SD
RH 40 P2-40-12.07.17 2 2 40.1 24.0 22.0 400 1.78 20 32.8 1.6 3.9
P3-40-12.07.17 3 3 40.2 24.0 22.0 400 1.77 20 21.1 1.1 3.2
P4-40-12.07.17 4 4 40.0 24.0 22.0 400 1.78 20 34.4 1.7 1.5 0.4 4.6 3.9 0.7 31
C. Outrequin et al.: 17 O excess of phytoliths, RH proxy
60 P2-60-12.06.17 2 2 59.5 24.0 22.0 400 1.20 14 15.1 1.1 4.7
P3-60-12.06.17 3 3 59.8 24.0 22.0 400 1.19 14 18.5 1.3 2.6 26
P4-60-12.06.17 4 4 59.5 24.0 22.0 400 1.20 14 14.2 1.0 1.1 0.2 5.9 4.4 1.7
80 P2-80-07.08.17 2 2 79.1 24.0 22.0 400 0.62 26 108.4 4.2 1.7
P3-80-07.08.17 3 3 79.0 24.0 22.0 400 0.62 26 75.0 2.9 3.5 0.9 1.1 1.4 0.4 16
Tair 20 P3-20-400-14.02.18 3 3 60.1 20.0 18.0 400 0.93 14 25.7 1.8 2.4
P4-20-400-14.02.18 4 4 60.1 20.0 18.0 399 0.93 14 38.4 2.7 2.3 0.6 0.8 1.6 1.1
28 P3-28-400-10.04.18 3 3 59.0 28.0 26.0 400 1.54 11 44.0 4.0 3.2
P4-28-400-10.04.18 4 4 59.3 28.0 26.0 400 1.53 11 20.2 1.8 1.6
P5-28-400-05.07.18 2 5 57.9 27.8 25.8 400 1.56 14 18.0 1.3 2.4 1.4 2.6 2.4 0.8
CO2 200 P3-24-200-16.03.18 3 3 60.1 24.0 22.0 200 1.18 14 15.7 1.1 2.4
concentration P4-24-200-16.03.18 4 4 59.1 24.0 22.0 201 1.21 14 37.0 2.6 1.9 1.1 1.9 2.2 0.4
300 P3-24-300-30.03.18 3 3 60.0 24.0 22.0 300 1.19 14 17.7 1.3 3.2
P4-24-300-30.03.18 4 4 58.9 24.0 22.0 300 1.22 14 31.5 2.3 2.5
P5-24-300-10.08.18 2 5 58.5 24.0 22.0 300 1.23 15 20.5 1.4 1.6 0.5 1.9 2.5 0.6
1 Sample name includes the sampling date (with DD.MM.YY). 2 Long-cell phytoliths/long- and short-cell phytoliths. Av.: average; SD: standard deviation.
Clim. Past, 17, 1881–1902, 2021
18851886 C. Outrequin et al.: 17 O excess of phytoliths, RH proxy Figure 2. Scheme of the growth chamber setup for the isotope monitoring of the water compartments in the soil–plant–atmosphere contin- uum. (a) Isotope data are given for the final state of the P2-40-12.07.17 regrowth as an example (data from Table S1). The fogged water influx (FfogW ) is adjusted to keep a constant relative humidity (RH). FfogW final value is equal to the difference between the vapor outflux (Fout ) and the irrigation water influx (FIW ), equivalent to the transpired water flux (FTr ). FfogW is adjusted to keep a constant RH. (b) Linear correlation with the number of growing days of the atmospheric vapor δ 018 O (δ 18 Ov ) in the growth chamber. δ 018 O values of the initial and final water vapor (δ 018 Oinitial V and δ 018 Ofinal V in Table S1) were extrapolated from this correlation. The transpiration rate can be calculated on a daily basis using δ 018 Ov and an isotope mass balance as detailed in Table S1. The differences in 17 O excess between irrigation water and soil water and between fogged water and atmospheric water vapor are due to methodological variability. When taking into account the totality of the climate combinations (Table S1), δ 018 O and 17 O excess averages obtained for soil water (6.28 ± 0.16 ‰ and 15 ± 10 per meg, respectively) and irrigation water (6.50 ± 0.06 ‰ and 24 ± 9 per meg, respectively) or 17 O excess averages obtained for fogged water (17 ± 6 per meg) and final atmospheric water vapor (9 ± 8 per meg) are not significantly different (Student’s t tests). 0.03‰ and 1 per meg, for δ 17 O, δ 18 O and 17 O excess, re- cedure previously detailed in Landais et al. (2006). The mea- spectively. surement precisions (2 runs of 24 dual-inlet measurements) Bulk water was extracted from the fescue leaves using a were 0.1 ‰ for δ 18 O and δ 17 O and 6 per meg for 17 O excess. fluorination line and analyzed with dual-inlet isotope-ratio All water isotope compositions were normalized on the Vi- mass spectrometry (IRMS) (ThermoQuest Finnigan MAT enna Standard Mean Ocean Water – Standard Light Antarc- 253 mass spectrometer) at LSCE (France), following the pro- tic Precipitation (VSMOW-SLAP) scale, with an assigned Clim. Past, 17, 1881–1902, 2021 https://doi.org/10.5194/cp-17-1881-2021
C. Outrequin et al.: 17 O excess of phytoliths, RH proxy                                                                     1887

SLAP 17 O excess value of zero, following the recommen-           allowed robust comparisons between silica and water isotope
dations of Schoenemann et al. (2013). A comparison be-            compositions.
tween CEREGE, Ecotron and LSCE water measurements of                 The reproducibility from δ 18 O and 17 O excess measure-
the same laboratory standards was performed. Results are          ments of the quartz laboratory standard was 0.13 ‰ and 12
presented in Table B1. Differences between the laboratories       per meg, respectively (1 SD, n = 21 aliquots). For the phy-
were lower than 0.2 ‰, 0.1 ‰ and 10 per meg for δ 18 O, δ 17 O    tolith samples, the averaged reproducibility from δ 18 O and
and 17 O excess, respectively.                                    17 O excess measurements was 0.34 ‰ and 9 per meg, re-

                                                                  spectively (1 SD, 2 to 3 aliquots). The reproducibility from
                                                                  phytolith 17 O excess measurements was always lower than
3.3   Phytolith extraction, counting and triple oxygen            15 per meg.
      isotope analyses                                               It was recently suggested that the dehydration step re-
                                                                  quired before analyzing biogenic hydrous silica may induce
Phytoliths were extracted from plants following a protocol        an isotope fractionation biasing the 17 O excess values (Her-
detailed in Corbineau et al. (2013). Chemical removal of car-     wartz, 2021). Arguments for the absence of significant iso-
bonate and organic compounds at 70 ◦ C resulted in high-          tope fractionation during the high-temperature dehydration
purity phytolith concentrates. Phytolith samples of 1.6 mg        under N2 flow step are presented in Appendix C.
were then dehydrated under a flow of N2 at 1100 ◦ C (Chapli-         Phytoliths obtained from three regrowths with different
gin et al., 2010) to prevent the formation of siloxane from       RH were mounted on microscope slides in Canada balsam
silanol groups during dehydroxylation. Molecular O2 was           for counting at a 600× magnification. The percentage of
extracted using the IR laser-heating fluorination technique       epidermal long-cell relative to short- and long-cell phytolith
at CEREGE (Alexandre et al., 2006; Crespin et al., 2008;          types was calculated (Alexandre et al., 2018). Two counts of
Suavet et al., 2010). At the end of the procedure, the gas was    the same assemblage gave a difference of 1 %.
passed through a −114 ◦ C slush to refreeze any molecule in-
terfering with the mass 33 (e.g., NF potentially remaining in     3.4   Independent growth chamber and natural datasets
the line). Analyses of quartz and phytolith working standards           used for comparison
with and without the slush showed that this step is essential
to get reproducible 17 O excess data. The gas was directly sent   To examine the effect of the soil water isotope composition
to the dual-inlet mass spectrometer (ThermoQuest Finnigan         on that of phytoliths, the results from the growth chamber
Delta V Plus). Each gas sample was run twice. Each run con-       experiment were compared with two datasets published in
sisted of eight dual-inlet cycles (integration time of 26 s). A   Alexandre et al. (2018): (1) the first dataset includes isotope
third run was performed when the standard deviation (SD)          compositions of leaf water and phytoliths of F. arundinacea
on the first two averages was higher than 15 per meg for 17 O     grown at Ecotron in growth chambers where RH was varied
excess.                                                           in a similar way to the current RH treatments and Tatm was
   The composition of the reference gas was determined            set constant at 25 ◦ C. In the setup of this growth chamber ex-
against NBS28. The sample measurements were corrected             periment, the isotope composition atmospheric water vapor
on a daily basis using a quartz laboratory standard analyzed      was not measured. The isotope composition of the irrigation
at the beginning of the day until a 17 O excess plateau was       water (−5.58 ‰ and 26 per meg for δ 018 O and 17 O excess, re-
reached and again in the middle and at the end of the day. As     spectively) was depleted relative to the recent growth cham-
recommended by Sharp and Wostbrock (2021), isotope com-           ber experiment but closer to natural waters. The fogged wa-
positions obtained from the analyses of NBS28 and six work-       ter had the same isotope composition as the irrigation water,
ing standards (including phytolith standards) at CEREGE           similar to the one used in this study; (2) the second dataset in-
were compared to those obtained from the same standards           cludes isotope compositions of phytoliths extracted from soil
measured at the University of New Mexico (UNM), where             tops collected along a vegetation and RH transect in western
the data are directly calibrated relative to VSMOW-SLAP.          Africa. The vegetation is represented by savannas and humid
The inter-laboratory comparison is presented in Table C1.         forests and soil phytoliths are from grasses and trees. Rain-
The averaged CEREGE-UNM 17 O excess offset is −25 per             fall δ 018 O weighted monthly means at the sampling locations
meg and does not evolve with δ 18 O. This offset is compa-        ranged from −1.5 ‰ to −4.5 ‰ (Online Isotopes in Precip-
rable to the ±24 per meg average offset to VSMOW-SLAP             itation Calculator – OIPC2-2; Bowen et al., 2005). Monthly
standardized data obtained by other laboratories (Herwartz,       mean RH extracted from the Climate Research Unit (CRU)
2021). Since this offset is larger than the data precision (15    1961–1990 time series ranged from 57 % to 82 % (Alexandre
per meg), the silica data obtained at CEREGE were corrected       et al., 2018).
by adding 20 per meg to the measured δ 17 O value (which             Additionally, a new dataset was obtained from an ongo-
is equivalent to adding 20 per meg to the δ 017 O or 17 O ex-     ing monitoring at the AMMA-CATCH natural observatory
cess values). The data previously presented in Alexandre et       (Galle et al., 2018) in Benin (western Africa) where dry for-
al. (2018, 2019) were corrected accordingly. This correction      est and savannas prevail under a tropical humid climate. The

https://doi.org/10.5194/cp-17-1881-2021                                                      Clim. Past, 17, 1881–1902, 2021
1888 C. Outrequin et al.: 17 O excess of phytoliths, RH proxy
mean annual rainfall is 1300 mm with 60 % occurring during 4.3 Leaf water isotope composition response to RH, Tair
the rainy season between July and September. The mean an- and CO2 changes
nual Tatm is 26 ◦ C. RH ranges from 10 % to 20 % during the
Evolutions of the triple oxygen isotope composition of leaf
dry season and from 50 % to 80 % during the rainy season.
water with variable RH, Tair , CO2 and the associated VPD
The observatory is equipped with a meteorological station,
(Table 2) are illustrated in Fig. 3. The 80 % to 40 % decrease
providing hourly records of Tatm and RH. The rainwater was
of RH, corresponding to a 1.2 kPa increase of VPD, leads to
collected continuously during the grass growing period and
a 5.9 ‰ increase in δ 018 O and a 108 per meg decrease in 17 O
its isotope composition was analyzed (Sect. 3.2). Two grass
excess, which is characteristic of an evaporation trend. There
species (Hyparrhenia involucrata and Andropogon gayanus)
is no impact of CO2 changes on the δ 018 O and 17 O excess of
were collected at the beginning and in the middle of the rainy
leaf water. The increase in Tatm from 20 to 28 ◦ C, which cor-
season in the dry forest and the savanna plots. Phytoliths
responds to a 0.6 kPa increase of VPD, comes with a 5.1 ‰
were extracted from the stems that are supposed to be non-
decrease of δ 018 O, which is opposite to an evaporative kinetic
transpiring organs and analyzed (Sect. 3.3).
fractionation trend. The 17 O excess does not change signif-
icantly with variable Tatm . The fractionation between irriga-
4 Results tion and leaf water values is presented in Table 2. There is no
significant trend in the triple oxygen isotope fractionation co-
4.1 Effectiveness of the growth chamber monitoring efficient λ between leaf water and irrigation water (λLW−IW )
For each growth, the water fluxes and the isotope com- with RH.
positions of the water compartments in the soil–plant–
atmosphere continuum are presented in Table S1 and il- 4.4 Leaf phytolith isotope composition response to RH,
lustrated in Fig. 2a. The volumes of transpired water esti- Tair and CO2 changes
mated by isotope mass balance are very close to the mea-
Changes in the triple oxygen isotope compositions of phy-
sured volumes (the slope of the correlation (not shown) is
toliths with RH, Tair , CO2 and the associated VPD values
1.0.; r 2 = 0.97), supporting the effectiveness of the monitor-
(Table S2) are illustrated in Fig. 3. Given the δ 018 O and 17 O
ing. During the growth, the vapor δ 018 O increases linearly
excess precision ranges, no changes are observed when Tatm
(Fig. 2b), in response to the increasing contribution of tran-
or CO2 vary. The evaporation trend noted for leaf water is
spired water to the atmosphere, unfractionated relative to the
also observed for phytoliths but at a higher rate: the δ 018 O of
irrigation water (Welp et al., 2008). Since the 17 O excess of
phytolith increases from 36.0 ± 0.2 ‰ to 48.6 ± 1.4 ‰ with
the irrigation water is close to that of fogged water, the tran-
RH decreasing from 80 % to 40 %. At the same time, the 17 O
spiration has little effect on the 17 O excess of the atmospheric
excess of phytoliths decreases from −177 ± 2 to −336 ± 22
vapor. The mean value of 17 O excess in atmospheric water
per meg.
vapor (Table S1) is statistically not different from that of the
The apparent fractionation between leaf water and phy-
fogged water (Student’s t test).
toliths (δ 018 OPhyto –δ 018 OLW ) is presented in Table 2. Between
80 and 60% RH, it is invariable (δ 018 OPhyto –δ 018 OLW equals
4.2 Biomass productivity, transpiration and phytolith to 25.27 ± 1.88 ‰ and 26.77 ± 0.35 ‰ at 80 % and 60 %
content RH, respectively) but lower than expected for equilibrium
Considering all the regrowths, the biomass productivity and fractionation between water and silica (δ 018 Osilica −δ 018 Ow =
phytolith content range from 1.1 ± 0.2 to 3.5 ± 0.9 g d−1 and 31 ‰ and 33 ‰ for 26 and 18 ◦ C, according to Dodd and
from 1.4 ± 0.4 % to 4.4 ± 1.7 % dry weight, respectively (Ta- Sharp, 2010). At 40% RH, δ 018 OPhyto − δ 018 OLW is similar
ble 1). The transpiration rate measured at the end of each to the equilibrium value. The value of δ 018 OPhyto − δ 018 OLW
regrowth ranges from 0.2 to 0.6 L d−1 (Table S1). For each does not change significantly from 28 to 24 ◦ C but decreases
of these variables, there is a high variability between repli- by 3.2 ‰ from 24 to 20 ◦ C. This decrease is opposed to the
cates which may explain the low correlation with the vapor increasing fractionation expected for equilibrium when tem-
pressure deficit (VPD). It is noteworthy that the averaged perature decreases. It is also opposed to the increase in the
phytolith content is negatively correlated with the biomass fractionation between irrigation and leaf waters (δ 018 OLW −
productivity (r 2 = 0.7) and the transpiration rate (r 2 = 0.4). δ 018 OIW ). This translates into invariable fractionation be-
In the phytolith assemblages, the percentage of the long-cell tween irrigation water and phytoliths (δ 018 OPhyto − δ 018 OIW ).
phytolith type ranges from 16 to 31 %, increasing with VPD Overall, the λ value calculated for the leaf water–phytolith
(r 2 = 0.9). couple (λPhyto−LW ) averages 0.522 ± 0.0005 (Table 2).
4.5 AMMA-CATCH stem phytolith isotope composition
The isotope compositions of the stem phytoliths extracted
from the two grass species collected at the AMMA-CATCH
Clim. Past, 17, 1881–1902, 2021 https://doi.org/10.5194/cp-17-1881-2021Table 2. Triple oxygen isotope fractionation observed between bulk leaf water and irrigation water and phytolith and bulk leaf water of F. arundinacea for the three RH, Tair and CO2
concentration (CO2 ) treatments.
Treatment Sample1 RH Tatm Tleaf CO2 VPD Apparent fractionation between irrigation (IW) Apparent fractionation between bulk leaf water
and leaf water (LW) (LW) and phytolith (Phyto)
Phyto−LW
https://doi.org/10.5194/cp-17-1881-2021
δ 018 OLW − δ 018 OIW
δ 017 OLW − δ 017 OIW
λLW−IW
δ 018 OPhyto − δ 018 OLW
δ 017 OPhyto − δ 017 OLW
17 O excess
λPhyto−LW
Av. SD Av. SD Av. SD Av. SD Av. SD
% ◦C ◦C ppm kPa ‰ ‰ ‰ ‰ ‰ ‰ ‰ ‰ ‰ ‰ per meg
RH 40 P2-40-12.07.17 40.1 24.0 22.0 400 1.78 9.84 5.02 0.510 33.60 17.53 −209 0.522
P3-40-12.07.17 40.2 24.0 22.0 400 1.77 9.53 4.86 0.510 32.23 16.85 −168 0.523
C. Outrequin et al.: 17 O excess of phytoliths, RH proxy
P4-40-12.07.17 40.0 24.0 22.0 400 1.78 10.58 9.99 0.54 5.42 0.512 0.511 0.001 30.25 32.03 1.68 15.77 16.72 0.89 −205 −194 22 0.521
60 P2-60-12.06.17 59.5 24.0 22.0 400 1.20 6.60 3.35 0.508 26.38 13.77 −163 0.522
P3-60-12.06.17 59.8 24.0 22.0 400 1.19 7.35 3.75 0.510 27.04 14.12 −152 0.522
P4-60-12.06.17 59.5 24.0 22.0 400 1.20 7.18 7.04 0.39 3.68 0.512 0.510 0.002 26.90 26.77 0.35 14.02 13.97 0.19 −179 −165 13 0.521
80 P2-80-07.08.17 79.1 24.0 22.0 400 0.62 2.71 1.37 0.506 26.60 13.90 −149 0.522
P3-80-07.08.17 79.0 24.0 22.0 400 0.62 5.68 4.19 2.10 2.93 0.516 0.511 0.007 23.94 25.27 1.88 12.50 13.20 0.99 −137 −143 8 0.522
Tair 20 P3-20-400-14.02.18 60.1 20.0 18.0 400 0.93 11.49 5.97 0.520 22.59 11.74 −188 0.520
P4-20-400-14.02.18 60.1 20.0 18.0 399 0.93 10.61 11.05 0.62 5.51 0.519 0.520 0.001 24.59 23.59 1.42 12.80 12.27 0.75 −181 −184 5 0.521
28 P3-28-400-10.04.18 59.0 28.0 26.0 400 1.54 6.16 3.14 0.510 26.28 13.71 −168 0.522
P4-28-400-10.04.18 59.3 28.0 26.0 400 1.53 6.69 3.43 0.513 26.62 13.89 −169 0.522
P5-28-400-05.07.18 57.9 27.8 25.8 400 1.56 5.10 5.99 0.81 2.55 0.500 0.508 0.007 27.08 26.66 0.40 14.16 13.92 0.23 −135 −158 19 0.523
CO2 200 P3-24-200-16.03.18 60.1 24.0 22.0 200 1.18 8.19 4.21 0.514 25.46 13.29 −148 0.522
P4-24-200-16.03.18 59.1 24.0 22.0 201 1.21 8.63 8.41 0.32 4.45 0.516 0.515 0.001 26.25 25.85 0.56 13.71 13.50 0.30 −150 −149 1 0.522
300 P3-24-300-30.03.18 60.0 24.0 22.0 300 1.19 6.46 3.30 0.511 26.47 13.82 −157 0.522
P4-24-300-30.03.18 58.9 24.0 22.0 300 1.22 10.03 5.18 0.517 24.13 12.60 −143 0.522
P5-24-300-10.08.18 58.5 24.0 22.0 300 1.23 7.80 8.10 1.80 3.99 0.512 0.513 0.003 26.35 25.65 1.32 13.76 13.39 0.69 −151 −150 7 0.522
2 60 % RH Av. 7.38 0.511 26.23 13.70 0.522
2 SD 1.10 0.003 0.56 0.29 0.0005
1 Sample name includes the sampling date (with DD.MM.YY). 2 Average and standard deviation calculated for all experiments conducted at 60 % RH. Av.: average; SD: standard deviation.
Clim. Past, 17, 1881–1902, 2021
18891890 C. Outrequin et al.: 17 O excess of phytoliths, RH proxy
Figure 3. Impact of VPD changes associated with RH, Tair and CO2 concentration (CO2 ) changes on δ 018 O and 17 O excess values of leaf
water and phytoliths. Error bars on the measurement replicates are smaller than the symbols.
observatory are presented in Table 3. The isotope com- treatment, the model does not predict any significant change
position of the stem phytolith-forming waters is assumed in δ 018 O and 17 O excess, in disagreement with the high δ 018 O
to be close to the amount-weighed isotope composition value observed at 20 ◦ C. Tair−leaf is difficult to measure or
of rainfall averaged for the growing season preceding the estimate, in growth chambers as well as outdoor, which cer-
grass sampling. The obtained fractionation values for the tainly accounts for the inaccuracy frequently encountered
rainwater–phytolith couple, i.e., δ 018 OPhyto − δ 018 ORW and when the δ 018 O of leaf water is modeled. However, in the
λPhyto−RW , are 31.18 ± 0.63 (1 SD) ‰ and 0.523 ± 0.0004, present case, different-than-expected Tair−leaf values would
respectively. They are almost identical to the equilibrium move the δ 018 O and 17 O excess of leaf water along the pre-
values of 30.78 ± 0.39 ‰ and 0.524 ± 0.0002 calculated for dicted line and cannot account for the offset in δ 018 O only
δ 018 Osilica − δ 018 Owater and λsilica−water after Dodd and Sharp observed at 20 ◦ C. For the current and 2018 RH treatments,
(2010) and Sharp et al. (2016), respectively. the trends described by the δ 018 O and 17 O excess of leaf wa-
ter when RH changes are correctly predicted, although some
5 Discussion δ 018 O and 17 O excess values are significantly lower than ex-
pected from the model. For example, for the current RH treat-
5.1 Parameters controlling the triple oxygen isotope ment, the δ 018 O at 40 % is 6 ‰ lower than predicted. For the
composition of leaf water 2018 RH treatment, the 17 O excess can be 50 per meg lower
than predicted. These model–data discrepancies could be re-
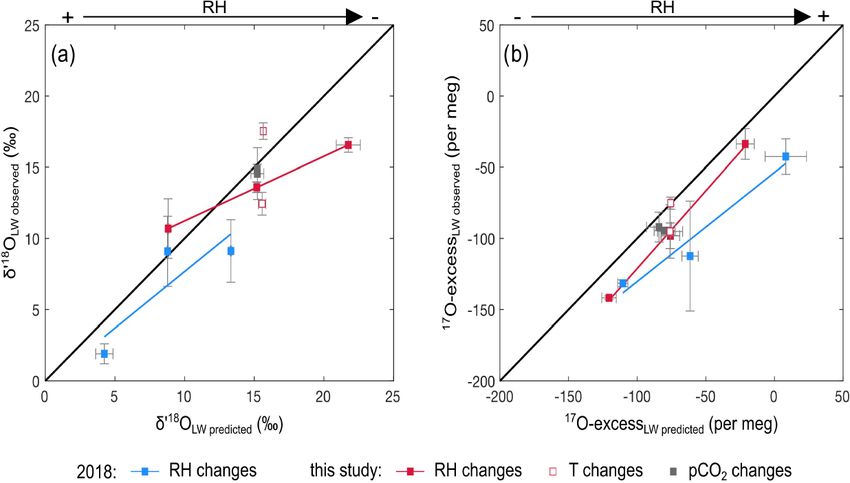
In order to consider the parameters responsible for the lated, as previously suggested (Alexandre et al., 2018; Li et
changes in the isotope composition of bulk leaf water, the al., 2017), to the misestimation of the isotope composition of
δ 018 O and 17 O excess values were predicted for the current the atmospheric water vapor. The isotope composition of the
and 2018 growth chamber experiments using the modeling vapor was measured close to the leaves in the current growth
method described in Sect. 1. Tleaf was assumed to be 2◦ C chamber setup. However, it may be heterogeneous at the mil-
lower than Tatm (Alexandre et al., 2019). For the 2018 ex- limetric scale around the leaves. In addition, the high vari-
periment, since the vapor was not measured, the associated ability of the isotope composition of leaf water observed be-
δ 018 O and 17 O excess values were set similar to those of the tween replicates suggests that despite the precautions taken
irrigation water as both fogged and irrigation waters came to harvest the grass regrowth as quickly as possible, changes
from the same tap water. The calculations are detailed in Ta- in climatic parameters and isotope composition of the atmo-
ble S3. spheric water vapor when moving the containers outside the
Figure 4 shows the observed and predicted δ 018 O and chambers may have a little biased the isotope compositions
17 O excess values of leaf water, for the CO , T
2 air and RH of the leaf waters. Outside atmospheric vapor with δ 018 O and
treatments. For the CO2 treatment, the small amplitude of 17 O excess values lower than inside the chamber would lower
changes in stomatal conductance, estimated from the CO2 the δ 018 O and 17 O excess of the leaf water during the mixing
concentration (Barillot et al., 2010; Ainsworth and Rogers, step of the evaporation process (Sect. 2).
2007), has no effect on the predicted δ 018 O and 17 O excess
of leaf water, in agreement with the observations. For the Tair
Clim. Past, 17, 1881–1902, 2021 https://doi.org/10.5194/cp-17-1881-2021Table 3. δ 018 O and 17 O excess values of stem phytoliths extracted from two grass species collected at the beginning and in the middle of the rainy season, at the AMMA-CATCH natural
observatory in Benin (Djougou, stations of Naholou, 9.74281◦ N, 1.60635◦ E, and Bellefoungou, 9.78992◦ N, 1.71007◦ E). Averaged values of δ 018 O and 17 O excess for the rainwater
of the rainy period preceding the samplings and values of fractionation between rainwater and phytoliths are shown. For comparison, values of fractionation between water and silica
https://doi.org/10.5194/cp-17-1881-2021
estimated according to Sharp et al. (2016) and Dodd and Sharp (2010) and assuming different values for λsilica−water are presented.
Sample1 Vegetation RH Tatm Phytolith (Phyto) Rainwater average (RW)2 Observed Phyto–RW Estimated silica–water
λ = 0.524 λ = 0.524 λ = 0.523 λ = 0.522 λ = 0.521
C. Outrequin et al.: 17 O excess of phytoliths, RH proxy
Phyto−RW
silica−water
silica−water
silica−water
silica−water
δ 018 O
δ 017 O
17 O excess
δ 018 O
δ 017 O
17 O excess
δ 018 OPhyto − δ 018 ORW
δ 017 OPhyto − δ 017 ORW
17 O excess
δ 018 Osilica − δ 018 Owater 3
δ 018 Osilica − δ 018 Owater 4
δ 018 Osilica − δ 018 Owater 4
17 O excess
17 O excess
17 O excess
17 O excess
λ
Av. SD Av. SD Av. SD n Av. Av. Av.
% ◦C ‰ ‰ ‰ ‰ per meg ‰ ‰ per meg ‰ ‰ per meg ‰ per meg ‰ per meg
NA-Hyp-T-17.09.18 Savanna 60 25 26.57 0.07 13.90 0.04 −132 1 2 −4.31 −2.25 24 30.88 16.15 −156 0.523 36.41 −146 31.12 −124 −156 −187 −218
BE-Andro-T-19.09.18 Dry forest 60 25 27.78 0.25 14.52 0.15 −150 18 2 −4.31 −2.25 24 32.09 16.77 −174 0.523 36.41 −146 31.12 −124 −156 −187 −218
NA-Hyp-T-19.05.19 Savanna 59.8 28.3 29.18 0.45 15.24 0.23 −171 10 2 −1.94 −1.01 13 31.11 16.24 −184 0.522 35.49 −142 30.53 −122 −153 −183 −214
BE-Andro-T-20.05.19 Dry forest 61.3 29.3 28.72 0.08 15.02 0.04 −138 1 2 −1.94 −1.01 13 30.65 16.03 −151 0.523 35.22 −141 30.36 −121 −152 −182 −212
Average 31.18 −166 0.523 35.88 30.78 −154
SD 0.63 16 0.0004 0.62 0.39 2
1 Sample name includes the grass species (Hyp for Hyparrhenia involucrata and Andro for Andropogon gayanus) and the sampling date (with DD.MM.YY). 2 Rainwater average amount weighted for the growth season preceding the sampling (1.5 and 5 months preceding September 2018 and May 2019, respectively). 3 According to Dodd
and Sharp (2010). 4 According to Sharp et al. (2016). Av: average; SD: standard deviation.
Clim. Past, 17, 1881–1902, 2021
18911892 C. Outrequin et al.: 17 O excess of phytoliths, RH proxy
Figure 4. Observed vs. predicted δ 018 O and 17 O excess of leaf water for the RH, Tair and CO2 concentration (CO2 ) treatments of the current
experiment and the RH treatment of the 2018 growth chamber experiment (recalculated from Alexandre et al., 2018). Predicted δ 018 O and
17 O excess values are reported in Table S3.
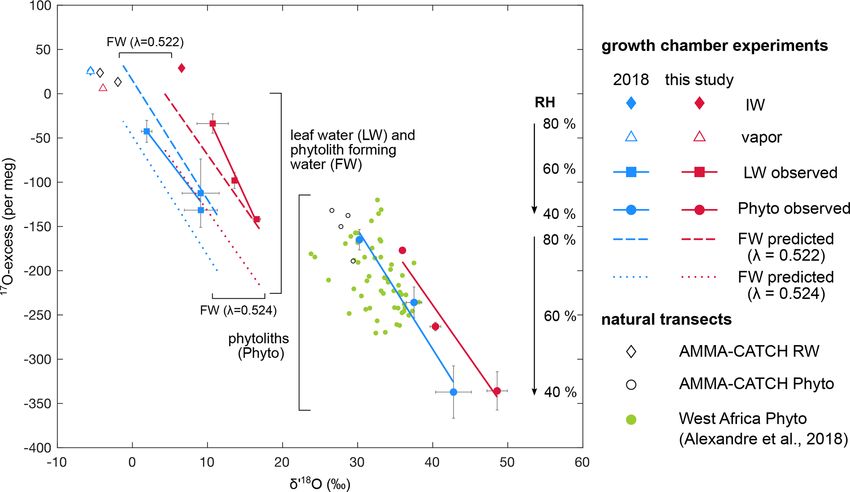
Figure 5 shows the leaf water isotope compositions at 5.2 Parameters controlling the triple oxygen isotope
40 %, 60 % and 80 % RH for the current and 2018 growth composition of phytoliths
chamber experiments as well as the isotope compositions of
the source water (i.e., irrigation water) in the 17 O excess vs.
As observed in Fig. 3 and reported in Sect. 4, Tair and CO2
δ 018 O space. In agreement with the observations, sensitivity
changes do not affect the 17 O excess of phytoliths. With re-
tests using the bulk leaf water model show that the isotope
gard to Tair , this is the consequence of θequil and λsilica−water
compositions of the source water (or the irrigation water)
changing little with temperature. For instance, using an equi-
and the difference in composition between the source wa-
librium δ 018 Osilica − δ 018 Owater value estimated from Dodd
ter and the atmospheric water vapor control the starting point
and Sharp (2010) and an equilibrium λsilica−water value of
from which the isotope composition of the leaf water evolves.
0.524 (Sharp et al., 2016), the 17 O excess of silica formed
When RH decreases, the isotope composition of the source
from a given water should vary by less than 10 per meg
water becomes the overriding factor. Because the 17 O excess
from 18 to 26 ◦ C, which is lower than the analytical preci-
values of the source waters in the current and 2018 experi-
sion range.
ments are similar, this has little effect on the dependency on
The phytolith triple oxygen isotope compositions at 40 %,
RH of the 17 O excess of leaf water.
60 % and 80 % RH are shown in Fig. 5 for the current and
This dependency is expressed for the current experiment
2018 growth chamber experiments. The regression lines es-
by Eq. (6):
tablished from the isotope compositions are characteristic of
17
evaporation trends. They are almost parallel for both exper-
OexcessLW−SW (per meg) = 2.8(±0.2) RH (%) iments (Student’s t test). As for the leaf water, contrasting
− 285(±14) (r 2 = 0.97; p value < 0.0001), (6) source water δ 018 O values and differences between source
water and water vapor δ 018 O values can explain their offset
where 17 OexcessLW−SW is the difference of 17 O excess be- in δ 018 O. The isotope compositions of soil phytoliths from
tween the LW and the source water (SW). Given the preci- the 2018 natural transect sampling and stem phytoliths from
sion ranges, this equation is close to Eq. (7): the AMMA-CATCH site are also shown in Fig. 5. The iso-
tope compositions of the soil phytoliths are distributed on
17
OexcessLW−SW (per meg) = 2.1(±0.7) RH (%) and around the 2018 growth chamber line. The isotope com-
positions of the stem phytoliths are also located closer to the
− 248(±44) (r 2 = 0.55; p value < 0.05), (7) 2018 growth chamber line than to the current one. This can
be explained by the proximity of the δ 018 O values of rain-
which is recalculated from the 2018 growth chamber dataset. water at the natural sites (from −1.5 ‰ to −4.5 ‰ for the
Clim. Past, 17, 1881–1902, 2021 https://doi.org/10.5194/cp-17-1881-2021C. Outrequin et al.: 17 O excess of phytoliths, RH proxy 1893 Figure 5. 17 O excess vs. δ 018 O of irrigation water (IW), final water vapor (V ), bulk leaf water (LW), phytolith (Phyto) and phytolith-forming water (FW) observed and predicted for the current and 2018 RH treatment where RH varies from 40 % to 60 % and 80 %. Phytolith-forming water values are predicted using equilibrium 18 αsilica−water estimated from Dodd and Sharp (2010) and λsilica−water values of 0.524 (Sharp et al., 2016) and 0.522 (Table S2). For comparison, values from the 2018 natural transect dataset (Alexandre et al., 2018) and from the AMMA-CATCH grass stem phytoliths and rainwater (RW) data (Table 3) are plotted. natural transect (Alexandre et al., 2018) and from −1.9 ‰ to gested that λPhyto−LW decreased from the base (0.523) to −4.3 ‰ for the AMMA-CATCH site) to the δ 018 O of the ir- the apex (0.521) of the leaves (Alexandre et al., 2019). The rigation water of the 2018 experiment (−5.6 ‰). These data mean value of the bulk grass leaf was 0.522 (recalculated support the idea that, as for bulk leaf water, the isotope com- from Alexandre et al., 2019). The increasing distance from position of the source water and the difference in composi- the λsilica−water equilibrium value of 0.524 was interpreted as tion between source water and the water vapor govern the the sign of an apparent kinetic fractionation increasing from starting point from which the triple oxygen isotope compo- the base to the apex. The proximity of δ 018 OPhyto − δ 018 ORW sitions of grass phytoliths evolve with decreasing RH. Since and λPhyto−RW averaged values obtained for phytoliths from the range of 17 O excess variation in the source waters and the grass stem samples collected at the AMMA-CATCH site the atmospheric water vapor is narrow in the growth cham- (Sect. 4.4) to the δ 018 Osilica −δ 018 Owater and λsilica−water equi- bers and is expected to be narrow at natural sites, the source librium values rules out a fractionation occurring systemati- water should have little impact on the RH dependency of the cally during high-temperature dehydration. It rather suggests 17 O excess of phytoliths. that the processes behind the apparent kinetic fractionation Figure 5 shows that the phytolith regression lines ob- are limited when evaporation is restricted, as is the case in tained from the 2018 and current growth chamber experi- stems. ments are shifted in 17 O excess, while this is not the case Heterogeneous silicification processes may contribute to for the leaf water lines. This can be linked to the mean an apparent kinetic fractionation between evaporated leaf value of λPhyto−LW calculated for the current growth chamber water and silica. At least two patterns of silicification in grass experiment (0.522 ± 0.0005) that is slightly lower than the leaf epidermis have been reported (Kumar et al., 2017). Short mean value recalculated for the 2018 experiment (0.523 ± cells are among the first types of cells to be silicified, some- 0.0012; Table S2). Previous measurement and modeling of times even before the leaf transpires. The process appears the evolution of the triple oxygen isotope composition of metabolically controlled and does not depend on the tran- the grass leaf water and phytoliths with leaf length sug- spiration rate. To the contrary, long cells silicify only when https://doi.org/10.5194/cp-17-1881-2021 Clim. Past, 17, 1881–1902, 2021
1894                                                                         C. Outrequin et al.: 17 O excess of phytoliths, RH proxy

the plant starts to transpire and all the more so as the tran-         that is indistinguishable from Eq. (9) expressed for the 2018
spiration rate increases. If the isotope composition of leaf           growth chamber experiment:
water changing with RH imprints only a portion of phy-
                                                                       17
toliths, with the other portion formed from unevaporated wa-                OexcessPhyto (per meg) = 4.4(±0.5) RH (%)
ter, then the apparent average values of δ 018 OPhyto − δ 018 OLW           − 510(±33) (r 2 = 0.92; p value < 0.001).               (9)
and λPhyto−LW will be lower than the values expected for iso-
tope equilibrium. The magnitude of the resulting apparent              When applying Eq. (9) to calculate 17 O excessPhyto from RH
fractionation will depend on the proportion of short-cell phy-         estimated for the 2018 natural transect (yearly averages of
toliths and the difference of isotope compositions between             monthly RH means for months with at least 1 d of precipita-
evaporated and unevaporated leaf water. The two parame-                tion higher than 0.1 mm), the mean difference is 1 ± 28 per
ters vary with RH and VPD in opposite ways. Our data show              meg (n = 55). It is 12 ± 28 per meg when using Eq. (8).
that the distance between δ 018 OPhyto − δ 018 OLW and equilib-           Added to the fact that the 17 O excess of phytoliths is in-
rium δ 018 Osilica − δ 018 Owater values increases with RH, at the     sensitive to changes in the δ 18 O of source water, Tair , pCO2 ,
same time as the proportion of short-cell phytoliths (inverse          or grass physiognomy (Alexandre et al., 2019), and assum-
of LC, Table 1 and Alexandre et al., 2018) increases, sug-             ing that variations in the 17 O excess of soil water and at-
gesting that, for the experimental conditions, the proportion          mospheric water vapor are narrow, this consistency between
of short-cell phytoliths has a preponderant influence.                 equations supports that in the 40 % to 80 % range, RH can be
   The triple oxygen isotope compositions of the phytolith-            reconstructed from Eq. (10):
forming water can be predicted at 40 %, 60 % and 80 %
RH for the current and 2018 growth chamber experiments                 RH(%) = 0.24 ± 0.02 17 OexcessPhyto (per meg)
(Table S2), using δ 018 OPhyto − δ 018 OLW and λPhyto−LW val-
ues equivalent to the δ 018 Osilica − δ 018 Owater and λsilica−water        + 121 ± 5 (r 2 = 0.98; p value < 0.0001),              (10)
expected for equilibrium (Dodd and Sharp, 2010; Sharp
                                                                       expressed for the current growth chamber experiment, and
et al., 2016). The regression lines from the predicted iso-
                                                                       that is not different from Eq. (11):
tope compositions are shown in Fig. 5. For an equilibrium
λPhyto−LW value of 0.524 the phytolith-forming water lines             RH(%) = 0.21 ± 0.02 17 OexcessPhyto (per meg)
are far from the leaf water ones. For a λPhyto−LW value of
0.522, the phytolith-forming water lines are approaching the                + 112 ± 6 (r 2 = 0.92; p value < 0.0001),              (11)
leaf water ones. At 40 % RH, the 17 O excess of the phytolith-
forming water is close to that of bulk leaf water. However, at         expressed for the 2018 growth chamber experiment. For both
60 % and 80 % RH, the 17 O excess of the phytolith-forming             equations, the statistical standard error associated with the
water is systematically higher than the 17 O excess of bulk            RH estimates is close to 3 %. When applying Eq. (10) to cal-
leaf water. At 80 % RH, it is even closer to the 17 O excess of        culate RH from 17 O excessPhyto values obtained for the 2018
irrigation water than to that of bulk leaf water. The process          natural transect, the mean difference between observations
described above may explain the offsets between phytolith-             and estimates is 0.0 ± 6.1 % (n = 55). It is 2.7 ± 6.6 % per
forming water and bulk leaf water δ 018 O and 17 O excess              meg when using Eq. (11).
values, especially pronounced at high RH. It can also ac-
count for the low λPhyto−LW values frequently encountered in           6     Conclusions
phytolith studies. However, the imprecision of the measured
λPhyto−LW values that can vary by ±0.001 for a specific cli-           An inter-laboratory comparison (CEREGE-UNM) allowed
mate treatment (Table S2) makes it impossible to discern a             us to standardize the phytolith triple oxygen isotope data rel-
trend of the apparent fractionation with RH or VPD.                    ative to the VSMOW-SLAP scale. After this standardization,
                                                                       the apparent λPhyto−LW values obtained so far vary between
                                                                       0.521 and 0.523±0.0004 (Alexandre et al., 2018, 2019). Het-
5.3     The RH proxy                                                   erogeneous silicification mechanisms in the leaves may result
                                                                       in an apparent kinetic fractionation and explain at least partly
Whatever are the processes responsible for the low appar-              that λPhyto−LW values are lower than the 0.524 value expected
ent λPhyto−LW values, their effect on the RH dependency of             for equilibrium. When the forming water is well constrained
the 17 O excess of phytoliths appears weak or reproducible.            as for phytoliths from non transpiring grass stems, the ap-
This RH dependency can be expressed for the current growth             parent λsilica−water value is 0.523 ± 0.0004, i.e., close to the
chamber experiment by Eq. (8):                                         equilibrium value.
                                                                          The datasets presented for phytoliths, leaf waters and
17                                                                     source waters show that the δ 18 O value of the source wa-
     OexcessPhyto (per meg) = 4.1(±0.3) RH (%)
                                                                       ter governs the position of the evaporation lines shown in
     − 500(±18) (r 2 = 0.97; p value < 0.0001),                 (8)    the δ 018 O vs. 17 O excess space for leaf water, phytoliths and

Clim. Past, 17, 1881–1902, 2021                                                            https://doi.org/10.5194/cp-17-1881-2021
You can also read