Crime in Santa Clara County 2018 - Prepared by: the County of Santa Clara
←
→
Page content transcription
If your browser does not render page correctly, please read the page content below
Crime in Santa Clara County - 2018

        Prepared by:
          The Crime Strategies Unit
          Santa Clara County District Attorney’s Office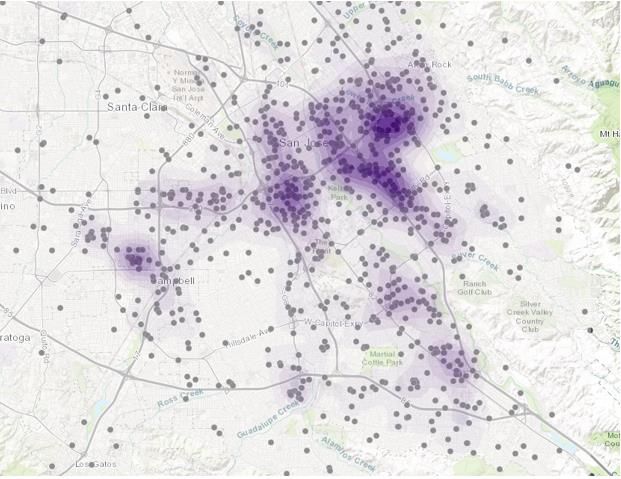
Page |1

Overview
In late 2016, the Santa Clara County District Attorney’s
Office formed a Crime Strategies Unit. The objective of this
unit was to engage in Intelligence-led Prosecution and
Policing, as part of a nationwide movement toward smarter,
data-driven solutions in Criminal Justice. This is the third
Annual Report from the Crime Strategies Unit, highlighting
countywide crime trends and unique lessons learned.

Executive Summary
Santa Clara County is a vibrant, diverse community with a
large population and historically low crime rates which have
consistently made it one of the safest large counties in the
U.S. This is still the case even as, in 2018, the County experienced an uptick in violent crimes. Some of
this is attributable to increases in juvenile crime and some is attributable to increased robberies. A
notable increase in sexual assaults seems to be – in part – a result of increasing reporting of the often-
unreported crime.

The Crime Strategies Unit directly responded to noticeable increases in violent crime, and specifically
gun-related crime, by directing resources toward gun violence reduction. In the last year, the Crime
Strategies Unit has been a regional leader for (1) Gun Law Education, (2) Crime Gun Intelligence, and (3)
Multi-Jurisdictional Gun Crime Strategies. This can be seen in the dramatic increase in gun protection
orders, taking weapons out of the hands of dangerous and/or suicidal people. The District Attorney’s
Office continued to support communities through its Community Prosecution Unit. The Community
Prosecutors integrated into the neighborhoods most impacted by violent crime, identified by the zip
codes outlined in this report, through both crime prevention and direct intervention efforts.

                                                                 Santa Clara County Crime Report - 2018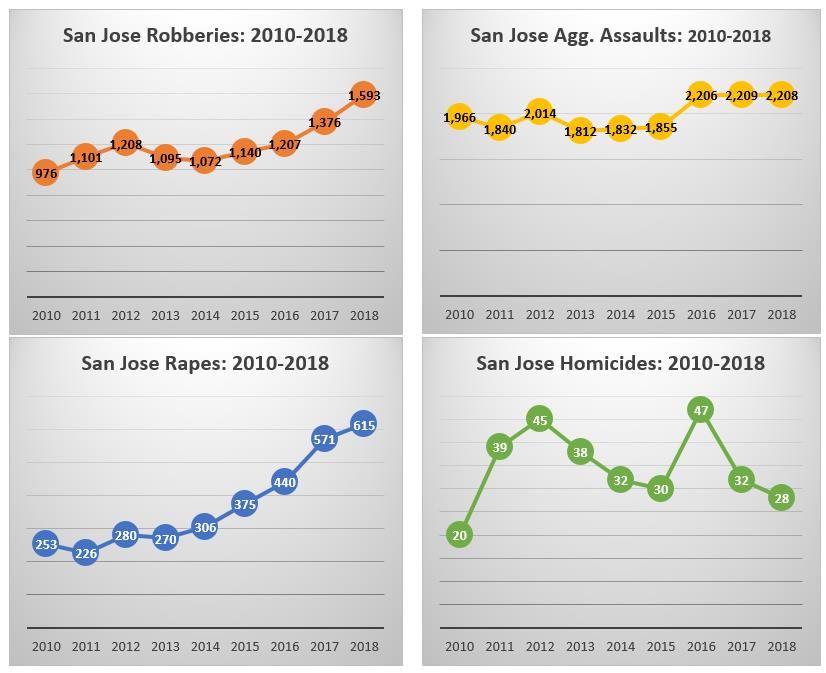
Page |2
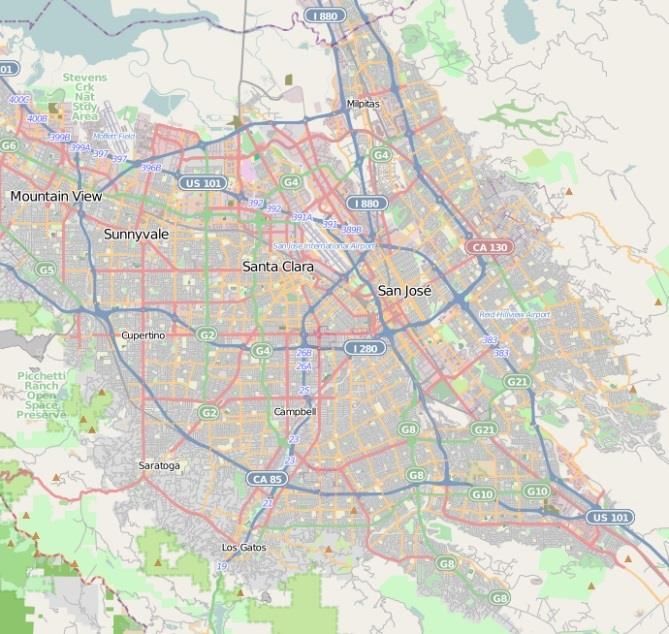
OUR COUNTY
Santa Clara County is the largest county in Northern
California, spanning from Palo Alto in the north to
Gilroy in the South. The county seat is in San Jose, the
country’s 10th most populous city, and the 3rd largest
in California. According to the US Census Bureau, the
County’s estimated 2017 population is 1,911,226
residents. It is the sixth largest county in California.
There are 15 cities in the county: Campbell,
Cupertino, Gilroy, Los Altos, Los Altos Hills, Los Gatos,
Milpitas, Monte Sereno, Morgan Hill, Mountain View,
Palo Alto, San Jose, Santa Clara, Saratoga, and
Sunnyvale. The County is very diverse, with its city
populations ranging in ethnic composition. The
County residents are, on average, highly educated
and have the highest median income among all
counties in the state. These factors are analyzed in
this report and compared to crime trends to see if
there are any correlations between demographics and crime.
Demographics of Santa Clara County
For the last several years, the Crime Strategies Unit has studied racial disparity in the prosecution
process, including an annual in-depth study called “Race and Prosecutions”. The report examines
disparity in filed criminal cases. Communities of color are over-represented in the criminal justice system
in Santa Clara County, and the defendant population overall hails from the poorest, least-educated and
least healthy parts of our community.
Race of Charged Defendants:
The broadest measure examined was the percentages of our total prosecutions for adult felonies and
misdemeanors against people of different racial or ethnic groups. As discussed here, race and ethnicity
are based on the defendant’s self-identification at booking or arrest. “Unknown” does not mean that a
person does not know their racial or ethnic identification, but rather that that information was not
entered into the electronic database to tabulate these totals.
When compared to the racial composition of our County, we prosecute a higher percentage of
Hispanic/Latino and Black/ African-American defendants compared to their representation in our
community. We prosecute a lower percentage of Asian/ Pacific Islander defendants compared to their
representation in the community. White/ Caucasian defendants are prosecuted in a percentage that is
closest to their representation in our County.
Santa Clara County Crime Report - 2018
Page |3

                                Race of Defendants in 2018, % of total
 60                                                                                          51.4%
                                                                                     50.4%
 50
 40    32.6%                                             35.2%
 30            26.6                                                             26.1%
                      23.5%
 20                                      12% 13.9%
                                                               8.2% 9.2%
 10                               2.4%                                                               3.7% 2.8% 2%
  0
            White                        Black                 Asian                Hispanic              Other

                                      SCC Population*          Misdemeanor           Felony

                                         *2017 population values from Census Fact Finder

As with prior years, the racial disparities that exist in felony cases are even more pronounced, with
13.9% of felony cases involving Black/African American defendants, and only 9.2% of felony cases
involving Asian defendants.

       Misdemeanor Defendants: 2018                                        Felony Defendants: 2018
          Asian/Pac.          Other                                                        Other
                                             Black/
              Isl.             3%                                      Asian/Pac. Isl.      2%       Black/Af.Amer
                                            Af.Amer
              8%                              12%                           9%                            14%

                                                    White/
                                                   Caucasian
                                                     27%
                                                                                                           White/
                                                                                                          Caucasian
      Hispanic/                                                         Hispanic                            24%
       Latino                                                           /Latino
        50%                                                               51%

                                                                             Santa Clara County Crime Report - 2018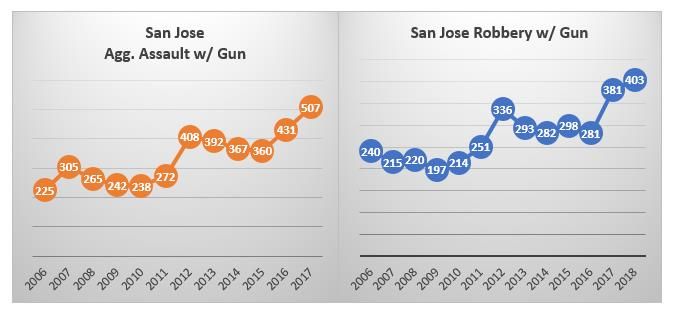
Page |4

      Zip Code Analysis
      Another necessary component for understanding prosecution disparity is understanding where the
      charged defendants live. Examining 2018 charged cases, we see that the lions’ share of the county’s
      criminal defendants live in five zip codes: 95020 (Gilroy), 95112 (Downtown San Jose), 95111 (Southeast
      San Jose), 95122 (East San Jose) and 95127 (East San Jose/Foothills). The chart reflects our adult
      offenders. Later in this report we see how the juvenile offender population looks slightly different.

                         Number of Charged Defendants by Zip Code: 2018

In zip code 95127 (E SJ, Foothills),
there were 1,557 charged defendants.

       95112 (Downtown SJ): 2,052

       95122 (E SJ): 1,619

        95111 (SE SJ): 1,551

                                   95020 (Gilroy): 1,982

                                                    Source: SCC DAO

                                                                      Santa Clara County Crime Report - 2018
Page |5

The Santa Clara County Public Health Department compiles robust data about education, employment,
health and safety for each of the zip codes in the County. Looking more closely at our defendant zip
codes, we find that defendants most commonly reside in poorer, more dangerous, and less healthy
neighborhoods. As seen in the table below, these disparities are pronounced across all categories in the
zip codes with the highest defendant populations. In particular, a majority of residents in these
neighborhoods report that crime is somewhat or a major problem, whereas the rest of the county feels
mostly safe. 1

                                                              95112        95111                      95127
                                    County        95020                               95122 (East
                                                            (Downtown    (Southeast                    (East
                                    Overall      (Gilroy)                              San Jose)
                                                             San Jose)    San Jose)                  Foothills)

 Median household income           $106,761      $90,144     $60,569      $66,549       $66,606       $84,239

 Unemployed                          5.7%          6%         7.7%         7.5%           8%             6.8%

 Families below Poverty Line         5.6%         8.4%        10.3%       13.6%          14.1%           7.5%

 Families with children
Page |6
GUNS
California has some of the most robust gun and ammunition regulations in the country. The gun laws
are numerous and ever-changing, making it challenging for law enforcement to stay updated about the
laws. In 2018, the Crime Strategies Unit began an education campaign to spread the word to law
enforcement and the community about gun regulations. The goal is to encourage the police and public
to tackle gun violence using existing laws and partnerships. This has taken on renewed urgency in a time
when handgun sales are near all-time highs, gun-related crime is increasing, and gun-related deaths are
increasing.
We know that in California, guns are involved in a staggering number of violent crimes. Between 2011
and 2017: 2
69% of homicides involved a firearm
29% of robberies involved a firearm
3
18% of aggravated assaults involved a firearm
Gun violence impacts children in a profound way. The National Survey of Children’s Exposure to
Violence indicates that 4.2% of children aged 0 to 17 in the United States have witnessed a shooting in
the past year. Gun-related injuries are the third leading cause of death among U.S. Children, more than
heart disease, influenza and congenital anomalies.4
According to the Gifford’s Law Center, gun violence is costly for Californians, not just in terms of the
lives lost and injuries suffered, but the financial impact of hospitalizations. The direct costs of gun-
related hospitalizations in California is estimated at $87.4 million dollars in 2010, 65% of which was said
to be shouldered by taxpayers.5
6
Santa Clara County Crime Report - 20187
What Are We Doing About It?
The Crime Strategies Unit has made Gun Violence reduction one of its primary missions. In collaboration
with multiple County partners including the Department of Public Health, the City of San Jose and the
County Board of Supervisors, the Crime Strategies Unit has three missions to help reduce gun violence
and spread awareness about gun crimes:
(1) Gun Law Education Campaign
CSU drafted a gun law reference guide to educate police and prosecutors about California Gun
Laws. The attorneys at CSU have trained hundreds of officers about ever-changing gun laws to
assist in better enforcement in the County. This includes Countywide education about Gun
Violence Restraining Orders, described below.
(2) Gun Related Intelligence Program
This program harnesses the power of existing ballistic and firearms testing to solve gun crimes
and analyze linked shooting cases. The intelligence analysts at CSU will help investigators put
together the common pieces from shooting scenes to solve crime and then provide these
linkages and leads to police agencies.
(3) “Trigger Lock” Initiative
Through ongoing collaboration with county and federal prosecutors, CSU works to identify
crime-drivers who are better suited for prosecution by the US Attorney’s Office in instances
where federal law more appropriately holds the offender accountable.
Firearms Testing and Crime Gun Intelligence
Existing technology allows police to solve shootings by rapidly submitting and processing firearms
evidence. Using a database called NIBIN (National Integrated Ballistic Information Network), police
submit spent shell casings from shooting scenes and recovered crime guns to compare unique markings
on each. This allows investigators to quickly link shootings to one another, providing quick andPage |8
invaluable leads in the most serious kinds of crimes. The Crime Strategies Unit is proud to have built a
Gun Related Intelligence Program (GRIP), to help police investigators, crime lab technicians, federal
partners and intelligence analysts quickly and collaboratively solve gun crimes. When two or more cases
are linked to a single firearm by examiners at the Crime Lab, the GRIP analysts open a GRIP case, and
work to try and solve the cases through follow-up with the police agencies and witnesses. The program
continues to expand and deliver impressive results, including multiple solved murder and attempted
murder cases, thanks to firearms evidence and information-sharing.
2017 2018 2019
as of 5/1/19
GRIP Cases 36 78 27
Total Linked Agency Cases 115 251 70
Homicides w/ NIBIN lead 6 9 7
One of the other important functions of analyzing Gun Intelligence is the ability to identify the
neighborhoods that are the most impacted by gun violence. GRIP Analysts study gun incidents, like the
ones seen in the map below, to help direct resources to areas most impacted by gun activity. In the map
below, we see all gun-related crimes (discharges, shootings, gun possession) from January 2018 to
March 2019 that GRIP analysts looked at during their analysis of Santa Clara County violence. This work
helps investigators respond to current patterns of gun violence in a data-driven way.
Santa Clara County Crime Report - 2018Page |9
Gun Violence Restraining Orders
Another powerful tool for combatting gun violence is the Gun Violence Restraining Order (GVRO). This
law allows police to apply for a court order from a judge to remove guns and ammunition from
individuals who pose a risk of harm to themselves or others. According to a survey done by the
Sacramento Bee, GVROs were used only a handful of times across the state from its inception in 2016 to
the present (86 times in 2016, and 104 times in 2017).8 In 2017, the entire County of Santa Clara only
issued 4 GVROs, but after CSU’s education campaign, in 2018 they issued 33.
2018 Juvenile Crime:
The Crime Strategies Unit gathered data from District Attorney Office juvenile filings to conduct
an analysis of juvenile crime occurring in San Jose during 2018. Initial results of this analysis
indicate that the number of minors charged with robbery and carjacking increased significantly
in 2018. Additionally, the number of minors charged with residential burglary reached a high-
water mark in 2018. 9
2018 MINORS CHARGED (BY CRIME TYPE)
As closer look at the minors charged in 2018 examined their racial background, age, and
gender. The analysis shows that Hispanic/Latino juveniles were significantly more likely to be
Santa Clara County Crime Report - 2018P a g e | 10
charged with crimes in all examined categories than all other racial backgrounds combined.
Almost 80% of the 2018 juvenile demographic filings consisted of Hispanic/Latino juveniles.
While male Hispanic/Latino juveniles were more likely than female Hispanic/Latino juveniles to
be arrested and charged with a crime, both genders were significantly more likely to be charged
than any other race and corresponding gender displayed in the demographic filings.
2018 JUVENILE CRIME DEMOGRAPHICS
When examining the number of times that a particular offense was charged in any count on the
petition, we similarly see a noticeable spike in charged robberies and carjackings in 2018, as
compared to the prior seven years. In addition, there has been a steady increase in filed
residential burglaries over that period of time.10
NUMBER OF TIMES CRIME WAS CHARGED - BY CRIME TYPE
Minors charged with the most common felony offenses live in some of the same neighborhoods as their
adult counterparts, however the most frequently seen zip code of residence in the juvenile population is
Santa Clara County Crime Report - 2018P a g e | 11
95116 (Northeast San Jose). In the adult population, that is not in the top five defendant zip codes. Here
are the most common zip codes of residence for charged minors, broken down by charged offense:
The Community Prosecution Unit works closely with community stakeholders to understand this data
and to devote resources to the neighborhoods that are the most impacted by juvenile crime. In 2019,
the Crime Strategies Unit and the Community Prosecutors will look more closely at the data to
determine appropriate prevention and intervention in these neighborhoods.
Santa Clara County Crime Report - 2018P a g e | 12
PROSECUTION DATA
Thousands of cases are brought to the Santa Clara County District Attorney’s Office every year for
review. They are submitted by the investigating agencies after an arrest or investigation, and attorneys
make a decision about whether to file criminal charges. If the prosecutor decides there is sufficient
evidence to charge someone with a crime, a criminal case is “issued” against the suspect. The Crime
Strategies Unit examined the issuing practices in Santa Clara County to see the trends in prosecution
practices.
Cases Issued by the DAO
45000
40000 678 2302 1659
867 2302 368
35000
30000
25000
20000
23323 25892 25989 28373 29462 29902
15000
10000
5000
9845 6715 7914 8606 6715 7046
0
2013 2014 2015 2016 2017 2018
Felony Misdemeanor Infraction
Figure 1 As part of its move toward paperless prosecution, the DA’s Office started counting misdemeanor/infraction cases
issued by citation in 2017, allowing for a more precise measurement of misdemeanor cases prosecuted in the office. These
cases were previously handled by the DA’s office but not counted in the records management system, making the 2017
misdemeanor total seem much higher than in prior years.
Top 10 Filed Felonies in 2018
700 639
600
500
400 357 340
VC 334 331
10851 298
300 270 260
224 203
PC HS PC 212.5(c) PC
200 460(b) PC PC
11378 487(a) PC
273.5(a) 245(a)(1) PC
245(a)(4) PC
100 460(a) 422(a)
0
Unauthorized Use of Vehicle Burglary 2nd Deg
Poss Meth to Sell Robbery 1st Deg
Grand Theft Inflict Corporal Injury to Spouse or Cohabitant
ADW not firearm Assault likely to produce great bodily injury
Burlgary 1st Deg Criminal Threat
Santa Clara County Crime Report - 2018P a g e | 13
Issuing Practices By Case Type:
The totals below reflect number of times that a charge is issued in any count on the complaint. If the
defendant committed several burglaries, for example, that would be counted multiple times, one for
each separate committed crime.
Theft Felony Charges
600 550
526 529
500
400
297 287 289 296 280 305 294
300 273 263 273 270 264
238 244
212
200 162 165 166
100
0
2012 2013 2014 2015 2016 2017 2018
PC 460(a) - Residential Burglary PC 460(b) - Commercial Burglary PC 487(a) - Grand Theft
Second degree burglaries declined after Prop 47 in 2014 though there was a slight increase in 2017 and
2018. The law changed commercial burglary so that if you steal from a business during working hours,
the crime is a misdemeanor. However, if you steal from a business when it is closed (meaning you broke
in and stole), it is a felony. Residential burglary filings were slightly down in the last two years.
350 Violent Felony Cases 328
293
300 273 266
253 254 262 253
246 249 245 250
250 232
219 221 215
205 203 197
200
150 124
108
100
50
0
2012 2013 2014 2015 2016 2017 2018
PC 211-212.5 (a,b,c) - Robbery PC 245(a)(1) - Assault w/ Weapon PC 245(a)(4) - Felony Assault
In 2017 and 2018 filed robbery charges were up significantly. This is consistent with police crime data,
showing a large increase in reported robberies in 2017 and 2018.
Santa Clara County Crime Report - 2018P a g e | 14
Sexual assault filings have remained relatively stable compared to the other crimes examined herein. For
purposes of the analysis below, we looked at the most commonly filed sexual assault charges: PC 220
(assault with intent to commit sexual act), PC 261 (rape), PC 261.5 (statutory rape), PC 266h (pimping),
PC 266i (pandering), PC 269 (aggravated sexual assault), PC 288 (child sexual assault), PC 288.5
(repeated child sexual assault), PC 288.7 (child sexual assault), PC 288a (forced oral cop), PC 289 (digital
penetration), PC 311.11 (child pornography).
Sexual Assault Charge Filings
350
300
250
200
150 297 324
275 284 268 279
243
100
50
0
2012 2013 2014 2015 2016 2017 2018
Family violence includes assault on a spouse, family member or cohabitant. Felony assault usually
involves more than a minor injury. Felony filings in 2017 and 2018 were up compared to prior years. For
the chart below, charges counted were: PC 243(e) (battery on spouse/cohabitant), PC 273.5(a) (injury to
spouse/cohabitant), PC 273.6 (viol. of DV protective order).
Family Violence Charged Offenses
2000
1800
299 260 276 329
1600 261 349
1400 258
1200
1000
800 1564 1572 1519 1519
1485 1400
600 1299
400
200
0
2012 2013 2014 2015 2016 2017 2018
Misdemeanor Felony
Santa Clara County Crime Report - 2018P a g e | 15
Misd. Resisting Arrest Filings - PC 148
801
694 660 697
632
521 555
2012 2013 2014 2015 2016 2017 2018
In 2016 San Jose Police department provided body worn cameras to all patrol officers. Since then there
has been an uptick in resisting arrest filings, charged under Penal Code section 148(a)(1).
Misd. DUI Filings
5675
5222 5364
4921
4225 4066
3870
2012 2013 2014 2015 2016 2017 2018
Driving under the influence is the most commonly filed charge in the DA’s office. DUI filings have
steadily declined in recent years.
CRIME STATISTICS
In order to adequately address crime in Santa Clara County, the Crime Strategies Unit looks at
Countywide metrics for the most common kinds of crime (burglary, stolen cars, robberies, shootings)
and compares it to prior years and surrounding jurisdictions. In the charts below, we can see our County
compared to other years and locations. The most notable issue in recent years is the marked increase in
violent crime in San Jose. This has helped shape recent projects and focus for CSU and its partners.
Santa Clara County Crime Report - 2018P a g e | 16
Property Crime in Santa Clara County:
These charts are weighted for population and look at Santa Clara County’s largest jurisdictions. The
charts on this page utilize reported numbers from California Department of Justice, and may differ
slightly from FBI’s Uniform Crime Reporting statistics.11
Santa Clara County Crime Report - 2018P a g e | 17
“Vehicle Theft” is the taking of a vehicle, as opposed to “Auto Burglary” which is breaking into a vehicle
to steal property from the interior.
Santa Clara County Crime Report - 2018P a g e | 18
“Property Crime” as reflected in the following chart is a combined total of the four crime categories:
Burglary, Larceny, Vehicle Theft and Arson. This data is reported to the FBI annually.12
Property Crime per 10k Residents in Biggest CA Cities
700
600
500
400
300
200
100
0
2008 2009 2010 2011 2012 2013 2014 2015 2016 2017
Santa Clara County Crime Report - 2018P a g e | 19
Property Crime per 10k Residents in Biggest US Cities
800.00
700.00
600.00
500.00
400.00
300.00
200.00
100.00
-
2008 2009 2010 2011 2012 2013 2014 2015 2016 2017
Violent Crime
The term “Violent Crime” for this report and for FBI and California Dept. of Justice data reporting,
denotes a combined total of Rapes, Robberies, Aggravated Assaults and Homicides. In recent years, San
Jose’s overall reported violent crime has been increasing. This is driven primarily by a marked increase in
reported rapes and robberies. In 2018 reported rapes in San Jose were at their highest levels in years, in
part due to a dramatic increase in carjackings (which are included in reported robbery totals).
Rape Statistics: In 2013, the FBI revised the definition of “rape” for purposes of these statistics. The
revised definition now includes cases where the victim is male; cases of oral or anal penetration; and
non-consensual cases where force was not used. Therefore, even without any change in occurrence of
crime, we would expect these statistics to increase starting in 2014/2015. Firsthand reports from law
enforcement suggest that the reporting rate for sexual assaults has increased in recent years, perhaps
due to changes in societal attitudes, or increased attention to the problem of sexual assault. Sexual
assault is among the most under-reported crimes (that is, victims of sexual assault are less likely to
report than victims of other violent crimes such as robbery), so changes in reporting rates would affect
its statistics more sharply.
Santa Clara County Crime Report - 2018P a g e | 20
San Jose Violent Crime: 2010-2018
4,444
4,188
3,900
3,547 3,400
3,215 3,206 3,215 3,242
2010 2011 2012 2013 2014 2015 2016 2017 2018
Santa Clara County Crime Report - 2018P a g e | 21
When compared to similar jurisdictions around California and the nation, San Jose’s overall violent crime
is one of the lowest. The issue for San Jose and Santa Clara County in the coming years will be to address
the root causes of the latest upward trends. In collaboration with our County partners, the Crime
Strategies Unit works to study and address these causes.
Violent Crime Per 10k in California Cities
250
200
150
100
50
0
2008 2009 2010 2011 2012 2013 2014 2015 2016 2017
Violent Crimes per 10k Residents U.S Cities
160
140
120
100
80
60
40
20
0
2008 2009 2010 2011 2012 2013 2014 2015 2016 2017
New York Los Angeles Houston Phoenix Philadelphia
San Antonio San Diego Dallas San Jose Austin
Santa Clara County Crime Report - 2018P a g e | 22
CONCLUSION
This report shows that Santa Clara County has been experiencing changes in its population, crimes and
prosecutions in the last decade. With a growing, high-income population, Santa Clara County maintains
low property crime rates compared to large counties in the state. Meanwhile, more work is needed to
analyze the cause of two years of increasing violent crime levels. San Jose still compares well against its
historic long-term crime levels, remaining well below the high-water crime mark in the 1990s.
To acknowledge and address the rising violent crime in Santa Clara County, the Crime Strategies Unit will
conduct regular crime trend monitoring and intelligence analysis to assist police officers in combatting
crime. To address gun violence, the Unit is working with the Crime Lab to expedite gun evidence
processing and solve more gun crimes. The goal is to bring shooters to justice and keep them from
further victimizing vulnerable neighborhoods.
Santa Clara County Crime Report - 2018P a g e | 23
ENDNOTES
1Santa Clara County Department of Public Health, Zip Code Profiles, available at:
https://www.sccgov.org/sites/phd/hi/hd/Pages/zipcodes.aspx , and United States Census data, www.census.gov, ACS
Factfinder
2 California DOJ, 2016 Crime Report, available at: https://openjustice.doj.ca.gov/
3 Math done by dividing the number of homicides, robberies, and aggravated assaults with a firearm with the total number of
homicides, robberies, and aggravated assaults between the years of 2011-2017 using statistics from: Department of Justice.
“CRIMES & CLEARANCES.” State of California Department of Justice - OpenJustice
4 Fowler, Dahlberg, Haileyesus, Gutierrez “Childhood Firearm Injuries In the United States” (Pediatrics, Vol. 140, July 2017)
5Embry M. Howell et al., State Variation in Hospital Use and Cost of Firearm Assault Injury, 2010, 1 (2014), available
at http://www.urban.org/research/publication/state-variation-hospital-use-and-cost-firearm-assault-injury-2010 [found online
at: Giffords Law Center website: http://lawcenter.giffords.org/facts/statistics/]
6Department of Justice. “CRIMES & CLEARANCES.” State of California Department of Justice - OpenJustice,
openjustice.doj.ca.gov/crime-statistics/crimes-clearances
7Department of Justice. “CRIMES & CLEARANCES.” State of California Department of Justice - OpenJustice,
openjustice.doj.ca.gov/crime-statistics/crimes-clearances
8“Best Tool To Prevent Gun Violence is Rarely Used” by Alexei Kosoff (Sacramento Bee, March 29, 2018)
http://www.sacbee.com/latest-news/article206994229.html
9 Juvenile Crime Statistics derived from DA Office Data, maintained in the CIBERLaw Case Management System.
10All statistics derived from the DA office CIBERLaw Case Management System, in this chart the numbers reflect the number of
times a crime was charged in any count on a petition, as opposed to the number of minors charged or the number of times a
case had that count as the primary charge.
11
Department of Justice. “CRIMES & CLEARANCES.” State of California Department of Justice - OpenJustice,
openjustice.doj.ca.gov/crime-statistics/crimes-clearances
12
Data maintained at: FBI Uniform Crime Reporting, https://ucr.fbi.gov/crime-in-the-u.s
Santa Clara County Crime Report - 2018You can also read