Crude Oil Price Dwindling and the Nigerian Economy: A Resource-Dependence Approach
←
→
Page content transcription
If your browser does not render page correctly, please read the page content below
Modern Economy, 2021, 12, 1160-1184
                                                                                                   https://www.scirp.org/journal/me
                                                                                                             ISSN Online: 2152-7261
                                                                                                               ISSN Print: 2152-7245

Crude Oil Price Dwindling and the Nigerian
Economy: A Resource-Dependence Approach

Enaibre Felix Ighosewe1*#, David Chucks Akan1*#, Oghenekparobo Ernest Agbogun2*#

Accounting, Banking and Finance Department, Asaba Campus, Delta State University, Asaba, Nigeria
1

Banking and Finance Department, University of Benin, Benin, Nigeria
2

How to cite this paper: Ighosewe, E.F.,           Abstract
Akan, D.C. and Agbogun, O.E. (2021).
Crude Oil Price Dwindling and the Nige-           This study examined the effect of Crude Oil Fluctuation and the Nigerian
rian Economy: A Resource-Dependence Ap-           economy: A resource-dependence approach covering a study period of 35
proach. Modern Economy, 12, 1160-1184.
                                                  years (1984-2018). Variables used include Fluctuation in Oil Price per Barrel
https://doi.org/10.4236/me.2021.127061
                                                  (FOBP), Diesel Pump Price Fluctuations (PPPF), Petrol Pump Price Fluctua-
Received: June 2, 2021                            tions (DPPF), Kerosene Pump Price Fluctuation (KPPF), and Real GDP. The
Accepted: July 25, 2021                           data were gotten from the CBN Statistical Bulletin, World Bank Report, and
Published: July 28, 2021
                                                  Oil Producing Exporting Countries Annual Report while it was analyzed us-
Copyright © 2021 by author(s) and                 ing Auto-Regressive Distributed Lag Model. Various diagnostic tests proved
Scientific Research Publishing Inc.               that the model is fit for the study. Accordingly, the trend analysis appears to
This work is licensed under the Creative
                                                  cast doubts on whether crude oil fluctuation made significant contributions
Commons Attribution International
License (CC BY 4.0).                              to the Nigerian economy. However, the Pearson correlation coefficient sub-
http://creativecommons.org/licenses/by/4.0/       stantially attests to a strong linear relationship between the regressed and the
                Open Access                       regressors. Particularly, the individual results restated that in the short run
                                                  only Fluctuation in Oil Price per Barrel (FOBP) improved the Nigerian econ-
                                                  omy significantly. However, in the long run, both Fluctuation in Oil Price per
                                                  Barrel (FOBP) and Kerosene Pump Price Fluctuation (KPPF) improve the Ni-
                                                  gerian economy significantly. Hence we conclude that, if the Nigerian econo-
                                                  my must experience outstanding performance, both the private and public
                                                  agencies should not interfere in the apex bank surveillance on the excess
                                                  crude account. More so, the federal government should endeavor to indu-
                                                  strialize the Nigerian economy.

                                                  Keywords
                                                  Crude Oil Fluctuation, Economic Performance, Nigeria,
                                                  Resource Dependence Approach

                                              #
                                               Enaibre Felix Ighosewe (PhD), David Chucks Akan (FCA, PhD), Oghenekparobo Ernest Agbogun
                                              (Master’s Student).

DOI: 10.4236/me.2021.127061 Jul. 28, 2021                          1160                                              Modern Economy
E. F. Ighosewe et al.

                              1. Introduction
                              Crude oil is popularly known as fossil fuel or better still “oil” is a naturally
                              occurring substance that is found in widely differing quantities in different parts
                              of the world. Although it does not have any desirable quality in its raw state
                              when it is refined into different products (petroleum motor spirit, diesel fuels, jet
                              fuels, and petroleum gas) it becomes useful. By its nature, it is highly volatile,
                              highly deflectable, and highly capital intensive. Since its discovery in Oloibiri,
                              Bayelsa State, Nigeria in 1956 by Shell B.P, it has continually sharpened the Ni-
                              gerian economic and political trajectory. In like manner, it has helped to reduce
                              the poverty level in the country through the provision of infrastructures which
                              has fastened the growth and development process. Of course, the returns from
                              natural gas exploitations have enabled the country to experience a post-current
                              account surplus over the years (Ogbonna & Orlu, 2017). Reportedly, 80% of Ni-
                              geria’s energy revenues go to the national government, 16% cover operational
                              costs while investors get the remaining 4% as returns on investment (Okonkwo
                              & Mojekwu, 2018).
                                Accordingly, increased oil prices in the early 1970s led to the enormous de-
                              velopment of the Nigerian economy. However, hopes that the Nigerian economy
                              will gather the strong growth momentum as it was in the early ‘70s are less likely
                              in present times. This is because economic growth was driven by the rapid ex-
                              pansion of oil production capacity as well as massive public sector investment in
                              the oil and gas sector. Again, the crude oil price is more prone to a series of
                              fluctuations now than then. For example, Brent oil price fell from $114.91 on
                              January 31st, 2014 to $102.12 on May 31st, 2014, and stood at $57.8 and $67.6 on
                              March 31st, 2015. (Keji, 2018) opined that, these slumps alongside subsequent
                              especially in the areas of industrial sector’s development, foreign reserve man-
                              agement, currencies crisis management, reduction in government revenue, and
                              ultimately, threat in terms of the country’s inability to pay off all outstanding
                              foreign debt holding.
                                Most assuredly, since the mono-product growth strategies adopted by the Ni-
                              gerian government appear to be ineffective, policy analysts then advise develop-
                              ing countries like Nigeria to hedge against the negative effect of oil price fluctua-
                              tion on its economy by diversifying its economy. But the issue here is: is oil price
                              fluctuation the reason why the Nigerian economy is yet to be developed or what
                              then is the real cause? Again, a painstaking appraisal of the cyclical effect of
                              crude oil price dwindling on economic growth reports converging and concav-
                              ing results. Hence, the present study fills the research gap in extant studies by
                              clarifying our understanding of the crude oil price slump in terms of the magni-
                              tude of its impact on economic growth. To this end, the present study examined
                              the effect of crude oil price shock on economic growth in Nigeria. Specifically,
                              the study sought to evaluate how fluctuation in oil price per barrel, fluctuation in
                              the Petrol pump price, fluctuation in Diesel pump price, and fluctuation in Ke-

DOI: 10.4236/me.2021.127061                       1161                                           Modern Economy
E. F. Ighosewe et al.
rosene pump price impact real gross domestic product in Nigeria from 1984 to
2018.
Although many are of the strong assertions that crude oil fluctuation is detri-
mental to economic performance, our major argument is that the issue is not on
crude oil fluctuation itself but on how efficient the management process is and
on how efficient the Nigerian refineries are. Consequently, if these contending
issues are handled adequately, the Nigerian economy will trend amidst fluctua-
tions. The present study is both theoretically and empirically useful in that it is
targeted at validating theoretical postulations and empirical findings on the sub-
ject matter. Also, the study will serve as resource material to policy analysts,
government agencies, researchers, and the likes.
2. Literature Reviews
This section covers the conceptual framework, theoretical framework, empirical
reviews, and the literature gap.
2.1. Conceptual Framework
The term “crude oil price dwindling” is of great concern to most economies
because a sudden hike in prices has been found to cause a fall in global output.
However, the construct does not have a universally acceptable definition. This
is because of its multi-facet nature in that it may be also referred to as oil
price shock, changes, volatility, fluctuations, or variations as the case. In trying
to define the construct, researchers have viewed the construct from two view-
points-Supply and demand sides. (Ogiri et al., 2013) defined oil-price dwindling
as an inward shift in the supply curve for crude oil that is triggered by political
events exogenous to the oil market and the macro-economy within a period, such
as a day, a week, a month or a year. In other words, (Baumeister & Kilian,
2016) viewed oil price fluctuations as unanticipated components of a substan-
tial change in the price of oil, defined as the difference between the expected
and realized oil price. In the same vein (Nwanna & Eyedayi, 2016), oil price
dwindling as a large unanticipated change in world economic conditions which
impacts upon a national economy which could come in form of a shift in the
terms of trade, a slowdown in the growth of world export demand and an in-
crease in interest rates set by world financial markets. In the simplest term, oil
price dwindling could boost economic growth in that it could make the price of
crude oil at the international market to appreciate at the expense of domestic oil
prices.
(Manasseh et al., 2019) viewed oil price fluctuation or variation or oscillation
as the persistent upward or downward swing in the prices of oil over a long time
followed by periods in which the price of oil in the international market is rela-
tively calm. Such swings are usually caused by either demand or supply side of
the international oil market resulting from political upheavals in the oil-rich
middle-east, and the growing oil demand in Asian countries.
DOI: 10.4236/me.2021.127061 1162 Modern EconomyE. F. Ighosewe et al.
(Keji, 2018) opined that oil price swing entails disruptions in the smooth flow
of commodities across different markets. The author added that for such ab-
normally to be corrected, it requires such a nation must be abreast with efficient
energy policy. Further, identifiable factors which led to series of slumps so far
include a rise in demand in emerging economies, global financial crises, strikes,
wars, and decreased oil production, reduction in global investment in the indus-
try; lack of refinery expansion capacity; supply bottlenecks and risk related with
domestic problems (for example, Nigeria), and international politics (Iraq, Iran,
Russia, and Venezuela) and commoditization of world oil (Donwa et al, 2015).
Other identifiable factors include selfishness, ignorance, poor institutional
framework, corruption and nepotism, mismanagement and embezzlement of
public funds by public office holders at all levels of government. Also, many ef-
forts were not taken to diversify the economy in anticipation of possible negative
shocks (Oyeyemi, 2013). More explicitly, (Nwanna & Eyedayi, 2016) categorized
these factors into the demand side, supply side, geographical and other consid-
erations. His viewpoints are discussed below:
Demand Side: As countries develop, industrialization, rapid urbanization, and
increase their citizenry’s living standards, their oil demand will increase as well.
As such, if the demand for crude oil is perfectly inelastic to variation in the oil
price level, it will in turn increase import bill for the net oil-importing econo-
mies at the aggregate level (Udoka & Nkamare, 2014). This situation will lead to
a higher trade deficit and will consequently cause a deterioration of the country’s
current account balance (Apere & Ijeoma, 2013). These impacts will also have
further significant, negative effects and serious consequences on the country as a
whole in terms of its impact on all the macro-indicators (employment rate, in-
flation rate, trade balance, stock market prices, and exchange rates).
(Keji, 2018) opines that continuous demand for oil by the most developed na-
tions like the US, Canada, Japan, and others will further deepen the fortunes of oil-
producing countries especially Sub-Saharan African countries. Currently, oil de-
mand growth is highest in developing countries (Aremo et al., 2012). Nonethe-
less, the United States remains the world’s largest oil consumer. According to the
United States Energy Information Agency (EIA), transportation accounts for two-
thirds of oil consumed in the US. The second-largest oil consumer is China. As
of 2011, China’s oil consumption growth rated accounted for half (1/2) percentage
of the global oil consumption growth (EIA, 2011). China’s oil consumption is
distributed between power generation, economic growth, transportation sector
shifts, trade, and refining capabilities. This suggests an oil addiction on the part
of these economies. More than the need for transportation purposes, this addic-
tion is partially explained by their industrial needs. Industrial demand for oil to
produce chemicals, manufacture plastics, and for power generation affects the oil
demand. Most advanced economies are built on a substantial industrial sector and
rely heavily on transportation powered by internal combustible engines; hence,
they have a higher demand for oil than less industrialized economies.
DOI: 10.4236/me.2021.127061 1163 Modern EconomyE. F. Ighosewe et al.
1) Supply Side: The supply for crude oil is divided into two (2) main catego-
ries, OPEC and non-OPEC suppliers. OPEC (Organization of the Petroleum
Exporting Countries) is a permanent, intergovernmental organization, estab-
lished in Baghdad, Iraq, in September 1960. OPEC now comprises twelve (12)
members which include: Venezuela, United Arab Emirates, Qatar, Saudi Arabia,
Nigeria, Libya, Kuwait, Islamic Republic of Iran, Iraq, Ecuador, Angola, and Al-
geria. The Organization has its head office in Vienna, Austria. On the other
hand, the main non-OPEC oil producers are; Russia, the USA, Mexico, China,
Canada, Brazil, and Norway. Oil producers operating outside OPEC are respon-
sible for producing sixty percent of the world’s oil, yet they do not have much
power over oil pricing. This is because non-OPEC oil reserves are only 18.67% of
the global crude oil reserve therefore their current production level is deemed
unsustainable in the long run due to their relatively small reserves and it is ex-
pected to decline sharply in the future.
The (World Bank Report, 2015) sub-divided the supply side of crude oil fluc-
tuation into exogenous and endogenous. While the exogenous factor accounts
for factors outside the oil market, endogenous factors account for factors that
affect the global oil market daily. Notably, these two factors either affect oil pro-
duction positively or negatively.
2) Geopolitical and Other Considerations: Oil prices are always vulnerable to
short-term disruption caused by the weather, strikes, or conflict. Notably, both
the Iranian revolution and the Iran-Iraq War doubled the crude oil prices dwin-
dling. For example, crude oil price amounted to $35 per barrel as of 1981 against
$14 per barrel as of 1978. Since then there have been major effects both in Iran
and other countries like Libya and more recently concerning Yemen.
In Nigeria, experience has shown that adjustment in PMS pump price has
been on the increase (upward trend) from 1970 to date. For example, crude oil
price amounted to 70k per barrel as of 1990 as against 20k per barrel as of 1982.
Meanwhile, from 1992 to 2013, it rose to N97. The fluctuation is further evident
in the drop in oil price from $114 to a price below $50 in 2015; a drop that con-
tinued to $35. To further substantiate this claim, (Ogbonna & Orlu, 2017) sub-
mitted that, the rationale behind the adjustments of the PMS products upwardly
for decades is to eliminate fuel consumption subsidy following the free market
system.
(Akinleye & Ekpo, 2013) argued that it is more cost-effective to import refined
petroleum outside the country than when produced locally since local factories
were serviced by the federal government. According to them, this paradoxical
situation has devalued the Nigerian currency and has also degraded the eco-
nomic outlook of other countries. (Adugbo, 2016) reported that oil revenue
mismanagement is the major reason for importing refined petroleum.
(Ujunwa, 2015) asserts the nature and degree of such an increase will depend
on the structural characteristics of an economy even among the oil-importing
countries. For example, the countries that engage more in the oil trade, rely
DOI: 10.4236/me.2021.127061 1164 Modern EconomyE. F. Ighosewe et al.
heavily on fossil fuels, and/or use the energy intensively in industrial production
are likely to be more exposed to oil price volatility on global commodity mar-
kets. To further substantiate this claim, (Rentschler, 2013) argues that, develop-
ing countries typically have large industrial sectors (which rely on oil as a pro-
duction factor), large fossil fuel shares in their energy mix, and energy-inefficient
technologies—these exposes them to the susceptibility of the negative effects of
volatile oil prices. This implies that, depending on the nature of fluctuation, it
may either contribute positively or negatively to a nation’s economy (Ogbonna
& Appah, 2012). Among the positive contributions is a source of revenue to the
government, transformation, and addition to the balance of payment, increase in
external trade, increase in Gross Domestic Product, source of employment, trans-
fer of technology, provision of internal energy requirements increased income
per capita, and development of the economy say by providing infrastructure,
industry, health facilities, educational supports, transportation and agricultural
development (IMF, 2016; CBN, 2014).
(Usman et al., 2015) argued that Petroleum production and export is instru-
mental to the Nigerian economy since it accounted for about 90% of its gross
earnings. For instance, as of 1st of January, 2009, crude oil and the natural gas
reserve were estimated at 36.2 billion and 182.4 trillion cubic feet (tcf) respec-
tively. Meanwhile, Nigeria was ranked as the 12th biggest oil-producing country
in the world with 2.4 million barrels per day (BPD) or 3.1% of the estimated
world total in 2008. However, (Husan et al., 2015) stated that it is a known fact
that persistent rise in oil price fluctuation over time lead to increased price un-
certainty for all countries irrespective of their trade balance thereby reducing
planning horizons, causing firms to postpone investments, and potentially re-
quiring expensive reallocation of resources. In like manner, the formulation of
robust national budgets becomes more difficult.
(Mustapha & Sulaiman, 2015) noted that the continuous dwindling in oil
price in the global oil market has been a major issue facing oil-producing coun-
tries which in turn has dampened both their revenue generation and develop-
mental process. A case in mind is Nigeria’s economy. The oil price glut globally
has become one of the biggest challenges deterring the Nigerian economy apart
from unrest/insecurity (Akinlo, 2012; Udoh, 2014; Adugbo, 2016).
Globally, evidence reveals that the mineral exporting countries have been
witnessing disappointing economic records. Twelve of the world’s 25, most
mineral dependent states and six of the most oil-dependent countries are classi-
fied as Highly Indebted Poor Countries by the World Bank. When taken as a
group, all “petroleum-rich” less developed countries have witnessed a severe de-
cline in the living standards of their populations and many of them currently
rank in the bottom one-third of the United Nations Human Development Index.
In addition to poor growth records and entrenched poverty, they are characte-
rized by a high level of corruption and a low prevalence of democratization, all
of which act to create high risks of civil war.
DOI: 10.4236/me.2021.127061 1165 Modern EconomyE. F. Ighosewe et al.
2.2. Theoretical Framework
Scholars have used different theories to underpin their studies. However, for
this study, the Dutch Disease Theory, Rent-Seeking Theory, Structural Theory,
and rational expectation theory were used to underpin the study. The Dutch
Disease Theory was formulated to explain the poor economic growth of the
Netherlands following the discovery of North Sea oil. The Dutch Disease Theory
(DDT) discourses when there is a boom of natural resources it results in the
exchange rate of a country to appreciate, the effect of this is that the manufac-
turing export becomes less competitive. (Ismail, 2021) views Dutch disease as
a situation by which the natural resource sector which once experiences boom
experience shrinkage.
The effect of Dutch disease on the economy was divided by (Corden & Neary,
1982) into two effects, specifically, the resource movement effect (RME) and the
spending effect (SPE). The RME causes wage rate increase due to the price in-
crease of a discovered natural resource. This is so because the price increase of
the natural resource increases the value of the marginal product of the value of
the resource. This causes the tradable sectors to shrink possibly in operation,
some of which might perhaps shut down. However, the SPE explains that oil
price revenue will only increase if its price dramatically increases. This increase
will then open the way for an increased importation alongside what is absorbed
domestically concerning items that tradable and non-tradable.
Contextually, the theory states that increased oil prices on a general out-
look can shift the industrial structure of an oil-exporting country. Further, in-
creased oil revenues increase the value of a domestic currency, increase importa-
tion of consumer goods but tend to reduce the competitiveness of the local pro-
ducers.
Furthermore, the rent-seeking theory reinforces the DDT; familiarized by
(Krueger, 1974). According to (Arnason, 2008), rent-seeking is the process of the
disbursements of money and, time beyond the production of real goods and ser-
vices to pushing for alteration in the policies of the Government so that profit
can be maximized. These changes could be in the area of enforcing the use of
certain specialized services, subsidies on certain outputs, etc. This theory, there-
fore, espouses the fact that the politicians enrich themselves via rent-seeking
(Ross, 2001). Structural shocks theory holds that sudden large changes in the
prices of food and oil could be attributed to macroeconomic fluctuations (Som-
mer, 2002). However, there is a sharp disagreement among the structuralist
theorists on the effect of structural shocks. Some argue that in the short run,
supply shocks have a transitory effect on the macro-economy (Ball & Mankiw,
1995; Lee et al., 1995). Some others believe that for the government to address
economic recession, they should not respond to adverse pressures from food and
oil prices since they are highly volatile (Armando, 2009). Instead, they should
focus on “the second-round effect”, which is likely to be more prolonged and
could result in an economic recession (Inflation Report, 2006).
DOI: 10.4236/me.2021.127061 1166 Modern EconomyE. F. Ighosewe et al.
Furthermore, (Fischer, 1985) suggests there is no need for policymakers to
focus on structural shocks at all since there is no provision for real wage resis-
tance payable to employees. Some other structural shocks could be consistent
and are bent in challenges of in-elastic supply in the oil and agricultural sectors
(Pindyck, 1979). In their view, oil, agriculture, foreign trade, and government
sectors suffer from institutional rigidities that cause prices to rise with economic
developments. Hence, they suggested the removal of such institutional inflexibil-
ities as a means through which the adverse effects of such shocks can be curbed.
The above views were opposed by proponents of the rational expectation
theory (Sommer, 2002). They believe that the supply-side of fluctuation is de-
pendent on behavior of expectation (Sommer, 2002). For example, when indi-
viduals believe that the effects of structural shocks will be permanent, that is
what will exactly happen. Again, when individuals believe that the effects of
shocks are only impermanent, economic factors swiftly return to their previous
position (Ujunwa, 2015). This theory essentially influenced the theoretical
framework for this study.
2.3. Empirical Review
Several studies have examined the relationship between oil price fluctuation and
economic growth of different countries both in and outside Nigeria while some
have investigated the relationship on individual countries among Africa’s oil-
producing countries others did a cross-country analysis. However, their findings
are contradictory. For example, (Okonkwo & Ogbonna, 2018) examined the
effect of oil price fluctuations on the Nigerian economy. Dutch disease theory
was used to underpin the study. Variables used include crude oil price, GDP,
exchange rate, unemployment rate, and government expenditure. These data
were gotten from the CBN statistical bulletin and National Bureau of Statistics
(NBS) Annual report from 1997-2015. The study reported a linear (direct) rela-
tionship among crude oil price, Exchange rate, and unemployment rate, and the
Nigerian economy. However, a non-linear (indirect) relationship exists between
government expenditure and the Nigerian economy. Notably, only Crude oil
prices significantly affected the Nigerian economy. Hence, the researchers sug-
gested that the Nigerian government should strive to diversify the Nigerian
economy.
Using the error correction methodology, (Ogbonna & Orlu, 2017) investi-
gated the impact of petroleum price fluctuation on the Nigerian economy from
1970 to 2013. Variables considered include Premium Motor Spirit (PMS) price,
lending interest rate (LIR), labour employment (LEMP), and gross domestic in-
vestment (GDI). The studied data was gotten from the CBN Statistical Bulletin
and the NBS annual report (2013). The study reported that PMS Price variation
exerted a negative insignificant impact on the Nigerian economy. Hence, the
study recommends that the Nigerian government should deregulate PMS pump
price Again, the private sector should be encouraged to participate actively in the
crude oil downstream.
DOI: 10.4236/me.2021.127061 1167 Modern EconomyE. F. Ighosewe et al.
(Zied et al., 2016) examined the degree of interdependence between oil prices
and economic activities of four (4) major (OPEC states from 2000 to 2010.
Countries considered include United Arab Emirates, Saudi Arabia, Kuwait, and
Venezuela. Using the Engle and Granger co-integration test, the study estab-
lished that oil price shock exhibited a long-run stable relationship with the eco-
nomic activities of the countries under investigation.
Employing cointegration and an SVAR model, (Musa, 2015) used quarterly
data to analyze the impact of oil price shocks on the growth of the Nigerian
economy from 1970-2011. The result confirmed that the oil price shock and un-
rest are linked to the Nigerian economy in the long run. Further, oil prices, un-
rest, agricultural output, and exchange rates are strategic in determining the
economic growth of Nigeria. However, the study did not capture how the
economy can respond to the adverse effect of oil price shocks.
(Donwa et al., 2015) did a study on the relationship between oil price volatility
and Nigerian economic growth. The study spanned from 1970-2013 based on
both empirical and conceptual literature review of the works of other research-
ers. Secondary data were sourced from the works of other researchers in addi-
tion to those obtained from relevant government agencies, financial institutions,
and international organizations like the World Bank, United Nations, and Afri-
can development bank among others. The study reported that the Nigerian
economy in the short run due to high global oil prices, but in the long-run
but was inconsistent in the long run due to export concentration. Again, global
oil price variation is the reason why the Nigerian economy seems to be unsta-
ble. The study also found that Nigeria being a mono-product economy has a
special case of Dutch Disease, where a country’s seemingly good fortune proves
ultimately detrimental to her economy. Certain studies seem to portray Nigeria
as suffering from Dutch Disease. (Ijirshar, 2015) posit the importance of oil
revenue on the industrialization of the Nigerian state in the long run irrespec-
tive of the mismanagement of fund. However, this influence is insignificant in
the short run. Also, (Aregbeyen & Kolawole, 2015) applied OLS, vector error
correction (VECM), and granger causality to identify the level of relationship
between oil price and its impact on government spending. The result is in the
affirmative. This result, therefore, seems dangerous to the nation at this time
of high inflation and less need for oil products. It is worthy to note that petro-
leum products are less needed now due to new technological inventions. The
conduct by (Ademola et al., 2015) point to the effect that oil price fluctuation has
on inflation. The findings show that oil price fluctuation impacts significantly on
inflation. Little wonder Nigeria is experiencing hyperinflation at this time.
Using the survey research design, (Ocheni, 2015) discovered that PMS Price
hiking reduces the purchasing power of the Nigerian naira but increased food
security. Again, the researcher traced the slow economic propensity of Nigeria to
oil sector performance to PMS Price hiking.
Using a multivariate analysis, (Amagoh et al., 2014) examined the implica-
tions of PMS variation on some economic fundamentals and discovered that re-
DOI: 10.4236/me.2021.127061 1168 Modern EconomyE. F. Ighosewe et al.
veals that Petroleum Motor Spirit pump prices, automobile gas oil, and dual-
purpose kerosene significantly impacted the Nigerian economy.
(Ani et al., 2014) investigated the effect of crude oil price variation on the Ni-
gerian economic development from 1980-2010. The study revealed that crude oil
price variation does not significantly affect variation in economic growth (GDP)
though both moved linearly. The result agrees with the Dutch Disease theory
submissions.
Similarly, (Alley et al., 2014) appraised oil price shocks and Nigerian econom-
ic growth over the period 1981-2012. The study revealed that oil price shocks
show a negative and inconsequential impact on economic growth, while oil price
itself has a positive yet consequential impact on the Nigerian economy. This
conforms to the conventional wisdom that oil-rich countries benefit from oil
price increase in Nigeria.
Again, (Oyeyemi, 2013) discovered that during the periods of oil price de-
creases disruption effects occurred in the balance of payments and government
finances. Moreover, it was mentioned that even a small shock in global oil prices
will have a long-term effect on the economic growth of the country.
(Salim & Rafiq, 2013) investigated the impact of crude oil price variation on
six (6) well-known growing countries in the Asia continent namely China, In-
donesia, India, Philippines, Malaysia, and Thailand using quarterly oil price vo-
latility reported. Findings suggested that oil price volatility impacts the economic
growth of China only in the short run. However, oil price shock positively af-
fected Indonesia, India, Philippines, Malaysia, and Thailand before and during
the Asian financial crisis.
(Nwosa & Ajibola, 2013) examined the effect of gasoline price on economic
sectors in Nigeria from 1980 to 2010. Specifically, the researchers focused on the
agricultural; manufacturing; transportation and communication, wholesale and
retail, building, and construction sector. The study affirmed that the gasoline
price has a long-run consequential impact only on the building and construction
sector while in the short run; gasoline price has a consequential impact on the
agricultural and the manufacturing sectors.
Using the OLS approach, (Abdul-Rahmoh et al., 2013) discovered that income
from petroleum profit tax has a direct yet significant impact on the Nigerian
economy from 1970 to 2010. However, (Baghebo & Atima, 2013) found that pe-
troleum price shock impact economic growth from 1980 to 2011.
Based on the foregoing, the study hypothesizes.
H01: Fluctuation in Oil Price per Barrel does not significantly affect the Nige-
rian economy;
H02: Petrol Pump Price Fluctuation does not significantly affect the Nigerian
economy;
H03: Diesel Pump Price Fluctuation does not significantly affect the Nigerian
economy;
H04: Kerosene Pump Price Fluctuation does not significantly affect the Nige-
rian economy.
DOI: 10.4236/me.2021.127061 1169 Modern EconomyE. F. Ighosewe et al.
2.4. Summary of Gaps in the Literature/Critics of the Past Studies
Sequel to the foregoing, it is noted mentioning that none of these research works
focused on the appraisal of the boom, burst as well as sharp declines that have
characterized oil price movements over the years. These oil price trends are
germane to the economic growth of oil-producing economies of which Nigeria is
no exception. This is because it disrupts their policy framework each time it oc-
curs and in most cases, they are tackled with wrong policy ideas, which may ag-
gravate the negative impacts of these unique oil price movements on their ma-
croeconomic performance (GDP) during the period. Again, none of the re-
searchers were able to extend the scope of their studies to 2018 since the most
recent scope in the reviewed literature stopped in 2016 (Charfeddine et al., 2018).
Also, to date, findings on the subject matter are still contradictory. In light of
this exposition, this study tries to share more light on the subject matter by ex-
ploring the consequential crude oil fluctuation on the Nigerian economy using a
resource dependence approach.
3. Research Methodology
This section takes into consideration the research design, study population,
sources of data collection, techniques of data analysis, and model specification,
and variable measurement.
3.1. Research Design, Study Population, and Sources of Data
Collection
This paper used the ex post facto research design. Again, we made use of sec-
ondary data (time series) from the CBN statistical bulletin, OPEC, and World
Bank global financial data spanning from 1984-2018 i.e. 35 years. The CBN bul-
letin was gotten from the CBN office in Asaba and NSE Onitsha. Data from
OPEC and World Bank were sourced from their website. The choice of the pe-
riod is driven by the availability of data and that the study period takes into ac-
count for recession and burst period in Nigeria.
The study population of the study is the whole economy of Nigeria and will be
limited to evaluation of the various oil price fluctuation proxies (fluctuation in
oil price per barrel, Petrol pump price fluctuation, Diesel pump price fluctua-
tion, and Kerosene pump price fluctuation) in comparison to economic growth
proxy (real gross domestic product). The choice of these variables is based on
the fact variables are affected by oil fluctuations. The sample size is equivalent to
the study population since the researcher fully utilizes the population.
3.2. Techniques of Data Analysis and Model Specification
This study adopted the Vector Correction Model through the instrumentality of
Econometric Views version 9.0. This technique became amenable for the study
because it enabled the researcher to adequately capture the essence of the work
effectively in addition to its high level of simplicity and global acceptability. The
DOI: 10.4236/me.2021.127061 1170 Modern EconomyE. F. Ighosewe et al.
estimation technique began by affirming the valid descriptive characteristics of
the studied variables in respect to their mean, median, standard deviation, mini-
mum, maximum, Jarque-Bera, and Skewness. Specifically, the study adopts and
modified the empirical model used by (Manasseh et al., 2019; Nwaoha et al.,
2018; Charfeddine et al., 2018). The model was used to examine the impact of oil
price fluctuation on the growth of Nigeria economy and it is specified as:
α 0 + α1FOPB + α 2 PPPF + α 3 DPPF + α 4 KPPF + Ut
RGDPt = (1)
Log ( RGDPt ) =
α 0 + α1 log ( FOPB ) + α 2 log ( PPPF )
(2)
+ α 3 log ( DPPF ) + α 4 log ( KPPF ) + Ut
where:
RGDP = Real Gross Domestic Product;
FOPB = Fluctuation in Oil Price Per Barrel;
PPPF = Petrol Pump Price Fluctuation;
DPPF = Diesel Pump Price Fluctuation;
KPPF = Kerosene Pump Price Fluctuation;
α0 = Intercept;
α1-4 = Coefficient of the Independent variables;
Ut = Error term.
Aprioiri Expectation
Theoretically, the coefficient will take the following outcome:
α1 > 0, α 2 > 0, α 3 > 0, α 4 > 0
Thus, real oil price fluctuation proxies should have a positive effect on real
gross domestic product.
3.3. Variable Measurement
The variables for the study are summed into two (2): Independent and depen-
dent variables. The Independent variable in the study is oil price fluctuation
measured by fluctuation in oil price per barrel, Petrol pump price fluctuation,
Diesel pump price fluctuation, and Kerosene pump price fluctuation) while the
dependent variable in the study is economic growth measured by RGDP. The
choice of these variables is based on the fact variables are affected by oil fluctua-
tions.
They are explained below:
Kerosene Pump Price Fluctuation: This accounts for changes in the average
price by consumers of kerosene on yearly basis. This was used for the study to
measure oil price fluctuations.
Petrol Pump Price fluctuation: This accounts for both the inward or outward
shift in the average price by consumers for premium motor spirit (petrol) on
yearly basis. This was used for the study to measure oil price fluctuations.
Fluctuation in Oil Price per Barrel: This accounts for changes in the annual
average price of oil in US dollar per barrel. This was used for the study to meas-
DOI: 10.4236/me.2021.127061 1171 Modern EconomyE. F. Ighosewe et al.
ure oil price fluctuations.
Economic Growth: We used RGDP to measure economic growth. This is a
macro-economic measure of the monetary value of all economic outputs taking
into account changes in inflation and deflation rate. This is motivated by the fact
that unlike nominal GDP, RGDP takes into cognizance inflation and deflation
which is a prevalent factor that also affects fluctuation in an economy.
4. Data Presentation and Description of Data
This sub-section presents data concerning the relationship between crude oil
price fluctuation and economic growth in Nigeria from 1984 to 2018. The data
extracted represent crude oil price fluctuation proxies (fluctuation in oil price
per barrel, Petrol pump price fluctuation, Diesel pump price fluctuation, and
Kerosene pump price fluctuation) with economic growth proxy (real gross do-
mestic product) extracted from CBN statistical bulletin. For this purpose, the
data are presented in Table 1 under-leaf are described in Table 2, Figure 1 and
Figure 2 under-leaf for ease of discussion of the trends/movement of the va-
riables under study.
4.1. Data Analysis
Data for the study was analyzed using descriptive statistics, trend analysis, cor-
relation analysis, unit root test, and ARDL co-integration test.
4.1.1. Descriptive Statistics
Table 2 below represents the descriptive statistics in the study. The descriptive
statistics presents the numbers of paired observation: mean, median, maximum,
minimum and standard deviation values.
The table above shows a summary of the target variables. In other words, it
clearly revealed display the interaction between the crude oil price fluctuation
and economic performance of Nigeria. Specifically, the numbers of paired ob-
servations denoted by “N” accounted for the study period (1984-2018). Also, Ta-
ble 2 above revealed that real gross domestic product fluctuates by 19,823.87583
with an average value of 35,495.6997 as well as a maximum and minimum value
of 74,694.00 and 13,779.26 respectively. The Oil price per barrel fluctuates by
35.44644 at an average value of 49.8063 with maximum and minimum values es-
timated at 116.88 and 14.14 respectively. Again, petroleum (petrol motor spirit)
pump price fluctuates by 66.30464 with an average value of 52.1843 as well as a
maximum and minimum value of 225.09 and 0.30 respectively. Also, diesel (au-
tomotive gas oil) pump price fluctuate by 66.30464 with an average value of
52.1843 as well as a maximum and minimum value of 225.09 and 0.30 respec-
tively. Moreover, kerosene (bonny light crude oil) pump price fluctuate by
74.47973 with an average value of 51.3426 as well as a maximum and minimum
value of 290.75 and 0.20 respectively. This suggests that kerosene pump price
deviate much away from the mean than other variables.
DOI: 10.4236/me.2021.127061 1172 Modern EconomyE. F. Ighosewe et al.
Table 1. Raw data on crude oil price fluctuations and economic growth proxy.
Real Gross Kerosene
Fluctuation in Diesel Pump Petrol Pump
Domestic Pump Price
Year Oil Price Per Price Fluctua- Price Fluctua-
Product Fluctuation
Barrel (FOPB) tion (DPPF) tion (PPPF)
(RGDP) (KPPF)
1984 13,779.26 15.29 0.3 0.22 0.2
1985 14,953.91 19.32 0.31 0.32 0.25
1986 15,237.99 15.88 0.35 0.39 0.36
1987 15,263.93 19.19 0.4 0.395 0.3
1988 16,215.37 23.33 0.41 0.42 0.31
1989 17,294.68 21.39 0.48 0.6 0.4
1990 19,305.63 20.78 0.5 0.63 0.4
1991 19,199.06 18.73 1 0.7 0.5
1992 19,620.19 17.21 0.53 0.74 0.53
1993 19,927.99 18.25 0.55 3.25 2.75
1994 19,979.12 21.95 3 11.2 6.5
1995 20,353.20 20.64 9 115 6.7
1996 21,177.92 14.14 9.3 11.4 6.2
1997 21,789.10 17.63 9.5 11.5 6
1998 22,332.87 30.04 9.8 11.7 6.9
1999 22,449.41 26.55 9.9 20 17.4
2000 23,688.28 26.45 19 22 17.5
2001 25,267.54 31.07 21 22.4 17.7
2002 28,957.71 40.95 21.4 26 24
2003 31,709.45 57.55 26 40 38.1
2004 35,020.55 68.26 38 49 48.7
2005 37,474.95 78.01 48 65 50
2006 39,995.50 104.83 60 65.3 50.5
2007 42,922.41 68.01 60.5 65.5 50.6
2008 46,012.52 83.14 60.4 65.5 50.7
2009 49,856.10 116.43 60.6 65.6 50.4
2010 54,612.26 116.88 145 65.7 50.8
2011 57,511.04 112.87 145.3 65.9 50.9
2012 59,929.89 102.16 145.4 97 75
2013 63,218.72 107.46 100 97.2 150
2014 67,152.79 96.29 105 97.5 129
2015 69,023.93 49.49 90 87 129.5
2016 67,931.24 40.76 180 145 200
2017 68,490.98 52.51 220.43 145.56 267.14
2018 74,694.00 69.78 225.09 145.92 290.75
Source: CBN Statistical Bulletin and annual reports (1984-2018); World Bank Global development Data
(1984-2018); OPEC Annual Report (1984-2018).
DOI: 10.4236/me.2021.127061 1173 Modern EconomyE. F. Ighosewe et al.
Table 2. Descriptive statistics for all the variables under study.
Selected Variables Minimum Maximum Mean Std. Deviation
RGDP 13,779.26 74,694.00 35,495.6997 19,823.87583
FOPB 14.14 116.88 49.8063 35.44644
PPPF 0.30 225.09 52.1843 66.30464
DPPF 0.22 145.92 46.3299 46.70591
KPPF 0.20 290.75 51.3426 74.47973
OBS 35 35 35 35
Source: Researcher’s Computation using E-views Version 9.0 (2020).
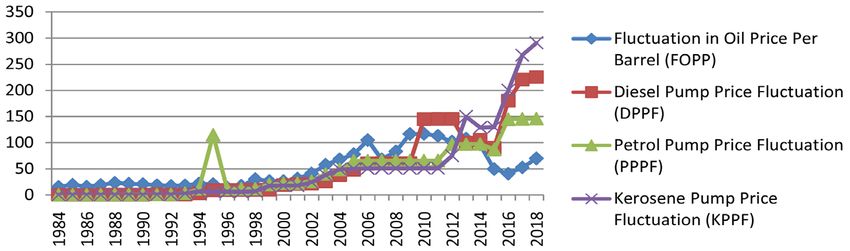
4.1.2. The Trend Analysis
Figure 1 and Figure 2 below show the trend analysis of the various variables
under study over the period of study:
The graphs gave very robust and distinct information on RGDP over the re-
viewed period. The graph revealed a very low-growth trends between the periods
of 1984 to 1990 but thereafter, RGDP grew at a little bit flat rate to 2001 and then
increase arithmetically up to 2016 but in 2007 and 2008, there was a little distor-
tion which appears to reflect the impact of the global financial crises that oc-
curred in most economies of the world at that time. However, later experienced
upward rise from 2009 to 2012 but also experienced an up-ward-downward
slope from 2013 to 2017. Again, the shortfall of 2017 was compensated by an in-
creased RGDP value in 2018.
The graph in Figure 1 above revealed a zigzag movement of oil price per bar-
rel which denotes Fluctuation in the prices of oil per barrel over the period of
study. The graph further revealed that the price of oil per barrel was relatively
Figure 1. Trend analysis of the economic growth proxy (RGDP). Source: Researcher’s
compilation based existing data from 1984-2018.
Figure 2. Trend analysis of crude oil fluctuation proxies. Source: Researcher’s compila-
tion based existing data from 1984-2018.
DOI: 10.4236/me.2021.127061 1174 Modern EconomyE. F. Ighosewe et al.
stable from 1984 to 2005 but was affected by the global financial crises of 2007 to
2008 hence the decrease in both periods respectively. Notably, from 2007 up to
2018, the price of oil price oil per barrel experienced up-downward shift. In ad-
dition, the graph in Figure 2 above also revealed a zigzag movement of Premium
Motor Spirit which indicates the fluctuation in the price of Petrol. The price was
relatively stable from 1984 to 1992 and was at the peak in 1995 and then fell and
continues fluctuating from 1996 till 2018. In like manner, Diesel (Automotive
gas oil) Pump Price also exhibited zigzag movement throughout the period of
study. Meanwhile, the price of Dual Purpose Kerosenein Nigeria indicates fluc-
tuations in the price of Kerosene. The price was relatively stable from 1984 to
1989. It began to rise but was a little bit stable from 2005 to 2011 and then con-
tinue rising from 2012 to 2018.
From the foregoing findings, the contrast in the growth trends of RGDP and
the explanatory variables appear to suggest a non-correlation relationship and
also cast doubts on whether Crude Oil Fluctuation made significant contribu-
tions to RGDP in the period under review. Hence, the study sought to investi-
gate if truly this statement is valid.
4.1.3. Pearson Correlation
Pearson Correlation depicts the strength of linearity among variables under in-
vestigation. From the Pearson Correlation Coefficient Matrix table, it is observed
that the correlation coefficients between RGDP and most of the independent va-
riables are relatively very high suggesting a strong relationship between them.
For example, the correlation coefficient among Real Gross Domestic Product
(RGDP) and Oil Price per Barrel (FOPB), Diesel Pump Price Fluctuation
(PPPF), and Petrol Pump Price Fluctuation (DPPF) stood at 0.801241, 0.889669,
and 0.843803 respectively indicating that the linear relationship between RGDP
and those independent variables are 80.12%, 88.97%, and 84.38% respectively.
More so, the correlation coefficient between RGDP and Kerosene Pump Price
Fluctuation (KPPF) stood at 0.465858 meaning a linear relationship of 46.59% is
also outstanding. On overall, the Pearson Correlation result revealed that crude
oil fluctuation has a positive strong relationship with economic growth over the
study period. However, this result of positive relationship therefore counters the
aprioiri expectation of negative relationship between crude oil fluctuation and
economic growth (Table 3).
Table 3. Pearson correlation coefficient matrix of variables.
RGDP FOPB DPPF PPPF KPPF
RGDP 1.000000
FOPB 0.801241 1.000000
DPPF 0.889669 0.626324 1.000000
PPPF 0.843803 0.670734 0.679758 1.000000
KPPF 0.465858 0.171245 0.586757 0.366994 1.000000
Source: Researcher’s computation using e-views version 9.0 (2020).
DOI: 10.4236/me.2021.127061 1175 Modern EconomyE. F. Ighosewe et al.
4.1.4. Unit Root Test
Originally, economic data are assumed to possess some form of stationarity.
However, it is paramount to ascertain if the statement is true in all respects. In
doing this, we used the Augmented Dicker Fuller Test to check whether the data
series are stationary (both at levels and first difference) or not. Hence, to check
whether a particular data series attain stationarity, we compared the ADF test
statistics with the MacKinnon critical value. Wherein the ADF statistics is great-
er than the critical values, the decision rule is to reject the null hypothesis of the
presence of unit root and accept the alternative hypothesis which assume that
the data series possess stationary and vice versa. The ADF test is presented
below:
Table 4 above clearly revealed that all the study variables except real gross
domestic product possess unit root at their natural levels. This is because, at their
natural levels, their respective ADF test statistics were less than their MacKinnon
critical values at 5% significant level. Again, their respective p-values were also
greater 5% significant level. For example, the ADF test statistics for Oil Price per
Barrel (FOPB), Diesel Pump Price Fluctuation (PPPF), Kerosene Pump Price
Fluctuation (KPPF), and Petrol Pump Price Fluctuation (DPPF) stood at
Table 4. Unit root test for all study variables.
AT LEVELS
MacKinnon
Study ADF Test Order of
Critical Value P-value Conclusion
Variables Statistics Integration
@ 5% level
LOG(RGDP) −3.469531 −2.954021 0.0154 1(0) Stationary
Presence of
LOG(FOPB) −1.236435 −2.951125 0.6470 1(0)
Unit Root
Presence of
LOG(DPPF) −0.937740 −2.951125 0.7637 1(0)
Unit Root
Presence of
LOG(KPPF) −0.992247 −2.951125 0.7449 1(0)
Unit Root
LOG(PPPF) −1.601072 −2.951125 0.4711 1(0)
AT FIRST DIFFERENCE
MacKinnon
Study ADF Test Order of
Critical Value P-value Conclusion
Variables Statistics Integration
@ 5% level
LOG(RGDP) −6.683186 −2.957110 0.0000 1(1) Stationary
LOG(FOPB) −4.913071 −2.957110 0.0004 1(1) Stationary
LOG(DPPF) −5.261112 −2.954021 0.0001 1(1) Stationary
LOG(KPPF) −4.687622 −2.954021 0.0007 1(1) Stationary
LOG(PPPF) −6.157853 −2.954021 0.0000 1(1) Stationary
Source: Researcher’s computation based on e-views 9.0 (2020).
DOI: 10.4236/me.2021.127061 1176 Modern EconomyE. F. Ighosewe et al.
1.236435, −0.937740, −0.992247, and −1.601072. Meanwhile their respective
MacKinnon critical values are −2.951125, −2.951125, −2.951125, and −2.951125
respectively. However, when subjected to further testing, Oil Price per Barrel
(FOBP), Diesel Pump Price Fluctuation (PPPF), Kerosene Pump Price Fluctua-
tion (KPPF), and Petrol Pump Price Fluctuation (DPPF)attained stationarity at
first difference as evidenced by their respective high ADF test Statistics, low
MacKinnon critical values, and low p-values. Hence, it is therefore imperative to
check for the long run relationship among the study variables.
4.1.5. ARDL Bound Cointegration Test
Since all the study variables attained stationary both at their natural levels and
first difference, the Auto-regressive Distributed Lag model is deemed fit for the
study. The result is present below:
The cointegration result in Table 5 above clearly revealed that there is long-
run statistical relationship between crude oil fluctuation proxies and economic
performance of Nigeria throughout the period of study. This is because the cal-
culated F-statistic value estimated at 4.050202 is greater than the critical bound
value estimated at 4.01. To ensure that the model is robust, we subjected the
model to diagnostic test before proceeding to the main result. The results are
therefore presented in Table 6, Table 7 below:
The Heteroskedasticity test in Table 6 above reported that the p-value of the
f-statistics is greater than 5% significance level. Hence, we rejected the null hy-
pothesis of presence of Heteroskedasticity and accepted the alternative hypothe-
sis of homoskedasticity (equal variance). As such, we concluded that the model
is Homoskedastic. This further reaffirmed the classical OLS assumption of ho-
moskedasticity (equal variance).
The Ramsey RESET Test in Table 7 above revealed that none of the variables
are omitted and that the model is correctly specified. As such, the model can be
depended upon for statistical inferences.
Table 5. ARDL bound co-integration test.
Sample: 1986-2018
Included observations: 33
Null Hypothesis: No long-run relationships exist
Test Statistic Value K
F-statistic 4.050202 4
Critical Value Bounds
Significance I0 Bound I1 Bound
10% 2.45 3.52
5% 2.86 4.01
2.5% 3.25 4.49
1% 3.74 5.06
Source: Researcher’s computation based on e-views 9.0 (2020).
DOI: 10.4236/me.2021.127061 1177 Modern EconomyE. F. Ighosewe et al.
Table 6. Heteroskedasticity test: Breusch-Pagan-Godfrey.
F-statistic 1.033226 Prob. F (4,29) 0.4069
Obs*R-squared 4.241063 Prob. Chi-Square (4) 0.3744
Scaled explained SS 3.372664 Prob. Chi-Square (4) 0.4975
Source: Researcher’s computation based on e-views 9.0 (2020).
Table 7. Ramsey reset test.
Equation: UNTITLED
Specification: LOG(RGDP) C LOG(FOPB) LOG(DPPF) LOG(KPPF) LOG(PPPF)
Omitted Variables: Squares of fitted values
Value Df Probability
t-statistic 0.151596 26 0.8807
F-statistic 0.022981 (1, 26) 0.8807
Likelihood ratio 0.010181 1 0.9196
F-test summary:
Sum of Sq. Df Mean Squares
Test SSR 2.59E−05 1 2.59E−05
Restricted SSR 0.029300 27 0.001085
Unrestricted SSR 0.029275 26 0.001126
Source: Researcher’s computation based on e-views 9.0 (2020).
4.2. Regression Result
This section covers both the ARDL Cointegrating (short run) and long run
analysis. The result is presented below:
4.3. Discussions/Managerial Implications
From Table 8 above, Fluctuation in Oil Price per Barrel (FOPB), with t-test
coefficients of 4.194789 passed the test of significance at 5% significant level is
showing that they are relevant in formulating policies that affect RGDP on the
short run. However, the t-test coefficient of some other independent variables
such as Diesel Pump Price Fluctuation (PPPF) standing at −0.775452; Kerosene
Pump Price Fluctuation (KPPF) standing at −0.339885; and Petrol Pump Price
Fluctuation (DPPF) standing at −1.303260 were not relevant in formulating pol-
icies because their coefficients exhibit weak relationship with RGDP.
That-not-withstanding, the negative sign of Diesel Pump Price Fluctuation
(PPPF), Kerosene Pump Price Fluctuation (KPPF), and Petrol Pump Price Fluc-
tuation (DPPF) conformed to apriori expectation of the study while the rest in-
dependent variable counters the apriori expectation of the study. This means
that Diesel Pump Price Fluctuation (PPPF), Kerosene Pump Price Fluctuation
(KPPF), and Petrol Pump Price Fluctuation (DPPF) which ought to contribute
to decrease in RGDP in Nigeria as an oil endowed nation is contributing to
DOI: 10.4236/me.2021.127061 1178 Modern EconomyE. F. Ighosewe et al.
Table 8. ARDL cointegrating and long run form.
Dependent Variable: LOG(RGDP)
Selected Model: ARDL(1, 0, 0, 1, 0)
Date: 09/20/20 Time: 15:58
Sample: 1984 2018
Included observations: 34
Cointegrating Form
Variable Coefficient Std. Error t-Statistic Prob.
DLOG(FOPB) 0.056193 0.013396 4.194789 0.0003*
DLOG(DPPF) −0.012896 0.016630 −0.775452 0.4448
DLOG(KPPF) −0.005623 0.016543 −0.339885 0.7366
DLOG(PPPF) −0.014854 0.011398 −1.303260 0.2035
CointEq(−1) −0.088586 0.028614 −3.095876 0.0045
= LOG ( RGDP ) − ( 0.6343 ∗ LOG ( FOPP ) − 0.1456 ∗ LOG ( DPPF )
Cointeq
+ 0.3763 ∗ LOG ( KPPF ) − 0.1677 ∗ LOG ( PPPF ) + 8.5113)
Long Run Coefficients
Variable Coefficient Std. Error t-Statistic Prob.
LOG(FOPB) 0.634337 0.213285 2.974132 0.0061*
LOG(DPPF) −0.145577 0.204172 −0.713011 0.4820
LOG(KPPF) 0.376277 0.182731 2.059188 0.0492*
LOG(PPPF) −0.167683 0.114188 −1.468484 0.1535
C 8.511334 0.535987 15.879727 0.0000
R-squared 0.997767 Mean dependent var 10.35214
Adjusted R-squared 0.997271 S.D. dependent var 0.540126
S.E. of regression 0.028218 Akaike info criterion −4.116476
Sum squared resid 0.021499 Schwarz criterion −3.802225
Log likelihood 76.98009 Hannan-Quinn criter. −4.009308
F-statistic 2010.623 Durbin-Watson stat 1.726509
Prob(F-statistic) 0.000000
Source: Researcher’s computation based on e-views 9.0 (2020). *Significant P values.
increase in RGDP in Nigeria. The policy implication of this result is that a unit
rise in Diesel Pump Price Fluctuation (PPPF), Kerosene Pump Price Fluctuation
(KPPF), and Petrol Pump Price Fluctuation (DPPF) will lead to a corresponding
decrease of 1.29%, 0.56%, and 1.49% in economic progress. However, its impact
on the Nigerian economy tends to be minimal (insignificant). Again, a unit rise
in Fluctuation in Oil Price per Barrelleads to a corresponding rise of about
5.62% in economic progress. This is not farfetched in that a cursory look at the
data presented in Table 8 above revealed an upward rise in those variables.
DOI: 10.4236/me.2021.127061 1179 Modern EconomyE. F. Ighosewe et al.
Hence, the positive report.
The long run result clearly revealed that only Fluctuation in Oil Price per
Barrel and Kerosene Pump Price Fluctuation (KPPF) passed the test of signific-
ance. Also, both variables were positive. Meanwhile, Diesel Pump Price Fluctua-
tion (PPPF), and Petrol Pump Price Fluctuation (DPPF) have negative insignifi-
cant impacts on economic progress.
Furthermore, the short run dynamics revealed that the model is rightly signed
since the coefficient of the Cointegrating equation is less than 1, negative, and is
statistically significant. This indicates that the variables converge after short run
disequilibrium. Result indicates that 8.86% of past deviation is corrected in the
current period. In the same vein, the F-statistics indicates that on the overall
crude oil price fluctuation has significant on economic performance of Nigeria.
Also, the R-squared (coefficient of determination) being the square root of the
coefficient of correlation (R) above shows that 99.78% of the total variation in
the RGDP is elucidated by crude oil fluctuation. To further buttress this, the
Adjusted R-Square which gives more explanation of the explanatory power of
the model revealed that 99.73% of the total variation in (RGDP) is explained by
all crude oil fluctuation proxies under study while the remaining significant val-
ue of 0.27% is attributed to other factors which affect crude oil price fluctuation
not captured in the study but was captured by the error term. This suggests that
the model retains its optimal Best Linear Unbiased Estimate (BLUE) property.
Lastly, the model is free from serial autocorrelation given that the Durbin
Watson Statistics (approximately 2) is within the acceptable bound. Notably,
despite the difference in study approach, the finding of this study agrees with the
findings of (Okonkwo & Ogbonna, 2018; Nwaoha et al., 2018; Musa, 2015;
Donwa et al., 2015). These studies observed that petroleum pump price increase
have statistical significant impact on economic growth in Nigeria. However, the
finding of this study contradicts with the findings of (Charfeddine et al., 2018).
5. Conclusion and Recommendations
The conclusion reached from this study is that on the overall, crude oil fluctua-
tion vis-à-vis Fluctuation in Oil Price per Barrel (FOBP), Diesel Pump Price
Fluctuations (PPPF), Petrol Pump Price Fluctuations (DPPF), and Kerosene
Pump Price Fluctuation (KPPF) exert positive and significant effects on eco-
nomic performance of Nigeria. Particularly, the t-statistics revealed that only
Fluctuation in Oil Price per Barrel (FOBP), exert positive and significant effects
on economic growth in the short run while in the long run both Fluctuation in
Oil Price per Barrel (FOBP) and Kerosene Pump Price Fluctuation (KPPF) im-
prove the Nigerian economy significantly. Hence we conclude that, if Nigerian
economy must grow it should examine the crude oil fluctuation proxies jointly.
In line with the findings of the study, we hereby recommend the following: Ni-
gerian government should ensure that individuals should not interfere over the
apex bank surveillance over the excess crude account; The federal government
DOI: 10.4236/me.2021.127061 1180 Modern EconomyYou can also read