Current Developments in Green Finance
←
→
Page content transcription
If your browser does not render page correctly, please read the page content below
Current Developments in Green Finance

                                                     Lena Liebich*)
                                                   (University of Bonn)
                                                         Lukas Nöh**)
                                                    Felix Rutkowski**)
                                                 Milena Schwarz**)
                                        (German Council of Economic Experts)

                                                Working Paper 05/2020***)
                                                    September 2020

*) University of Bonn, E-Mail: liebich.lena@gmail.com.
**) Staff of the German Council of Economic Experts, E-Mail: lukas.noeh@svr-wirtschaft.de, felix.rutkowski@svr-wirtschaft.de,
milena.schwarz@svr-wirtschaft.de, Gustav-Stresemann-Ring 11, 65189 Wiesbaden.

***) Working papers reflect the personal views of the authors and not necessarily those of the German Council of Economic Ex-
perts.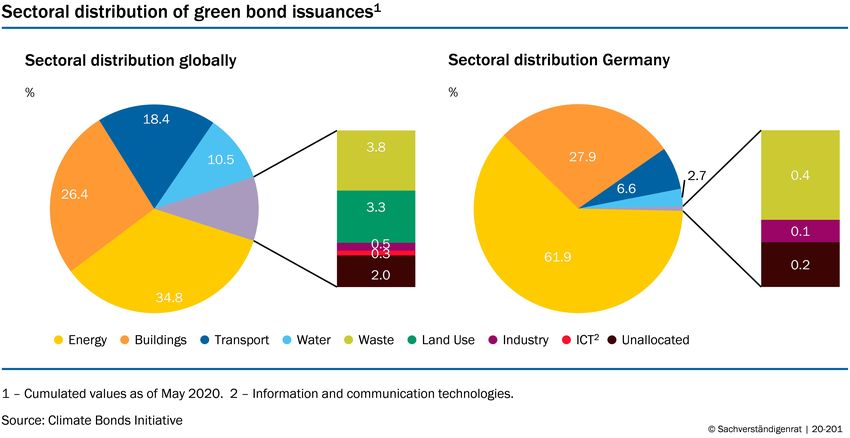
CURRENT DEVELOPMENTS IN GREEN FINANCE

               Lena Liebich, Lukas Nöh, Felix Rutkowski and Milena Schwarz∗

                                          September 8, 2020

                                               Abstract

The transformation of economies towards significantly reduced CO2 consumption raises high
investment and capital requirements. Financial and capital markets can help to mobilize the
necessary funds for global investment needs and to steer capital towards sustainable investments.
Moreover, potential disruptive impacts of climate change on the financial system have started to
become more apparent recently and require central banks, regulators and supervisors to take a
conscious look at the risks and opportunities of climate change for financial intermediaries and
markets. This article offers a comprehensive discussion on how green finance has been evolving
thus far and explores the opportunities and key developments ahead with particular emphasis
on four selected highly topical issues: 1) the introduction of German green government bonds,
2) obstacles to the correct pricing of climate-related risks, 3) the EU taxonomy that has recently
been put forward to develop a uniform classification of sustainable economic activities as well
as 4) the role of central banks in fostering the transition to a low-carbon economy.

    ∗
      Liebich:   liebich.lena@gmail.com; University of Bonn, Regina-Pacis-Weg 3, 53113 Bonn; Nöh:
lukas.noeh@svr-wirtschaft.de; Rutkowski: felix.rutkowski@svr-wirtschaft.de; Schwarz: milena.schwarz@svr-
wirtschaft.de, Staff of the German Council of Economic Experts, Gustav-Stresemann-Ring 11, 65189 Wiesbaden.
This paper reflects the personal views of the authors and not necessarily those of the University of Bonn or
the German Council of Economic Experts. Lena Liebich contributed to this paper during her internship at the
German Council of Economic Experts. We thank S&P Global Ratings, Fitch Ratings, Moody’s as well as the
German Finance Agency for informative talks in preparation of this paper. Further we would like to thank the
members of the German Council of Economic Experts, especially Veronika Grimm, and our scientific staff col-
leagues Kai Brückerhoff and Jens Herold for their comments and efforts towards improving our manuscript and
Marcel Brambeer for his research support.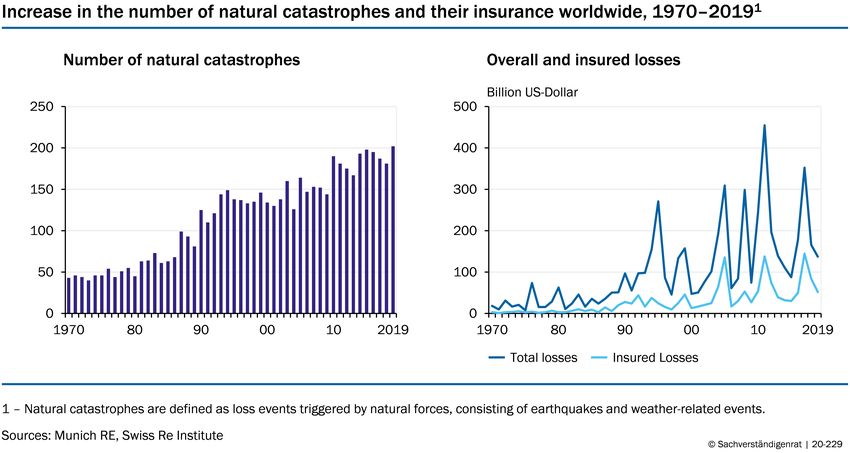
Contents
1 Introduction                                                                                      2

2 The Green Finance Market: An Overview                                                             3
  2.1   Increasing Relevance of Green Finance . . . . . . . . . . . . . . . . . . . . . . . .       3
        2.1.1   What is Green Finance? . . . . . . . . . . . . . . . . . . . . . . . . . . . .      3
        2.1.2   Increasing Demand for Green Capital . . . . . . . . . . . . . . . . . . . .         4
  2.2   Markets for Green Financial Assets . . . . . . . . . . . . . . . . . . . . . . . . . .      6
        2.2.1   Institutional and Retail Investors . . . . . . . . . . . . . . . . . . . . . . .    6
        2.2.2   Screening Criteria . . . . . . . . . . . . . . . . . . . . . . . . . . . . . . .    7
        2.2.3   Financial Market Performance . . . . . . . . . . . . . . . . . . . . . . . .        7
        2.2.4   Green Bonds . . . . . . . . . . . . . . . . . . . . . . . . . . . . . . . . . .     9
        2.2.5   Green Sovereign Bonds . . . . . . . . . . . . . . . . . . . . . . . . . . . .      11
        2.2.6   Green Corporate Bonds . . . . . . . . . . . . . . . . . . . . . . . . . . . .      13

3 Risks Related to Climate Change                                                                  14
  3.1   On the Nature of Climate Risks . . . . . . . . . . . . . . . . . . . . . . . . . . . .     14
  3.2   Climate-related Risks in Credit Ratings . . . . . . . . . . . . . . . . . . . . . . .      19
  3.3   Obstacles to the Correct Pricing of Climate-related Risks . . . . . . . . . . . . .        23

4 Regulatory Reforms at the European Level                                                         24
  4.1   Action Plan on Sustainable Finance and Reforms to Legislation . . . . . . . . . .          24
  4.2   Progress on the Taxonomy for Sustainable Economic Activities . . . . . . . . . .           26
  4.3   Discussion on a Green Bond Standard and Changes to Sector Specific Regulation              28

5 Central Banks and Climate Change                                                                 30
  5.1   Central Banks, Monetary Policy and Climate Risks . . . . . . . . . . . . . . . . .         30
  5.2   Central Bank Tools for Climate Change Mitigation . . . . . . . . . . . . . . . . .         31
  5.3   Analysis: Selection Criteria and Emission Intensity of Asset Purchases under the
        Corporate Sector Purchase Programme (CSPP) . . . . . . . . . . . . . . . . . . .           33
        5.3.1   Selection Criteria and CSPP-eligibility . . . . . . . . . . . . . . . . . . . .    34
        5.3.2   The Sectoral Distribution of ECB’s CSPP-holdings . . . . . . . . . . . . .         36
        5.3.3   Should CSPP Purchases Become Greener? . . . . . . . . . . . . . . . . . .          38

6 References                                                                                       39

                                                 1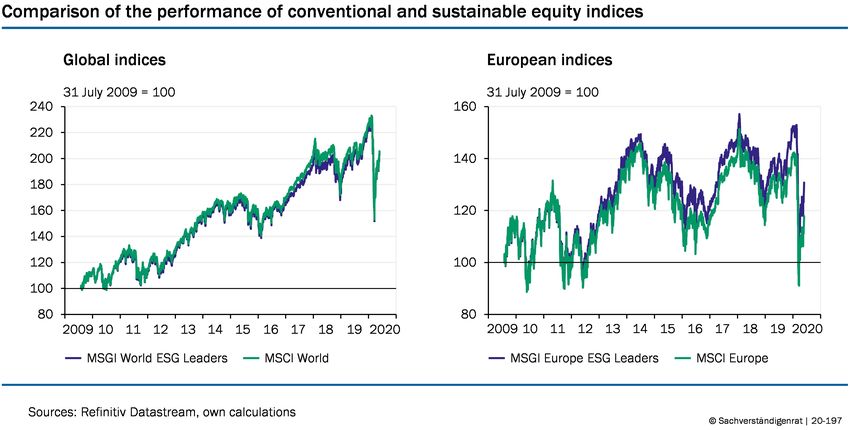
1    Introduction
There is broad consensus on the need for decisive policy action on climate change. Climate
change, induced by concentration of greenhouse gases in the atmosphere due to human activity,
is likely to bring about substantial changes for societies and economies. It increases the likeli-
hood of more extreme weather events and induces a surge in global average temperature relative
to pre-industrial levels. Signatories to the Paris Agreement pledged to reduce greenhouse gas
emissions in order to keep the increase in the global average temperature to well below 2◦ C
compared to pre-industrial levels, ideally limiting the increase in temperature to no more than
1.5◦ C. Policymakers face a variety of options for curbing net carbon emissions, as well as for
avoiding them in the first place. Measures range from imposing bans or requirements regarding
the technologies to be used, to a CO2 tax or trading system for CO2 allowances (Deutsche
Bundesbank, 2019a).

    Financial markets are related to climate change in two respects. First, financial markets are
affected through physical and transition risks. Extreme weather events and climatic changes as
well as the sustainable restructuring of the economic system can cause companies to run into
difficulties and change their economic basis. The resulting lower profitability as well as devalua-
tions of assets affect financial markets. Second, financial markets are needed to finance climate
protection. Both governments and companies are increasingly investing in green projects. To
achieve the 2◦ C objective of the Paris Agreement with a probability of 66%, the OECD (2017)
estimates the annual global infrastructure investment requirement for the next fifteen years at
6.9 trillion US Dollar. Green equity and green bonds will have to make an important contribu-
tion to these investments. This also generates opportunities to actively meet potential financial
stability risks with suitable adaptation strategies. Central banks and financial supervisory au-
thorities have joined in the Network for Greening the Financial System (NGFS) to support the
sustainable orientation of the financial markets and promote it within their mandates.

    The reflections on the relationship between climate change and the financial system are still
in their early stages. Only recently potential disruptive impacts of climate change on the finan-
cial system have started to become more apparent, and the risks and opportunities of climate
change for financial markets have been discussed more prominently (Bolton et al., 2020; Ch-
enet, 2019; ESRB, 2020). This paper offers a comprehensive discussion on how green finance
has been developing thus far and explores the opportunities and key developments ahead with
particular emphasis on four selected highly topical issues: First, green sovereign bonds. This
fast-growing segment is now being expanded by German green government bonds in the form
of twin bonds. This new type of government bonds aims to establish a new benchmark for the
green bond market, but it could deter particularly sustainability-conscious investors. A second
point that we are particularly interested in is the risk assessment of green assets. The literature
increasingly indicates that the physical and transition risks are not adequately priced by market
participants (Bolton et al., 2020; Carney, 2015; ESRB, 2020; Krogstrup & Oman, 2019; NGFS,
2018). This type of market failure influences, for example, investment decisions and calls for
new approaches by rating agencies. Third, important for the further development of the green

                                                2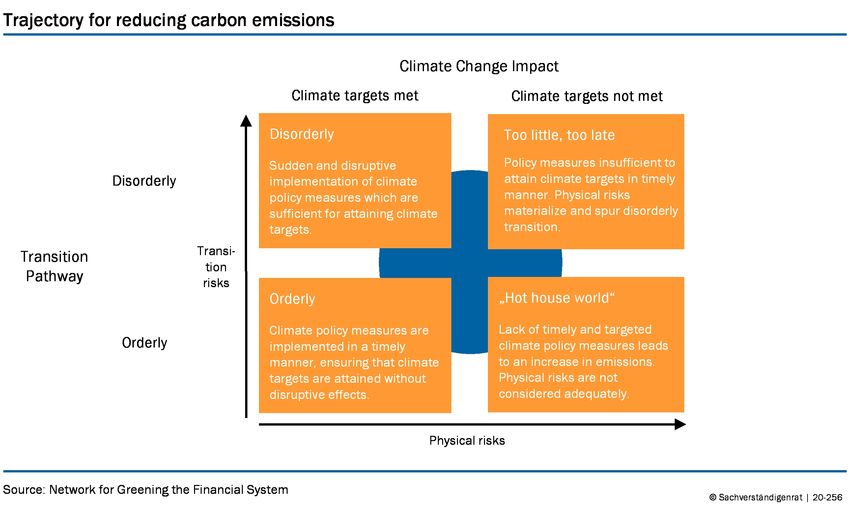
financial market is a uniform definition of green financial products. We discuss the importance
of the taxonomy that the EU has recently put forward for this purpose. The role of central
banks in fostering the transition to a low-carbon economy has been recently getting increased
attention. The Governing Council of the European Central Bank (ECB) has launched a review
of its monetary policy strategy in January 2020. As part of this strategy review, the ECB has
declared to determine how the issue of climate change can actually have an impact on their
policies. Against this background, the fourth selected issue is a possible carbon bias in the
ECB’s corporate bond purchases. While some analyses show a distortion of purchases in favour
of companies with high CO2 emissions, our analysis cannot detect a systematic distortion when
taking into account the criteria defined by the ECB itself.

    The remainder of the paper is organized as follows: Chapter 2 gives an overview of the
relevance and the development of green finance markets. In chapter 3 we focus on climate risks
and the role of credit ratings. Chapter 4 discusses the regulatory reforms at the European level
and in Chapter 5 we discuss the role of central banks and analyse the ECB Corporate Sector
Purchase Programme for a possible carbon bias.

2     The Green Finance Market: An Overview
2.1     Increasing Relevance of Green Finance
2.1.1    What is Green Finance?

The lack of a common definition of the term “sustainability” gives rise to different kinds of cate-
gories of socially responsible and sustainable finance (Chart 1). Institutional investors engage in
Socially Responsible Investment (SRI) by publicly committing to the incorporation of sustain-
ability criteria into their investment decisions (PRI, 2020b). However, the mere announcement
that a company or institutional investors commits to SRI does not allow to infer the extent to
which concrete sustainability requirements are considered in the decision-making process at the
level of individual portfolios or securities. As an institutional example for investors’ growing
awareness of sustainability in finance, the UN Principles for Responsible Investment (UN PRI)
consist of six guidelines for the incorporation of ESG-criteria (Environmental, Social, Gover-
nance) into investment decisions. The UN PRI were signed by approximately 3,000 institutional
investors that together manage assets worth more than 90 trillion US-Dollar (PRI, 2020b). Eval-
uating ESG-criteria allows investors to assess the sustainability of a company’s business model,
e.g. by shedding light on the energy efficiency of production processes (E), institutional policies
promoting gender equality (S) or compliance policies (G).

    While Socially Responsible Investment represents a rather unspecific commitment of in-
vestors to include sustainability criteria into their investment strategies, Sustainable Finance
demands the attainment of concrete ESG-thresholds at the level of issuers, portfolios or secu-
rities. The funding raised by sustainable bonds or other forms of sustainable debt must be
invested in projects that positively contribute to projects in the three ESG-areas, e.g. wind
parks or social housing.

                                                3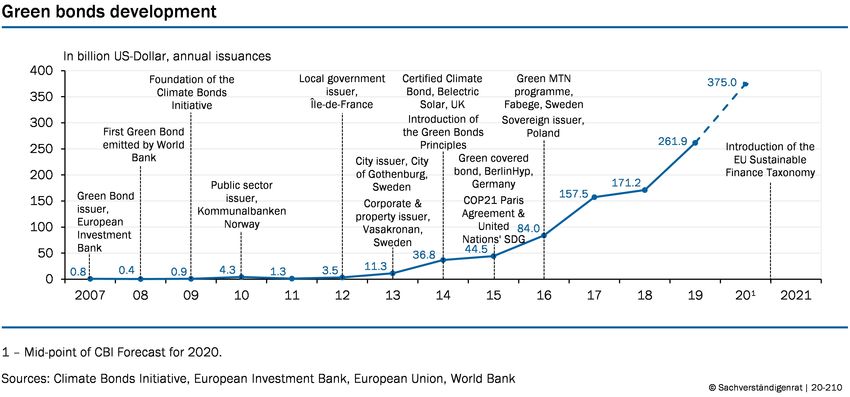
Figure 1

   Financial instruments or investments that are considered under the term “Green Finance”
distinguish themselves as a sub-category of Sustainable Finance through their exclusive focus on
environmental criteria (Deutsche Bundesbank, 2019b). There are plenty of definitions aiming at
characterizing the purpose and role of “Green Finance” in the transition to a low-carbon econ-
omy. The OECD (2020) characterizes Green Finance as a means of fostering economic growth
while reducing negative externalities in form of pollution, greenhouse gas emissions, or waste by
promoting resource and energy efficiency. Private investments are seen as crucial. In the case of
green bonds or other forms of green debt, Green Finance encompasses investments in projects
or securities whose proceeds are used for climate change mitigation and adaptation as well as
other environmental projects. “Climate Finance” as a subsector of Green Finance comprises in-
vestments and projects related to climate change mitigation and adaptation, while “Low-carbon
Finance” focuses solely on investments related to climate change mitigation (Forstater & Zhang,
2016).

2.1.2    Increasing Demand for Green Capital

Demand for socially responsible investments has significantly increased over the last years and
continues to grow at a fast pace. The number of institutional investors publicly committing
to the UN PRI principles has increased by 71% over the last five years, resulting in a surge
of 46% of assets under management aligned with the UN PRI principles (Chart 2, Left). The
transformation towards a financial system that directs capital flows towards investments that

                                               4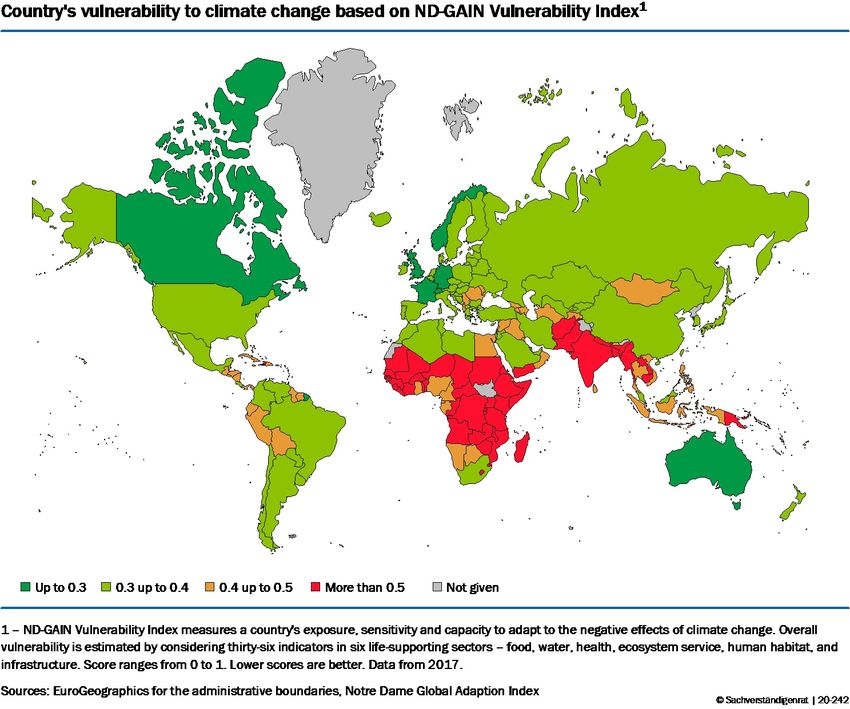
foster the transition to a low-carbon, resource-efficient global economy has been primarily driven
by the Paris Agreement on Climate Change (2015a) and the UN 2030 Agenda for Sustainable
Development (2015b) as well as the Sustainable Development Goals defined there.

Figure 2

   In the first legally binding global climate agreement, the 195 sovereign signatories of the
Paris Agreement (including the European Union) commit to restricting the rise in global aver-
age temperature to well below 2◦ C compared to pre-industrial levels while pursuing to limit the
increase to no more than 1.5◦ C compared to pre-industrial levels. The Paris Agreement explic-
itly underscores the role of the financial system in climate change mitigation and adaptation by
demanding that financial flows should be aligned with a “pathway towards low greenhouse gas
emissions and climate-resilient development” (UN, 2015a). The global transition to sustainable
long-term economic growth requires significant infrastructure investments from governments,
the private sector and other actors. Assuming a 66% chance of meeting the mitigation objective
of limiting the rise in global average temperature to 2◦ C, OECD (2017) estimations suggest an
annual global investment need of 6.9 trillion US-Dollar over the next fifteen years. Infrastructure
investments would primarily foster the transition to a low-emission, resource-efficient pathway
of the transportation and energy sector and would be mainly targeted at developing countries
(OECD, 2017).

   Another landmark in the global transition towards a sustainable society and economy is
given by the UN Sustainable Development Goals (SDGs) (2015b). The SDGs focus on global
sustainable development as defined by 17 concrete social, economic and environmental goals
that shall be achieved by 2030. Environmental goals encompass clean water and sanitation,
affordable and clean energy (incl. renewable forms of energy), as well as actions to mitigate
and adapt to climate change in accordance with the Paris Agreement. There are various at-
tempts at calculating the investment need resulting from the implementation of the UN SDGs.

                                                5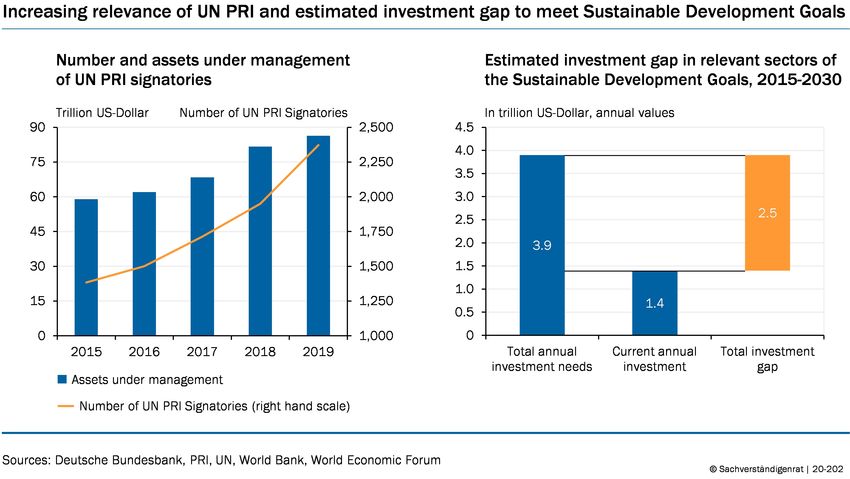
According to the UNCTAD World Investment Report (2014), attaining the SDGs by 2030 will
result in an annual global investment need of 5-7 trillion US-Dollar of which 3.3–4.5 trillion
US-Dollar are allotted to developing countries (Chart 2, Right). Based on a mid-point estimate
of an investment need of 3.9 trillion US-Dollar and current annual investments of 1.4 trillion
US-Dollar, the World Bank estimates an annual total investment gap related to SDG-relevant
sectors of approximately 2.5. trillion US-Dollar for developing countries (Doumbia & Lauridsen,
2019). Investment needs are particularly large when it comes to transforming the infrastructure
associated with a sustainable low-carbon economy. World Bank estimates suggest that 630-950
billion US-Dollar are needed to adjust existing power infrastructures, followed by 550-850 bil-
lion US-dollar for climate change mitigation as well as 350-770 billion US-dollar for transport
systems (Doumbia & Lauridsen, 2019).

   Gaspar et al. (2019) estimate additional financing needs in five SDG-core areas on country-
level in 2030 that would be necessary in order to successfully attain the SDGs within the given
time frame. Financing needs seem to vary significantly between emerging market economies
(2.1 trillion US-Dollar additional spending needed, 4 percentage points of projected GDP) and
low-income developing countries (0.5 trillion US-Dollar) in which additional financing needs in
2030 may make up as much as 15 percentage points of projected GDP in 2030. According to
Gaspar et al. (2019), the largest financing need will emerge in the Asia-Pacific region (1.5% of
2030 world GDP), followed by Sub-Saharan Africa (0.4%). The authors stress the importance
of private investments, foreign financial aid and funding by international financial institutions
for developing countries with high levels of public debt (Chapter 3.1).

2.2      Markets for Green Financial Assets
2.2.1     Institutional and Retail Investors

The transformation of an economy towards drastically reduced CO2 consumption raises high
investment and capital requirements. Financial and capital markets can help to mobilize the
necessary funds for global investment needs within the framework of international climate pol-
icy and to steer capital towards sustainable investments. The markets for green financial assets
have been developing increasingly for several years. With regard to the market for green bonds,
various types of investors have been responsible for an increasing demand over the last few years.
Institutional investors – both conventional and ESG-focused – make up a significant part, along
with corporate treasury departments, sovereign and municipal governments and retail investors
(Climate Bonds Initiative, 2014). The oversubscription of most green bond issues points to
high demand. With a share of 75% in 2018, institutional investors dominate the global market
for sustainable investments under professional management, which has an amount of 30.7 tril-
lion US-Dollar. However, retail investments – individual investments in professionally managed
funds – have been growing at a fast pace. Making up only 11% in 2012, they accounted for a
quarter of all professionally managed assets aligned with sustainable investment in 2018 (GSIA,
2018).

   In Germany, the market for sustainable assets has a volume of 269,3 billion Euro. Specialised

                                                6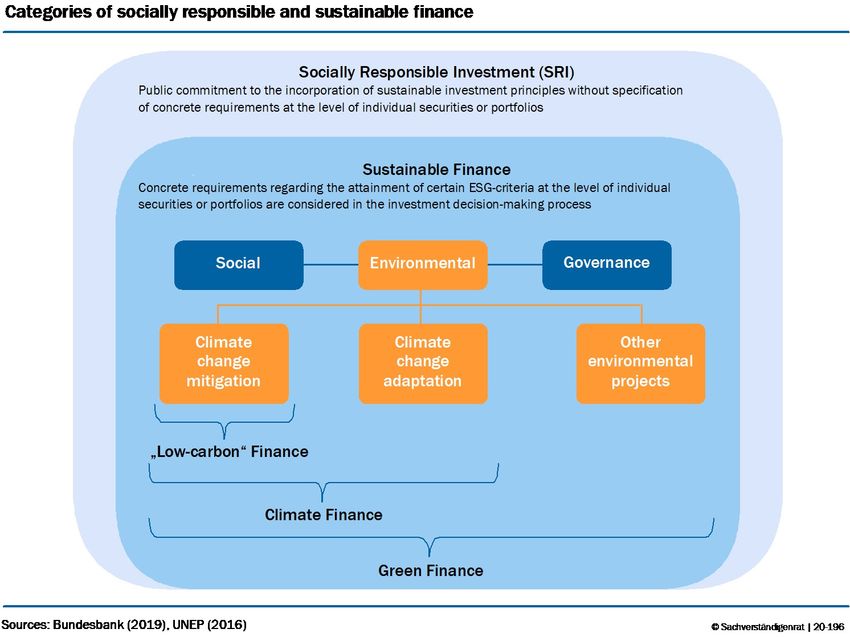
banks manage 15% of investments in sustainable assets. The market for sustainable funds
and mandates is dominated by institutional investors which hold 154,3 billion Euro or a share
of 89% of the outstanding volume in 2019. This represents an increase of 87% since 2017.
Among German institutional investors, ecclesiastic and charity organisations account for 27% of
sustainable investments, while insurance companies hold a share of 19% and public institutions
contribute 17%. Retail investments in sustainable funds and mandates have grown from 8.5
billion Euro in 2017 to 18.3 billion Euro in 2019 which equals a growth rate of 115% (FNG,
2020).

2.2.2    Screening Criteria

Investment in green financial assets severely restricts investment opportunities. The selection
of a green investment can be based on various strategies (Deutsche Bundesbank, 2019b). ESG
ratings or green labels can be helpful in the selection process. Negative criteria can be used to
exclude investment options that are related to countries, industries or companies that contradict
fundamental environmental standards. One such exclusion criterion could, for example, be the
operation of a coal-fired power plant. The negative criterion can be weakened if, for example,
a turnover limit is set. Investments would then be possible if, for example, a company did not
generate more than 1% of its turnover from fossil fuels. Further weakening can be made with
regard to the inclusion of value chains or suppliers. This distinction is particularly important
for the financial sector, as banks and insurers are invested in many different industries. A strict
application of the negative criterion could severely restrict their lending opportunities.

   The best-in-class approach gives preference to those investments that perform the greenest
in their reference group. However, this approach may favor investment in a company that con-
tributes significantly to pollution, but less than other companies in the same sector. Therefore,
it is controversial whether investments in energy suppliers should be considered green if the
supplier operates coal-fired power plants, but at the same time also renewable energies and thus
causes less CO2 emissions than comparable energy suppliers. This problem also exists for the
best-in-process approach. This approach favors investments in companies that have made the
best progress reducing their negative environmental impact in recent years. As a result, invest-
ments can be considered that fall on companies that were previously particularly polluting and
now cause less but still a lot of pollution.

   However, all these approaches are likely to contribute to the basic aim of green investment,
which is to create competition between companies for greener operations.

2.2.3    Financial Market Performance

A growing literature deals with yield differences of green financial assets compared to con-
ventional financial assets. The literature comes to no distinct conclusion as to whether green
financial assets are likely to generate higher profits. The development of green stock indices is
very similar to that of broader stock indices (Chart 3). When comparing the MSCI World ESG
Leaders with the MSCI World, the conventional index shows a slight advantage, while the ESG

                                                7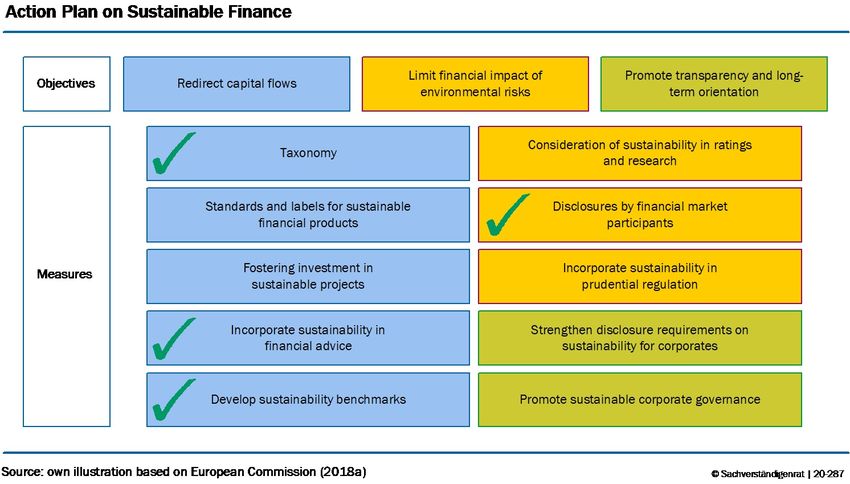
index performs slightly better for the European indices. However, the differences are hardly
meaningful.

Figure 3

   Ibikunle and Steffen (2017) find that European green mutual funds perform worse than Eu-
ropean conventional ones for the period 1991-2014. In the last years between 2012 and 2014,
however, green funds performed better than conventional ones. Additionally, Silva and Cortez
(2016) show that green funds perform worse than conventional ones. However, this affects the
European funds more than the US ones. They also find that green funds perform better in times
of crisis than in non-crisis periods.

   The results for the differences in returns on the bond market are similarly inconclusive. The
Climate Bonds Initiative (2017) and the OECD (2017) do not find any significant differences
between yields on green bonds and conventional bonds on the primary market. Hachenberg and
Schiereck (2018) also find no significant difference for the secondary market. Higher yields of
green US municipal bonds in the secondary market are described by Karpf and Mandel (2018).
Zerbib (2019) finds indications of financing advantages of green bonds with lower secondary
market yields two basis points. According to Kapraun und Scheins (2019), the yield on green
government bonds is 30 basis points lower in the primary market and 3 basis points lower in the
secondary market. Green corporate bonds have no statistically significant yield differential at
issuance, but a 33 basis points higher yield in the secondary market. US municipal and corporate
green bond yields are lower according to Baker et al. (2018). Ehlers and Packer (2017) describe
an 18 basis points lower issue yield, but no differences on secondary markets. Larcker and Watts
(2020) and Flammer (2020) find no evidence for a premium, i.e. a lower yield, of green corporate
bonds. Bannier et al. (2019) explain lower returns of investments in stocks of companies with
high ESG scores with their insurance function. By contrast, companies with low ESG scores
must pay a risk premium.

                                               8
2.2.4 Green Bonds
The supply of green bonds has increased sharply since 2013. Before that, green bonds were hardly
existent. Although the European Investment Bank (EIB) issued the world’s first green bond in
2007, supranational organisations (the Worldbank issued first green bond in 2008) remained the
only green issuers in subsequent years (EIB, 2020; World Bank, 2020) (Chart 4). Other issuers
in the first few years were government entities in Norway and France. The first green corporate
bond was issued in 2013 by the Swedish real estate company Vasakronan (Vasakronan, 2020).
The Green Bond Principles (GBP), voluntary guidelines of the International Capital Market
Association (ICMA), have given a boost to market development from 2014 onwards through
more uniform standards and greater transparency (Ehlers & Packer, 2017). The introduction of
the EU taxonomy establishing a uniform classification system of sustainable economic activities
as well as the introduction of an EU Green Bond Standard (EU GBS) could further stimulate
the market (Chapter 4.1). State development banks or local governments were active in the
market for green bonds at a very early stage. However, the first green sovereign bond was issued
by Poland in 2016.
Figure 4
In 2019, the increase in green bonds was 90 billion US-Dollar or 53% higher than in 2018
(Chart 5, Left). However, with a global bond market worth just over 100 trillion US-Dollar,
the green bond market (bonds aligned with CBI definitions) with 844.9 billion US-Dollar ever
issued is only a niche market. The largest share of new green bonds comes from European is-
suers. In 2019 more than 120 billion US-Dollar were issued. The second largest increase is from
the Asia-Pacific region before bonds from North America. The country with the most annual
new green bonds since 2014 is the USA. In 2019, over 50 billion US-Dollar of green bonds were
issued there. Only in 2016 were slightly more green bonds issued in China. In 2013 most green
bonds with a volume of 2.2 billion US-Dollar came from France.
By the end of May 2020, only 66.6 billion US-Dollar of green bonds had been issued world-
9wide (Chart 5, Left). That is just a quarter of last year’s issue volume. One reason for the
comparatively low volume may be the still small market. Individual issues can have a large
effect. If these are only planned for the second half of the year, there may still be some room for
improvement over the year as a whole. Germany, for example, plans to enter the sovereign bond
market in the double-digit billion range in the second half of the year (Chapter 2.2.5). Another
reason for the reluctance so far could be the introduction of the EU taxonomy, which entered
into force in July 2020. Issuers may have waited for legal certainty on this classification system
with new bonds adapted to it. In addition, the COVID-19 crisis has created uncertainty and
could cause issuers to hold back on green investments in the short term. Conventional bonds
with higher liquidity could be preferred in the crisis. In the medium term, however, govern-
ments in particular are expected to have higher debts and thus more bonds to issue, some of
which could be issued as green bonds. Additionally, many countries are discussing combining
economic stimulus packages with investments in climate protection, which could result in more
green corporate bonds.
Figure 5
The capital raised through green bonds is mainly spent on those sectors that contribute most
to environmental pollution (IPCC, 2014). Funds flow into the energy sector, followed by the
building and transport sector. Only a very small part is used for industry or information and
communication technologies (Chart 6, Left). The German sectoral distribution is much more
focused on the energy sector with a share of 62 %. Moreover, 28% of green bond issuances in
Germany are from the building sector. In comparison to the global sectoral distribution, the low
share of the transport sector in green bond issues (6.6%) seems surprising given the relevance of
car manufacturing for the German economy (Chart 6, Right). This is probably related to the
fact that corporate bonds are very rare in the German green bond market. Instead, the KfW
dominates, whose funds hardly flow into the car industry and very strongly into the energy sector.
10Figure 6
2.2.5 Green Sovereign Bonds
After Poland had issued the first green sovereign bonds in 2019, France, Fiji, Nigeria, Indonesia,
Belgium, Lithuania, Ireland, Seychelles, the Netherlands, Hong Kong and Chile followed by the
end of 2019 (Climate Bonds Initiative, 2020b). In total, these countries have so far issued green
bonds worth around 60 billion US-Dollar. That would be almost 8% of all green bonds ever
issued. In 2019, with an amount of 24.6 billion Euro, around 10% of all green bonds were issued
as government bonds. Cash inflows from green government bonds are mainly used for the sectors
energy, transport, buildings and land use. Another nine countries have announced the first issue
of green government bonds for 2020: Columbia, Denmark, Egypt, Italy, Kenya, Mexico, Peru,
Spain, Sweden. This could boost the market for green bonds.
So far in Germany, only the state-owned development bank KfW and some government-
backed entities were active in the market for sovereign green bonds (Chart 5, Right). However,
in September 2020 the German government entered the green bond market with an 10-year
bond and a volume of 6.5 billion Euro (German Finance Agency, 2020). By the end of the year,
green bonds totaling 11 billion Euros are to be issued, including a 5-year bond. This will make
Germany one of the largest single issuers of green government bonds. The medium-term goal is
a complete green benchmark curve through the issuance of green bonds in all previous standard
maturities: 2, 5, 10 and 30 years. Accordingly, green government bonds with different maturities
will be available to match the different preferences of investors. Short-term green bonds will
then be available to central banks, medium-term ones to investment funds and long-term ones
to pension funds. This is intended to create an interest rate reference for the euro area green
finance market, so that market participants have access to safe green bonds with the best rating.
A further aim is to develop and promote the green finance market (German Finance Agency,
112020). Other government issuers in the euro area such as France or the Netherlands have so
far only issued single maturities. In addition, the goal is to attract new investors for German
government bonds and thus secure favorable financing terms in the future.
The special feature of this market entry is the construction as twin bonds. Parallel to the
green bond, the German government’s Finance Agency issues conventional bonds to the same
amount, but these are only held in the Agency’s own portfolio. This enables them to be rep-
resented via the repo market and at the same time keeps liquidity high. As a benchmark for
interest rates in the euro area, it is important for the Finance Agency that the liquidity of
German bonds is high at all times. The issue of green bonds could reduce the liquidity of con-
ventional bonds. Twin bonds are intended to prevent this problem. In addition, investors can
exchange the green bonds for their conventional twin bonds at any time. This is intended to
keep the liquidity problem low for green bonds as well.
The green bonds are similar to an existing conventional bond in terms of maturity, coupon
and interest dates. The differences are an initially smaller issue volume, issue dates after conven-
tional bonds, a separate ISIN and a statement on the allocation and reporting of green spending
in the federal budget. The use of the funds is not restricted to specific green expenses. However,
the amount of green bonds that can be issued is limited by the amount of green expenditures
in the federal budget. The issuing of these green bonds will therefore initially not change the
government’s spending behaviour. The expectation of the Finance Agency is that, with all other
features remaining the same, an additional green feature will lead to an increased demand and
thus more favourable financing conditions. In contrast to previous comparisons between green
and conventional bonds, which were based on basically comparable bonds of the same issuer,
the yield differentials of these twin bonds should actually represent a kind of premium for the
green label given that the bonds are otherwise identical.
When selecting green budget positions, the Federal Government does indeed orient itself to
established international market standards, such as the UN Sustainable Development Goals or
the Green Bond Principles of the International Capital Market Association (ICMA). However, it
cannot be ruled out that green investors may consider bonds based on green spending from the
previous fiscal year and with conventional bonds existing in parallel, to be insufficient. Instead,
some investors prefer to invest in bonds that are assigned to specific future projects (The World
Bank, 2018), as for example the Netherlands with at least 50% of their green bond issuances
do (Dutch State Treasury Agency, 2019). Moreover, the form of the twin bond could make it
more difficult to distinguish it from conventional government spending. Some investors do not
buy bonds with a possibility that the capital could be used, for example, for military spending
(The World Bank, 2018). On the other hand, there might be a loss of credibility for the Finance
Agency as well as legal problems if green bonds were assigned to specific future projects and
afterwards cancelled for political, economic or technical reasons. Alternatively, at least the green
bonds could be based on expenditures of the next budget. This would require a buffer between
the planned expenditures and the assigned green bonds.
12The entry of countries that issue safe bonds, such as Germany, could further develop the
market for green bonds. Many financial institutions hold sovereign bonds despite the small
margins that can be achieved with them. The reasons for this are often regulatory requirements
and portfolio diversification. The composition of an investment portfolio such as a fund is based
on a mix of risky and less risky assets. Sovereign bonds are an important asset to control the
risk profile. The riskier the portfolio is to be, the more government bonds, in particular of safe
issuers such as the USA or Germany, are needed. A lack of green sovereign bonds could hamper
the expansion and diversification of green investment portfolios. The limited opportunities due
to the lack of green sovereign bonds could make funds shy away from further replacing their
portfolios with green investments. This restriction would also limit the growth opportunities of
green corporate bonds.
Currently, the market for green-labelled bonds is dominated by bonds issued by development
banks and financial companies, followed by non-financial companies. Sovereign bonds play a
rather minor role. A CBI (2019) survey of Europe-based fixed income asset managers shows
that investors want significantly more green bonds from governments. They are most interested
in bonds issued by non-financial corporations, while green bonds issued by development banks
are less in demand. This gives another indication that the market is interested in more green
sovereign bonds and that governments could support this market with their own bonds.
2.2.6 Green Corporate Bonds
Globally, corporate bonds are the largest green bond segment. While almost no green corporate
bonds existed before 2013, an amount of 114.3 billion US-Dollar were issued in 2019 (Climate
Bonds Initiative, 2020a). However, the importance of green corporate bonds is extremely low
compared to outstanding conventional corporate bonds worldwide, worth 52.9 trillion US-Dollar
(Bank for International Settlements, 2019). In 2019, the volume of bonds issued by financial
and non-financial corporations was roughly balanced. Compared to 2018, when more bonds
came from financial corporations, non-financial corporations doubled their issues. Bonds issued
by non-financial companies are dominated by the energy sector. The Ehlers and Packer (2017)
shows that issuers from sectors that are exposed to immediate or emerging environmental risk
have a larger share of green bond issues compared to their share of total bonds. Similarly,
Flammer (2020) argues that companies whose business activities are heavily dependent on the
environment or natural resources, such as the energy sector, issue a disproportionately large
number of green bonds. Companies from the less ecological sectors could want to send a sig-
nal of environmental friendliness with green bonds. Companies with a less polluting economic
model, on the other hand, could do without this form of signalling, since the costs for ratings
and ESG-Scores are not compensated by the image gain (Chapter 2.2.6).
The largest issuers come from France, the USA and Portugal. In the financial sector, two Chi-
nese and two French banks lead the list of the largest issuers (Climate Bonds Initiative, 2020a).
In Germany, non-financial corporations have consistently issued fewer bonds than financial cor-
13porations in the past (Chart 5, Right). This also affects the ECB’s purchasing programme, as
it does not buy corporate bonds from financial institutions because of its non-bank criterion.
More green bonds issued by non-financial corporations would meet market demand for these
bonds (Climate Bonds Initiative, 2019) and at the same time increase the amount of potential
green bonds that the ECB can buy (Chapter 5.2).
Corporates can have several motives for issuing green bonds. First, corporates can be inter-
ested in lower financing costs. If the costs are not lower, they might as well issue conventional
bonds to finance green projects. However, the evidence is very weak in this respect. Second,
corporates could try to use bonds for greenwashing. Green bonds will then only be used to
make the company appear greener than it actually is. Third, the corporation uses green bonds
to signal a stronger commitment to greener business practices. Flammer (2020) shows that
companies indeed become greener after issuing green bonds, their sustainability ratings increase
and CO2-emissions decrease. Nevertheless, corporations might issue green bonds if they know
they will become greener and want to signal it. In addition, the ownership structure is changing
to greener and longer-term oriented investors. On the contrary, she finds no evidence for the
first two motives.
For companies there are costs associated with the certification of green bonds. The Climate
Bond Initiative charges a certification fee of 0.1 basis point of the issue volume for its green
label. Normal ratings from the major rating agencies are around 3-5 basis points. A similar
amount could be expected for an additional green label Ehlers and Packer (2017). Further
costs can arise within the company due to reporting and disclosure obligations. The planned
EU taxonomy (Chapter 4.1) could at least reduce these costs somewhat through standardization.
In Germany, financial companies play a relatively small role in the market for green bonds.
The share of non-financial companies is even smaller, with less than 4 billion Euro of green
bonds issued to date. The market is dominated by KfW as the development bank of the federal
government and other government-backed entities (Chart 5, Right). One reason for this could be
that the corporate bond market is small by international standards. In countries with a smaller
economy than Germany, such as France, the United Kingdom, the Netherlands, Australia or
Canada, significantly more corporate bonds are issued (Bank for International Settlements,
2019).
3 Risks Related to Climate Change
3.1 On the Nature of Climate Risks
Climate change constitutes a major challenge, causing both threats and opportunities that will
significantly affect the economy and the financial sector. Physical risks stem from climate-
related damage due to global warming. Such events can be both acute and more gradual, such
as changes in extreme weather variability and rising sea levels. There is significant regional
variability in countries’ vulnerability to climate risks (Chart 7). The second source of risk arises
14from the shift towards a low carbon economy (transition risks). Achieving this transition almost
certainly requires intervention by public authorities through regulation and taxation. The eco-
nomic transformation and the almost inevitable uncertainties surrounding the course of climate
policy are a source of significant risk.
Figure 7
Physical and transition risks are the channels through which climate change can affect
macroeconomic conditions and financial stability (NGFS, 2018) (Chart 8). A shift in climate
can have both an economic impact and an effect on financial stability through an interplay of
supply and demand shocks (Batten, 2018). Insurance liabilities are particularly exposed to the
frequency and severity of climate and weather-related events (Albouy et al., 2016; Bunten &
Kahn, 2014; Gassebner et al., 2010). On the demand side, extreme climate events could reduce
household wealth and therefore negatively impact private consumption (Hallegatte, 2009). Un-
certainty about future demand and growth prospects could also lead to higher precautionary
savings and lower investment (Parker, 2018). On the supply side, natural disasters can disrupt
business activity and trade, and destroy infrastructure, diverting capital from technology and
innovation to reconstruction and replacement (Batten, 2018). As has proven to be the case in
the past, these macroeconomic and financial shocks can further interact and amplify each other.
15Assuming a business-as-usual scenario in which emissions are taken as given, the global “climate
value at risk” depicting the 99th percentile of the global financial system’s loss distribution is
estimated at 16.9% or USD 24.2 trillion (Dietz et al., 2016).
Figure 8
Adjustments to asset prices induced by physical or transition risks will probably be a key
channel of impact over a short to medium-term horizon (Batten, 2018). Systemic risks in the
financial system may arise due to institutions’ exposure to carbon-intensive assets that become
“stranded” (i.e. unusable). Recent empirical work underscores the importance of asset price
bubbles in the build-up of systemic risk – especially during the bust phase (Brunnermeier et al.,
2019). In the case of a mispricing (i.e. current overvaluation) of carbon-intensive assets, the
introduction of policy measures demanding a sudden transition to a low-carbon economy might
provoke such a bust of the “carbon bubble”. McGlade and Ekins (2015) estimate that 82%
of global coal reserves, 49% of gas reserves and 33% of oil reserves would turn into “stranded”
assets in an economy that successfully restricts emissions to meet the 2◦ C global warming target.
In contrast, Sinn (2012) argues in favor of a “green paradoxon” in which companies would have
an incentive to promote fossil energy sources faster and sell them into regions with weak climate
policies. As approximately a quarter of global fossil fuel reserves is owned by private companies,
a repricing of carbon-intensive assets would imply a drastic reduction in their market valuation
and profit. The capital structure of fossil-fuel companies is largely built on debt, underscoring
the potential threat to the financial system’s stability imposed by a carbon bubble (Domanski
et al., 2017; ESRB, 2016).
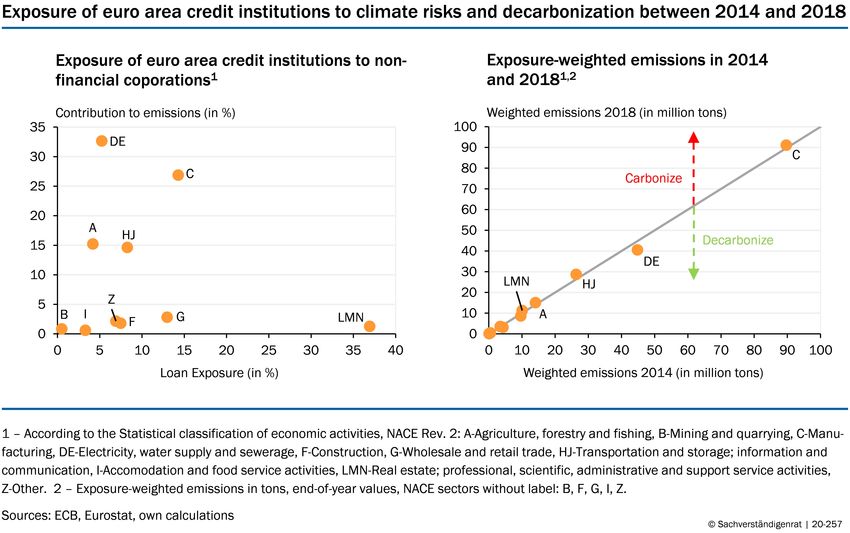
To analyse the potential threat of such a carbon bias, the exposure of euro area credit
institutions through loans to non-financial companies in the euro area can be compared to the
16carbon-intensity of the companies’ business (Chart 9). Almost 40% of all outstanding loans at
the end of 2018 are granted to companies in the real estate business, or other branches of the
service sector which contribute only 1% to overall CO2- and CO2-equivalent emissions in the
EU in the same year. 14% of all loans are granted to companies from the manufacturing sector
which accounts for more than a quarter of all emissions. Credit institutions’ loan exposure
to other carbon-intensive sectors only surpasses a threshold of 5% in the case of loans made
to the transportation and storage sector as well as the (combined) electricity, gas and water
supply sector. Overall, loans to sectors that are not particularly carbon-intensive (i.e. each
contributing less than 5% to overall emissions) account for almost 70% of credit institutions’
loan exposures. These numbers suggest that with regard to loan exposures the potential shock
to the euro area banking sector imposed by a carbon bubble might not induce a systemic event.
Comparing institutions’ loan exposure at the end of 2014 and 2018 suggests that on average
exposure-weighted emissions have not significantly changed in recent years, although loans made
to the most carbon-intensive sector of electricity and water supply have been reduced (Chart 9,
Right). In fact, a sizeable part of emissions concentrates around a very small number of large
polluters, but those firms are not necessarily the ones to which banks are most exposed. Using
more granular supervisory data, ECB (2019) however shows that few banks hold the bulk of
exposures to the most energy-intensive borrowers, whereby the CO2 emissions of the 20 most
polluting firms amount to half of euro area banks’ exposures to emitting firms captured in their
datasets. In fact, such concentration of risks could also be a source of financial instability, which
emphasizes possible limitations in using aggregated data when analyzing credit institutions’
exposure to risks.
Figure 9
Based on broader data comprising equity, bond and credit holdings, Weyzig et al. (2014)
17estimate the exposure of European financial institutions towards fossil fuel companies that hold
reserves likely to become “stranded assets”. Although they estimate exposures of up to 460-480
billion Euro for European banks and up to 260-300 billion Euro for pension funds, the relative
share of assets exposed to this source of transition risk amounts to 1.4% of total assets for banks
and at most 5% for EU pension funds. It is concluded that the carbon bubble is unlikely to
be a primary source of systemic risk itself and may much rather become a threat to the finan-
cial system’s stability in a scenario of general macro-economic and financial fragility. Based
on data covering approximately 10% of the German banking sector’s exposure, the Bundesbank
(Deutsche Bundesbank, 2019a) finds evidence indicating that German banks are not particularly
affected by a transition to a low-carbon economy through loans.
Aside from long-dated predictions, actual measurement of physical risks to date suggests that
physical and transition risks are already playing a growing role in eroding the collateral and asset
values of insurers. The number of natural catastrophes has been steadily increasing since 1970
(Chart 10, Left). A concomitant rise in the incidence of natural disasters may place insurers and
reinsurers in a situation of fragility as claims for damages keep increasing. Losses from natural
catastrophe have risen steadily between 1980 and 2019 and insurers are now already facing high
levels of weather-related costs (Chart 10, Right). Losses from natural catastrophes worldwide
amounted to 137 billion US-Dollar in 2019, and only 38% of these were insured, leaving a large
insurance protection gap. In the EU, the average number of insured losses between 1980 and
2018 was even slightly smaller (ESRB, 2020). As such, they can pose a significant threat to the
solvency of households, businesses and governments, and therefore financial institutions as well
(Bolton et al., 2020).
Figure 10
Physical and transition risks are not likely to be independent of one another. The costs
associated with these risks vary depending on the trajectory chosen for reducing carbon emissions
18(Chart 11). While the lack of sufficiently forceful policy measures aggravates physical risks,
abundant or misplaced climate policies may intensify transition risks (Vermeulen et al., 2018). In
a gradual transition to renewable energy and replenishment of the physical capital stock, carbon-
intensive technologies would gradually become unprofitable due to a combination of regulation
(such as carbon taxes) and technological development (i.e. economies of scale that drive down
the costs of renewable energy). However, if policy intervention is delayed, the reduction in
emissions may have to be sharper to reach negotiated climate targets, resulting in a disorderly,
disjointed and more disruptive transition for the economy. In a sudden and disorderly transition
scenario, the re-evaluation of assets in the fossil fuel sector might lead to severe imbalances in
the economy and financial markets (Bolton et al., 2020; Cahen-Fourot et al., 2020; McGlade &
Ekins, 2015).
Figure 11
3.2 Climate-related Risks in Credit Ratings
Environmental risks can affect the possibilities of an entity to meet its financial obligations.
To some degree, credit rating agencies have always considered such risks when assigning credit
ratings, but they only recently started to explicitly consider and incorporate them into their
assessment processes. Environmental risks have already played an increasingly important role
in credit rating decisions in recent years. In 2017, Moody’s downgraded the city of Cape Town,
South Africa, after a major drought threatened the municipality’s ability to provide water to the
community. Earlier this year, Trinity Public Utilities District in California was downgraded due
to the elevated risk of wildfires. Regarding a downgrade of Ford in September 2019, Moody’s
cited the potential for “large emission penalties in 2020 and 2021” as part of the reason for
docking the carmaker to junk status. In April 2020, Moody’s downgraded Exxon Mobile, the
19biggest energy company in the world by market capitalisation, from AAA to Aa1 quoting the
“growing efforts by many nations to mitigate the impacts of climate change through tax and
regulatory policies that are intended to shift global demand towards other sources of energy or
conservation” as one of the reasons for the rating decision (Moody’s Investors Service, 2019).
However, major rating agencies still estimate that in general ESG risks, especially climate risks,
have a low level of direct impact on credit ratings (Fitch Ratings, 2019; S&P Global, 2019). In
relative terms, governance is said to be the most relevant ESG factor (Fitch Ratings, 2020; S&P
Global, 2019).
Credit rating agencies play a central role in the proper pricing of environmental and climate
risks. The three major rating agencies, Moody’s, Fitch, as well as S&P have all signed the
“ESG in credit risk and ratings statement” (PRI, 2020a). By doing so, the signatories recognise
that ESG factors can affect borrowers’ cash flows and the likelihood that they will default on
their debt obligations. Consequently, they commit to incorporating ESG-criteria into credit
ratings and analyse them in a systematic and transparent way. In addition to integrating ESG
evaluations into their existing credit ratings, major rating agencies (as well as specialized rating
agencies like Sustainalytics and ISS-oekom) provide ESG assessments in which they evaluate the
ESG performance of companies and individual securities. Such ESG assessments are demanded
by a growing number of institutional investors, asset managers, financial institutions and other
stakeholders.
Moody’s cited ESG risks as material credit considerations in 33% of the 7,637 private-sector
rating actions published in 2019 (Mutua, 2020). In an internal analysis, S&P (2017) examined
where and how environmental and climate factors had driven corporate rating actions in the
past. They document that between July 2015 and August 2017, such factors were an important
component of the analysis in 10% of the 9000 rating actions under review. However, climate
risks or opportunities were one of the key reasons for the rating action in only 1 percent of all
cases. Out of these, 41% were downgrades, but at least 19% were upgrades, which also illus-
trates that environmental factors do not only bear a diverse range of risks but also opportunities
for the rated entities. As such, organizational efforts to mitigate and adapt to climate change
through increasing resource efficiency, the adoption of low-emission energy sources or by building
resilience along the supply chain can become a strategic imperative for firms.
Despite this, major rating agencies have been improving their capacity to better analyse how
climate change can factor into the financial stability of companies and governments around the
world in recent years. By doing so, agencies acknowledge that the importance of climate risks
for credit ratings differs along multiple dimensions and might well be of high relevance for single
entities. Moreover, the question where and through which channels environmental risks arise
critically depends on factors that are beyond the control of the rated entity. As such, chances
to effectively manage climate risks are limited.
Rating agencies take different actions to develop a better understanding on how environmen-
20tal and climate factors can be incorporated into rating actions. For instance, Fitch introduced
so-called ESG Relevance Scores that document the relevance of individually identified ESG risk
elements to a given rating decision in 2019 (Fitch Ratings, 2019). Moody’s developed a Heat
Map, S&P introduced an ESG Risk Atlas to gauge which areas and industries face the high-
est exposure to the physical impacts of climate change, as well as which industries are risking
transitional impacts as the demand for renewable energy rises. Moreover, major rating agencies
have recently acquired firms that measure the physical risks of climate change, which can be
considered as a major step on the way to incorporating ESG criteria into the rating process.
In 2016, S&P acquired Trucost which offers a dataset that assesses the exposure of more than
15,000 companies’ to physical risk at asset level. In 2019, Moody’s bought a majority share in
Four Twenty Seven, a California-based company that measures a range of hazards - including
extreme rainfall, hurricanes, heat stress and sea level rise - and tracks their impact on 2,000
companies and 196 countries. The purchase is the most recent in a series of steps by rating
agencies to better account for the effects of climate change.
The relevance of climate risks for credit ratings varies along multiple dimensions. First, it
depends on the rating class, although agencies disagree on the extent to which environmental
and climate factors matter for certain rating classes. While S&P considers environmental risks
to be particularly relevant for corporate ratings, Fitch considers it to be more material for the
ratings of sovereigns than for all other asset classes (Fitch Ratings, 2019). All major rating
agencies consider banks not to be considerably exposed to environmental and climate risks due
to a high degree of portfolio diversification. Nonetheless, a simulation analysis measuring the
impacts of a credit rating downgrade of one notch for banks’ exposures to the highest polluting
firms within economic sectors suggests credit losses that could reach up to 10% of total assets
(ESRB, 2020). In an analysis by Moody’s Investors Service (2020b), only 32% of large banks
even partially disclose how climate risk would affect their financial performance under global
warming stress scenarios.
With regard to corporate ratings, environmental credit risks are particularly relevant in spe-
cific sectors. According to Moody’s heat map, the top industries with elevated environmental
risks are unregulated utilities and power companies, the automobile industry, the oil and gas
refining market and the transportation industry. In 2018, they identified 11 sectors, with a com-
bined 2.2 trillion US-Dollar in rated debt, as being in danger of a downgrade owing to tightening
of CO2 regulatory regimes (Moody’s Investors Service, 2020a) (Chart 12).
Moreover, there are regional differences in the relevance of climate risks for credit ratings.
This can either be due to regional vulnerabilities to physical risks or to global differences in
the level of enforcement of environmental policies. Although climate change, on average, poses
a negligible direct risk to sovereign ratings of advanced economies, ratings for many emerging
sovereigns would likely come under significant additional pressure over time (Chart 7). In a
globalized world, distortions in emerging and developing countries can have indirect repercus-
sions for advanced economies as well, for example, through trade and migratory flows. Under
21You can also read