PRODUCT DISCLOSURE STATEMENT - Napier Port
←
→
Page content transcription
If your browser does not render page correctly, please read the page content below
PRODUCT
DISCLOSURE
STATEMENT
INITIAL PUBLIC OFFERING OF ORDINARY SHARES
IN NAPIER PORT HOLDINGS LIMITED
15 JULY 2019

The issuer under this offer is Napier Port Holdings Limited.           JOINT LEAD MANAGERS   CO-MANAGER
This document gives you important information about this investment
to help you decide whether you want to invest. There is other useful
information about this offer on www.business.govt.nz/disclose,
offer number (OFR12679).
Napier Port Holdings Limited has prepared this document in
accordance with the Financial Markets Conduct Act 2013. You can
also seek advice from a financial adviser to help you to make an
investment decision.
SECTION 1 /
KEY INFORMATION SUMMARY

1.1        WHAT IS THIS?                                                1.4        KEY TERMS OF THE OFFER
This is an offer of ordinary shares (Offer Shares) in Napier Port
                                                                        Offer                             Offer of new Shares by Napier Port
Holdings Limited (Napier Port Holdings). Ordinary shares in
                                                                                                          Holdings
Napier Port Holdings (Shares) give you a stake in the ownership
of Napier Port Holdings. You may receive a return if dividends are      Description of the                Fully paid ordinary shares
paid or Napier Port Holdings increases in value and you are able to     equity securities
sell your Shares at a higher price than you paid for them.
                                                                        Indicative Price                  $2.27 – $2.60 per Offer Share
If Napier Port Holdings runs into financial difficulties and is wound   Range1
up, you will be paid only after all creditors have been paid. You may
lose some or all of your investment.                                    Total number of                   90 million Shares, representing 45%
                                                                        Shares being                      of the 200 million Shares on issue
1.2        ABOUT NAPIER PORT                                            offered under the                 immediately after Listing
                                                                        Offer
Napier Port is a port located in Hawke’s Bay and is New Zealand’s
fourth largest port by container volume1. Napier Port provides a        Gross proceeds                    $204.3 million – $234.0 million
range of port and logistics services (marine, handling and value-       from the Offer2
add services), with its core revenue streams arising from container
services, bulk cargo and cruise. In FY2018 Napier Port managed          Priority Offer opens              23 July 2019
the arrival and departure of over 680 ships, carrying over five
                                                                        Priority Offer closes             5 August 2019
million tonnes of cargo and over 100,0002 cruise passengers.
Napier Port Holdings will be the parent company of the Napier Port      Institutional Offer               6 August – 7 August 2019
group on completion of the Offer. Napier Port Holdings is currently     and Bookbuild
a wholly-owned subsidiary of Hawke’s Bay Regional Investment            Final Price                       7 August 2019
Company Limited (HBRIC), the investment arm of Hawke’s Bay              announced and
Regional Council. Port of Napier Limited is the operating company       allocation
of the Napier Port group and will be acquired by Napier Port
Holdings prior to Listing.                                              Broker Firm Offer                 8 August 2019
                                                                        opens
For more information, see Section 2 (Napier Port and what
it does).                                                               Broker Firm Offer                 16 August 2019
                                                                        closes
1.3        PURPOSE OF THIS OFFER
                                                                        Settlement                        19 August 2019
The primary purpose of the Offer is to raise capital for                and allotment
Napier Port to:
                                                                        Listing, expected                 20 August 2019
•     reduce existing debt and provide capacity to fund the 6 Wharf
                                                                        commencement of
      expansion project; and
                                                                        trading on the NZX
•     enable HBRIC to realise a portion of its investment in Napier     Main Board and
      Port (on completion of the Offer, HBRIC will own 55% of the       earliest expected
      total Shares on issue).                                           mailing of holding
For more information, see Section 3 (Purpose of the Offer).             statements

                                                                        Expected payment                  December 2019
                                                                        of first dividend
                                                                        following the Offer

                                                                        Liabilities, fees                 If you sell your Shares, you may be
                                                                        and charges                       required to pay brokerage or other sale
                                                                                                          expenses. You may also be liable for
                                                                                                          tax on the sale of your Shares. You
                                                                                                          should seek your own tax advice in
                                                                                                          relation to your Shares

                                                                        The above dates are indicative only and may change. Napier Port,
                                                                        in consultation with the Joint Lead Managers, reserves the right
                                                                        to vary or extend these dates. Napier Port may also withdraw the
                                                                        Offer at any time before Settlement or accept late Applications
                                                                        (either generally or in individual cases).
                                                                         	The Indicative Price Range is indicative only. The Final Price will be set after the
                                                                        1.

                                                                           conclusion of the Bookbuild and may be within, above or below this range. The Indicative
                                                                           Price Range may be varied at any time by Napier Port.
                                                                        2.
                                                                             Equal to the number of Offer Shares multiplied by the lower and upper end of the
                                                                             Indicative Price Range (as applicable).

                                                                        For more information, see Section 3.2 (Minimum Offer amount),
1.
     Deloitte Freight Yearbook 2019.                                    Section 5 (Terms of the Offer) and Section 13 (Glossary).
2.
     2017/2018 cruise season.

01
N A P I E R P O R T / P R O D U C T D I S C LO S U R E S TAT E M E N T

1.5	HOW PRICING OF                                                      1.6	HOW YOU CAN GET
     OFFER SHARES IS FIXED                                                    YOUR MONEY OUT
Napier Port has set an Indicative Price Range of $2.27 to $2.60          Napier Port Holdings intends to quote the Offer Shares on the
per Offer Share.                                                         NZX Main Board. This means you may be able to sell them on
                                                                         the NZX Main Board if there are interested buyers. You may get
The Final Price will be set by way of a Bookbuild managed by the
                                                                         less than you invested. The price will depend on the demand for
Joint Lead Managers. The Bookbuild is expected to take place
                                                                         the Shares.
from 6 August to 7 August 2019 and the Final Price is expected
to be announced and posted on www.napierportshareoffer.co.nz
on or about 7 August 2019. All Offer Shares will be issued at the
Final Price.
For more information, see Section 5 (Terms of the Offer).

1.7     KEY DRIVERS OF RETURNS

 Drivers of financial performance         Key strategies and plans

 Cargo volume received by                 •   Maintain close and collaborative relationships with a wide range of primary producers,
 the Port                                     forestry industry participants and other cargo owners through the integration of our Port
 Export and import trade to and from          operations with their supply chains.
 Hawke’s Bay and the surrounding          •   Provide innovative solutions that create efficiencies for our customers, such as our vehicle
 regions passing through the Port             booking system for traffic management.
 is a key driver of revenue, with         •   Further develop our network of infrastructure to extend our reach across our catchment
 logs and containers being the                areas through the use of off-Port sites, such as the Thames Street container depot and the
 largest components.                          Whakatu land holding.
                                          •   Actively manage our pricing strategies to ensure we earn a fair return on our assets.

 Cargo mix                                •   Increase the focus on handling high-value cargo such as perishable primary products
 Our charges and revenue vary across          exported in refrigerated containers.
 the different containerised and bulk     •   Build relationships with importers to increase the number of full containers coming into the
 cargo products passing through the           Port rather than empty containers. See Section 2.10 (Strategic case studies – Big Save
 Port and therefore cargo mix is an           Furniture) for an example of us implementing this strategy.
 important driver of profitability.       •   Provide fit for purpose port facilities that allow the Port to meet the needs of a diverse range
                                              of export and import cargo.

 Ships visiting the Port                  •   Development of port infrastructure and marine services to accommodate an increased range
 The number, type and size of ships           and frequency of ships visiting the Port to meet our customers’ needs.
 calling at the Port is a key driver of   •   The construction of 6 Wharf will increase the Port’s capacity for the number of ships that
 our revenue given we charge a fixed          can visit as well as the size of ships that can visit.
 all-in marine services fee depending     •   Invest in ongoing training and marine simulation testing to support the development of our
 on a ship’s characteristics.                 marine personnel involved in the safe management, planning and handling of ships visiting
                                              the Port.

 Napier Port service offering             •   Grow our existing value-add service offering, such as container storage and container
 Our value-add services contribute            packing/unpacking services, through our connections with customers and informed by data
 to revenue and increase our                  collected from them, and explore additional incremental service offerings.
 customer connection.                     •   Build on existing data capture and technological developments such as container condition
                                              reports and container stowage software programs to improve the quality of the service
                                              offering to shipping lines and their customers.

 Operating costs                          •   Improve organisational capability and our teams’ wellbeing by continuing to invest in our
 Our operating costs directly impact          ‘culture of care’, through training and improved work practices.
 our profitability.                       •   Utilise fit for purpose asset management and port layout planning tools and processes to
                                              optimally manage the use and maintenance of our plant, machinery and port site assets.
                                          •   Harness data and technology to develop new cost-effective methods of providing our services.
                                          •   Manage peak cargo periods to minimise ship movements and ensure smooth cargo transfer.

You should read this table in conjunction with Section 2 (Napier Port and what it does) and Section 7 (Napier Port’s financial information).

                                                                                                                                                            02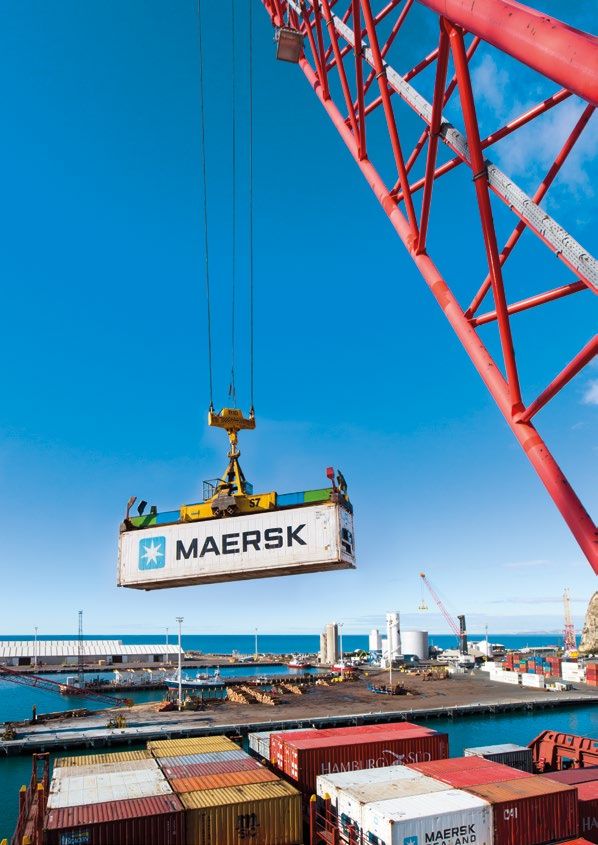
S E C T I O N 1 / key information summary

1.8	KEY RISKS AFFECTING
     THIS INVESTMENT
Investments in shares are risky. You should consider if the degree         China and other Asian market risk: Exports to Asian markets
of uncertainty about Napier Port’s future performance and returns          made up 84% of our total exported cargo volume by weight
is suitable for you. The price of these Shares should reflect the          in 2018 (65% to China)3. If access to these key markets was
potential returns and the particular risks of these Shares. Napier         impaired, or some other event occurred that resulted in demand for
Port considers that the most significant risk factors that could           cargo passing through the Port decreasing, it could have a material
affect the value of the Shares are:                                        adverse impact on our financial position and performance.
6 Wharf construction risk: We are committed to constructing                Cargo owner customer concentration risk: A significant
a new sixth wharf (as detailed in Section 2.7 (6 Wharf expansion           proportion of our revenue is from a small number of cargo owner
project)), which is planned to commence at the end of 2019 and             customers. Any loss, or decrease in demand from, key customers
be completed at the end of 2022. There is no assurance that the            may have a materially adverse effect on our financial performance.
construction of 6 Wharf will complete on time and on budget, or
                                                                           This summary does not cover all of the risks of investing in
at all. In addition, the construction may have an adverse impact on
                                                                           the Shares.
our operations.
                                                                           You should also read Section 2 (Napier Port and what it does),
Significant asset damage and interruption risk: A major
                                                                           including Section 2.7 (6 Wharf expansion project), Section 2.8
natural event, such as a tsunami or a significant earthquake,
                                                                           (Capital management), Section 2.9 (Industry overview) and Section
could destroy or damage our assets, which are essential to our
                                                                           2.20 (Other material governance disclosures), and Section 8
operations. If such an event was to occur, it is unlikely that our
                                                                           (Risks to Napier Port’s business and plans).
insurance policies would cover us for all of the damage.
Major Shareholder risk: Following completion of the Offer, the
Council (through HBRIC) will control 55% of the shares in Napier
Port Holdings. The Council will have material influence over Napier
Port. There is a risk that the Council’s interests may conflict with
the interests of other Shareholders.
Forestry sector risk: Our business is heavily dependent on
the forestry sector, particularly logs, woodpulp and timber.
Any decrease in the supply or demand for New Zealand or
Hawke’s Bay and surrounding areas’ forestry products could
have a significant adverse impact on our financial position
and performance. An example of this is the recent reduction of log
prices being paid by Chinese buyers.
Biosecurity risk: Our exports are primarily made up of primary
produce, including forestry products, pipfruit and meat. Any
significant biosecurity event could result in the supply or demand
for primary produce exported through the Port being materially
reduced, and could also increase the production costs for
growers and producers associated with ongoing quarantine and
monitoring processes.

3.
     Ministry of Transport (Freight Information Gathering System); 2018.

03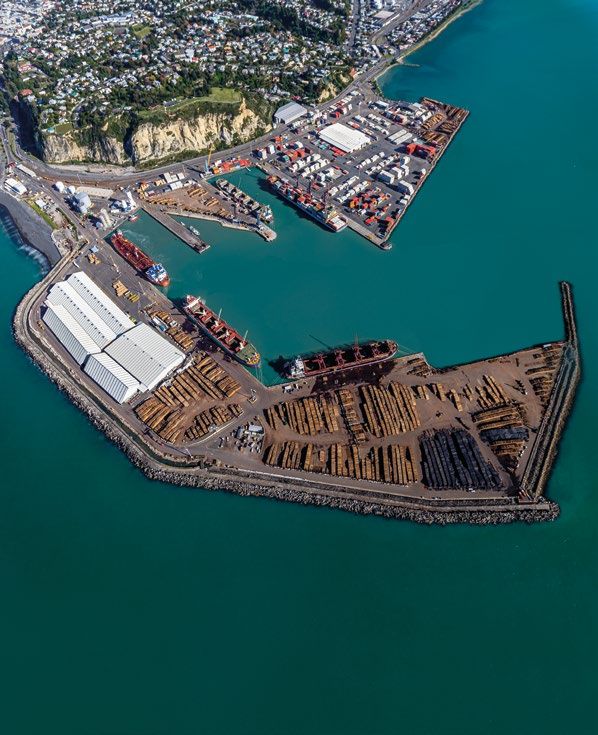
N A P I E R P O R T / P R O D U C T D I S C LO S U R E S TAT E M E N T

1.9        NAPIER PORT’S FINANCIAL INFORMATION
The financial position and performance of Napier Port are essential to an assessment of this Offer. You should also read Section 7
 (Napier Port’s financial information).

     Capitalisation Table

     Number of Shares being offered                                                                       90 million

     Number of Shares on issue following the Offer                                                        200 million

     Indicative Price Range                                                                               $2.27 - $2.60

     Implied market capitalisation                                                                        $454.0 million - $520.0 million

     Net Debt / (Cash) on completion of the Offer                                                         $(22.4) million

     Implied enterprise value                                                                             $431.6 million - $497.6 million

     Key investment metrics
                                                                                                          FY2019F                                   FY2020F

     Implied enterprise value / Pro forma EBITDA                                                          10.9x - 12.5x                             10.6x - 12.2x

     Price / Pro forma earnings per Share                                                                 23.6x - 27.1x                             22.7x - 26.0x

     Pro forma earnings per Share                                                                         $0.10                                     $0.10

     Price / Earnings per Share                                                                           81.2x - 92.9x                             22.7x - 26.0x

     Earnings per Share                                                                                   $0.03                                     $0.10

     Dividends declared per Share1                                                                                                                  $0.07

     Implied dividend yield – cash dividend declared1                                                                                               2.9% - 3.3%

     Implied dividend yield – gross dividend declared1                                                                                              4.0% - 4.6%
 	Dividends declared per Share, implied dividend yield – cash dividend declared and implied dividend yield – gross dividend declared for FY2019F have not been included as Napier Port
1.

   considers these metrics are not comparable due to the $44.0 million special dividend which has been declared and will be paid to HBRIC on completion of the Offer. See Section 3.1
   (Purpose of the Offer) and Section 7.6 (Dividends).

The above metrics should be read in conjunction with the assumptions and risks in Section 7 (Napier Port’s financial information)
and Section 8 (Risks to Napier Port’s business and plans).

1.10	APPLICANT WITHDRAWAL RIGHTS
In certain limited circumstances, including where a significant adverse development occurs prior to the Bookbuild, Applicants under
the Priority Offer may have the right to withdraw their Applications within a certain time period and have their Application Monies
refunded. You should also read Section 5.6 (Priority Offer Applicants’ withdrawal rights).

                                                                                                                                                                                          04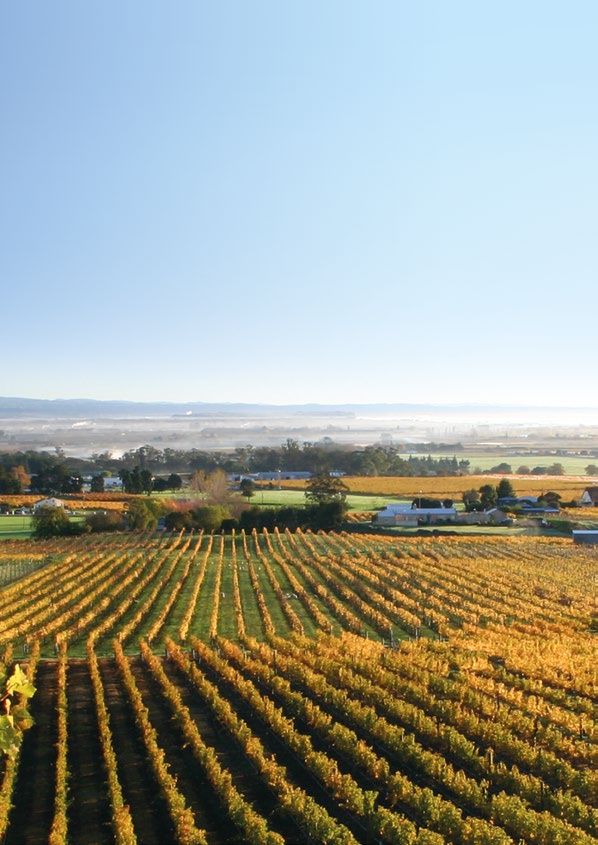
CONTENTS

1.    KEY INFORMATION SUMMARY                      1

      LETTER FROM THE CHAIR                        6

2.    NAPIER PORT AND WHAT IT DOES                 7

3.    PURPOSE OF THE OFFER                        51

4.    KEY DATES AND OFFER PROCESS                 52

5.    TERMS OF THE OFFER                          53

6.    KEY FEATURES OF THE SHARES                  57

7.    NAPIER PORT’S FINANCIAL INFORMATION         58

8.    RISKS TO NAPIER PORT’S BUSINESS AND PLANS   65

9.    TAX                                         71

10.   WHERE YOU CAN FIND MORE INFORMATION         71

11.   HOW TO APPLY                                72

12.   CONTACT INFORMATION                         73

13.   GLOSSARY                                    74

05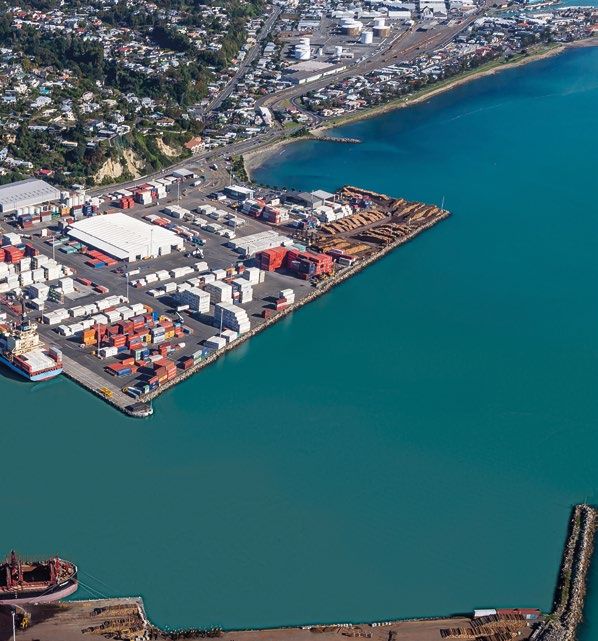
N A P I E R P O R T / P R O D U C T D I S C LO S U R E S TAT E M E N T

LETTER FROM
THE CHAIR

Na- to- rourou, na- taku rourou ka ora ai te iwi.
With your food basket and my food basket, the
people will thrive.

Te-na- koutou e nga- kaiwhakarato moni – Greetings Investors,
On behalf of the Napier Port board, I am delighted to invite you to
invest in our company.
For nearly 150 years, Napier Port has been connecting Hawke’s
Bay and the surrounding regions with the people and markets of
the world.
We operate a long-term regional infrastructure asset that supports    The planned wharf offers benefits including reduced on-Port
the Hawke’s Bay economy. Indeed, our strategic purpose is to          congestion, increased container vessel capacity and operating
continue to build a long term successful business by collaborating    efficiencies, and an ability to handle larger vessels and growth
with the people and organisations that have a stake in helping our    in cruise ship demand.
region grow.
                                                                      Funds raised from the issue of new Shares in this Offer will allow
We are New Zealand’s fourth largest port by container volume          Napier Port to pay off its current debt and allow it to finance
and have experienced growth in cargo volumes over the last 10         6 Wharf and the other investments necessary to achieve its
years. The Port is also the gateway to the Hawke’s Bay region for     aspirations from new borrowing and future retained earnings. The
an increasing number of cruise ship visits. These cruise visits are   Offer will also allow Hawke’s Bay Regional Investment Company
making a growing contribution to the Port and the broader region.     Limited (HBRIC) to realise part of its investment in Napier Port.
We have long standing collaborative relationships with many of the    Napier Port is currently 100% owned by HBRIC, the investment
world’s largest shipping lines. With our connections to the core      arm of Hawke’s Bay Regional Council (Council). HBRIC will
national road and rail networks, we also reach outside Hawke’s        retain a 55% stake following the Offer, reflecting the ongoing
Bay to the lower North Island and the east coast to the north of      support of Council and HBRIC to Napier Port and their desire to
Hawke’s Bay.                                                          remain involved in Napier Port as a long-term owner – alongside
Led by Chief Executive Todd Dawson, Napier Port has a                 new investors.
management team experienced in all aspects of the operation           This PDS contains important information about Napier Port and
and development of such an important regional asset. The team         the offer. We encourage you to read it carefully and consider, in
is also committed to our strategy of fostering strong connections     particular, Section 8 (Risks to Napier Port’s business and plans)
and relationships with our customers, our people and the broader      before making your investment decision.
Hawke’s Bay region to build on our success and fulfil the important
role we play in the community. In addition, we have an experienced    Naku- noa, Na-
board of directors with extensive experience in the port industry
and the finance sector and with listed company experience that will
assist Napier Port during the Offer period and going forward.
The combination of a robust regional economy, our position in the
country’s major transport routes and our experienced management
team, has underpinned the Port’s strong financial performance in
recent years.
We are committed to making further investments to support our         Alasdair MacLeod
role in Hawke’s Bay and the growth of the region for the future.      Chair
The centrepiece of this investment programme is our plan for a
new wharf, 6 Wharf.

                                                                                                                                                         06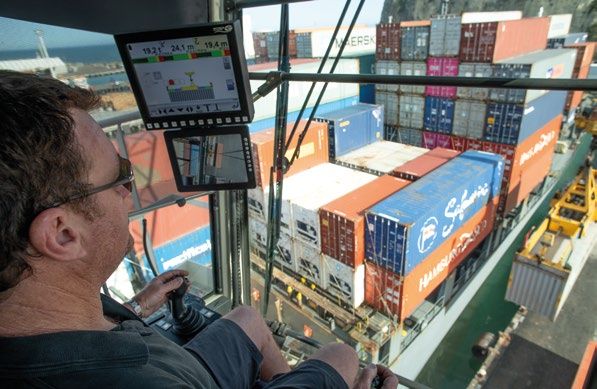
SECTION 2 /
NAPIER PORT AND WHAT IT DOES

2.1

OVERVIEW

                   4TH LARGEST   In this Section 2, we describe the business of
                   PORT BY       Napier Port, as well as other important matters that
                                 you should be aware of, including the proposed
                   CONTAINER
                                 6 Wharf construction (Section 2.7 (6 Wharf
                   VOLUME 5      expansion project)), our approach to capital
                                 management (Section 2.8 (Capital management))
                                 and matters relevant to our relationship with our
                                 major Shareholder (Section 2.20 (Other material
                                 governance disclosures)).
                   FY2018

                   5M+ TONNES    The Hawke’s Bay region is an $8.1 billion4 economy and a major
                                 New Zealand producer, processor and exporter of primary products
                   OF CARGO      supported by high sunshine hours and fertile soils. Key Hawke’s
                                 Bay primary products include logs, forestry products, pipfruit,
                                 vegetables, meat and wine.
                                 For nearly 150 years, Napier Port, currently New Zealand’s fourth
                                 largest port by container volume5, has been connecting Hawke’s
                   FY2018
                                 Bay and its surrounding regions with the people and markets of the
                   680+ SHIPS    world. We are located on the east coast of New Zealand’s North
                                 Island and benefit from a sizeable local cargo catchment. We are
                                 located on the main New Zealand transit route for international
                                 shipping services and we are connected with national road and
                                 rail networks.
                                 The role of the Port is to receive and process cargo, container and
                                 cruise ships arriving and departing by sea. We provide a range of
                                 port and logistics services, with our core revenue streams arising
                                 from container services, bulk cargo and cruise. In FY2018 we
                                 managed the arrival and departure of over 680 ships, carrying over
                                 five million tonnes of cargo and over 100,000 (2017/2018 cruise
                                 season) cruise passengers.

REVENUE BREAKDOWN                EXPORT / IMPORT SPLIT
FY2018                           FY2018, BY WEIGHT


  C ONTAINER                            EXPORTS
  SERVICES                              79%
      63%
                                        IMPORTS
      BULK CARGO                        21%
      32%
      CRUISE
      3%
      OTHER INCOME
      2%

                                 4.
                                      StatsNZ, nominal gross regional product for the year-ended Mar 2018.
                                 5.
                                      Deloitte Freight Yearbook 2019.

07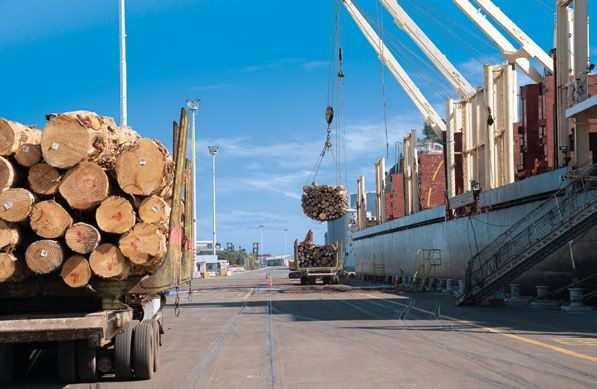
N A P I E R P O R T / P R O D U C T D I S C LO S U R E S TAT E M E N T

Our growth over the last 10 years has resulted in a strategic upgrade   Agreement. Upon the issuance of Offer Shares by Napier Port
of certain infrastructure being required so that we can support         Holdings under the Offer, HBRIC’s shareholding in Napier Port
ongoing growth and customer service standards. This includes            Holdings will be diluted from 100% to 55%.
plans to develop the new 6 Wharf (which has received all resource
                                                                        For further information on the Acquisition Agreement, see Section
consents expected to be required) shortly after completion of the
                                                                        2.20 (Other material governance disclosures – Acquisition
Offer and a third tugboat due to be operational by the end of 2019.
                                                                        Agreement) and the document titled “Other material information”
Napier Port Holdings will be the parent company of the Group            on the Offer Register.
and its shares will be listed on the NZX Main Board on completion
                                                                        See Section 8 (Risks to Napier Port’s business and plans – Major
of the Offer. Napier Port Holdings is currently a wholly owned
                                                                        Shareholder risk).
subsidiary of HBRIC, the investment arm of the Council. Port of
Napier is the operating company of the Group and will be acquired
by Napier Port Holdings prior to Listing pursuant to the Acquisition

PRE AND POST OFFER
OWNERSHIP STRUCTURE

                      PRE-OFFER STRUCTURE                                                     POST-OFFER STRUCTURE

                             COUNCIL                                             COUNCIL

                    100%                                                100 %

                               HBRIC                                               HBRIC                                          INVESTORS

                    100%                                                55%                                                                         45%

                                                                                               NAPIER PORT HOLDINGS

      PORT OF NAPIER                     NAPIER PORT HOLDINGS
                                                                                            100 %

                                                                                                    PORT OF NAPIER

                                                                                                                                                          08
S E C T I O N 2 / N A P I E R P O R T A N D W H AT I T D O E S

2.2
OUR HISTORY

Napier Port is a longstanding and established
business, originating in 1875. Our purpose is to
build a thriving region by connecting our customers,
people and community to the world.

1875                                1931                            1964                 1972              1973                   1988

                                                                            Ravensdown imports
                                                                            totalled 222,478
                                                                            tonnes

                                                                                                 Pan Pac on-Port
                                                                                                 pulp storage
              Napier Harbour                                                                     established
                                                                                                                   Napier Port
              Board incorporated                                                                                   reaches one million
                                                                                                                   tonnes of cargo

                                                  A major earthquake
                                                  hits Napier.
                                                                                                                         Port of Napier
                                                  The breakwater
                                                                                                                     incorporated as a
                                                  (at the Port’s current
                                                                                                                         limited liability
                                                  location) survives
                                                                                                                    company following
                                                  and all port activities
                                                                                                                          New Zealand
                                                  move to the current
                                                                                                                   Government reform
                                                  location
                                                                                                                     of the port sector
N A P I E R P O R T / P R O D U C T D I S C LO S U R E S TAT E M E N T
2009 2015 2018 2019 2022
May
Napier Port board Hawkes Bay
and management Regional Council
Construction
explore expansion votes to approve
of 4 Wharf and July
alternatives for Napier Port making
associated land Napier Port
the port a minority initial
reclamation reaches five million
completed public offering, and
tonnes of cargo
(an investment listing on the NZX
of approximately
$40 million) Napier Port November
completes Napier Port receives
development of resource consents
nearby land holding for 6 Wharf
on Thames Street
into a container Late 2019
storage facility Expected
commencement Expected
of 6 Wharf completion
Expansion Project of 6 Wharf
10S E C T I O N 2 / N A P I E R P O R T A N D W H AT I T D O E S
2.3
KEY BUSINESS STRENGTHS
1|
• Napier Port is an established long-term infrastructure
LONG-TERM asset that provides a key gateway linking Hawke’s Bay
INFRASTRUCTURE and its surrounding regions to global markets.
ASSET • The majority of our exporters are located within 100
kilometres of the Port, providing a nearby, cost effective
route to market.
• The Port is positioned on New Zealand’s main
shipping route with core national rail and road
network connectivity.
• A number of the world’s largest shipping lines
regularly call at the Port.
KEY INFRASTRUCTURE METRICS:
35 heavy 5 existing 6 mobile 50 hectares 1,000+
container wharves harbour of on-site connection points
handling (1.67 kilometres cranes port land for refrigerated
machines total length) cargoN A P I E R P O R T / P R O D U C T D I S C LO S U R E S TAT E M E N T
36,607 square 16 hectares of 10 hectares 2 tugboats with a
metres of dedicated container of dedicated third tugboat due to
warehousing terminal space log storage be operational by
space the end of 2019
12S E C T I O N 2 / N A P I E R P O R T A N D W H AT I T D O E S
2.3
KEY BUSINESS STRENGTHS
2| SUPPORTIVE
REGIONAL ECONOMIC
GROWTH DRIVERS
• Napier Port’s 6.5% compound annual growth in combined
export and import cargo throughput (by weight) over the last
10 years has been primarily driven by trade destined for, or
61%
originating from, Hawke’s Bay and its surrounding regions. OF NEW ZEALAND’S
• Hawke’s Bay is an $8.1 billion6 economy which has TOTAL PLANTED
experienced 4.4%6 compound annual growth in its gross PIPFRUIT AREA7
regional product over the last 10 years. It produces some
of New Zealand’s main primary sector commodities, having
approximately 61%7 of New Zealand’s total planted area of
pipfruit and approximately 8%8 of New Zealand’s total planted
•
forest area.
Hawke’s Bay’s growing profile as a tourism destination
8%
has supported growth in cruise ship visits through the Port, OF NEW ZEALAND’S
a trend that is expected to continue into the 2019/2020 TOTAL PLANTED
cruise season.
FOREST AREA8
For further information on Hawke’s Bay, see Section 2.4
(Our region).
NAPIER PORT THROUGHPUT
FY2009 TO FY2018, 000 TONNES
CAGR: 6.5%
6,000
5,088
5,000 4,755
3,987 4,105 4,067 3,916
4,000 3,643 3,713
3,416
3,000 2,894
2,000
1,000
0
FY2009 FY2010 FY2011 FY2012 FY2013 FY2014 FY2015 FY2016 FY2017 FY2018
Imports Exports
StatsNZ; nominal gross regional product for the year ended March 2018; compound
6.
annual growth of nominal gross regional product for the years ended March 2009 to
March 2018.
7.
Hawke’s Bay Regional Council - Regional Pest Management Plan 2018 - 2038.
The Ministry of Primary Industries, Te Uru Rakau, the New Zealand Farm Forestry
8.
Association and the New Zealand Forest Owners Association - National Exotic Forest
Description as at 1 April 2018.
13N A P I E R P O R T / P R O D U C T D I S C LO S U R E S TAT E M E N T
3| DIVERSIFIED
TRADE PORTFOLIO
• We are primarily export focused (with exports making up 79%
of all cargo by weight processed through the Port in FY2018)
but imports also contribute to our diversified trade portfolio.
• A number of different revenue streams across container
services, bulk cargo, cruise and other income.
• Over 30 export and import commodity products are handled
through the Port.
For further information, see Section 2.6 (Our operations).
NAPIER PORT EXPORT PRODUCT MIX NAPIER PORT IMPORT PRODUCT MIX
FY2018, BY WEIGHT FY2018, BY WEIGHT
LOGS FERTILISER
55% 34%
WOODPULP OIL PRODUCTS
12% 26%
TIMBER GENERAL CARGO
7% 15%
PIPFRUIT FOODSTUFFS
7% 10%
MEAT CEMENT
5% 5%
OTHER OTHER
14% 8%S E C T I O N 2 / N A P I E R P O R T A N D W H AT I T D O E S
2.3
KEY BUSINESS STRENGTHS
4| STRONG RELATIONSHIPS
WITH OUR CUSTOMERS,
PEOPLE AND COMMUNITY
• We have formed partnerships with a wide range of cargo
owner customers over many years, integrating ourselves into
their supply chains. These include providing port services
for over forty years to each of Pan Pac (a forestry products
business) and Ravensdown (a fertiliser business). For
examples of such partnerships, see Section 2.10 (Strategic
case studies).
• We work hard to maintain relationships with a number of global
shipping lines in order to provide a range of options for our
cargo owner customers. We currently have ten international
container shipping lines operating through the Port, across
six scheduled weekly services. See Section 2.9 (Industry
overview – Shipping line relationships).
• We maintain collaborative relationships with our customers,
people, unions, local iwi and central and local government.
• We recognise and respect the importance of the local and
wider Hawke’s Bay community to us. We acknowledge:
–– the need to generate trust and support in our operation of
the Port;
–– the benefit our customers receive from their use of local
infrastructure, including roads; and
–– our role in supporting Hawke’s Bay and its
surrounding regions.
• Napier Port has a sponsorship programme that supports
community initiatives, sporting events and environmental
projects, including the Napier Port Hawke’s Bay Primary
Sector Awards, the Napier Port Harbour to Hills multi-sport
event and the Waitangi-Lower Tu-taekuri Wetland.
For further information on our values and our engagement with the
Hawke’s Bay community, see Section 2.11 (Culture of care).
15N A P I E R P O R T / P R O D U C T D I S C LO S U R E S TAT E M E N T
WE MAINTAIN
COLLABORATIVE
RELATIONSHIPS
with our customers, people, unions,
local iwi and central and local government.
16S E C T I O N 2 / N A P I E R P O R T A N D W H AT I T D O E S
2.3
KEY BUSINESS STRENGTHS
5| 6 WHARF EXPANSION
PROJECT
• 6 Wharf is a long-term solution which will enable us to
capitalise on future growth opportunities and continue to
support our customers, and therefore Hawke’s Bay and its
surrounding regions.
• Benefits include reduced congestion, an ability to handle
larger vessels and growth in cruise ship demand, extending
the Port’s capacity to handle container vessels, an ability
For further details in relation to
to provide 24-hour berthing of larger container vessels and the 6 Wharf expansion project,
increased operational agility and resilience. see Section 2.7 (6 Wharf
• HEB, which is a member of the VINCI Group (as part of the expansion project) and Section
VINCI Construction International Network), has been engaged 8 (Risks to Napier Port’s
business and plans – 6 Wharf
as the main construction contractor so that the project can
construction risk).
commence shortly after completion of the Offer.
17N A P I E R P O R T / P R O D U C T D I S C LO S U R E S TAT E M E N T
6| STABLE
GROWTH
• Napier Port has delivered compound annual revenue and EBITDA growth of 8.1% and 8.7%
respectively, over the last ten years (FY2009 – FY2018).
• Forecast to deliver compound annual revenue growth of 5.7% from FY2018 – FY2020F and
consistent Pro forma EBITDA margins of approximately 40% in FY2019F and FY2020F.
• Forecast to deliver a gross dividend yield of between 4.0% and 4.6% in FY2020F.
For further information, see Section 6.2 (Dividend policy) and Section 7 (Napier Port’s
financial information).
NAPIER PORT REVENUE
FY2009 TO FY2018, $ MILLION
CAGR: 8.1%
$91.7
$86.7
$72.1 $72.7
$67.0
$60.3 $62.1
$54.1
$45.5 $48.8
FY2009 FY2010 FY2011 FY2012 FY2013 FY2014 FY2015 FY2016 FY2017 FY2018
NAPIER PORT PRO FORMA EBITDA
FY2016 TO FY2020F, $ MILLION AND % MARGIN
38.2% 40.7% 40.5% 40.7% 39.9%
$39.7 $40.9
$35.3 $37.2
$27.8
FY2016 FY2017 FY2018 FY2019F FY2020F
18S E C T I O N 2 / N A P I E R P O R T A N D W H AT I T D O E S
2.4
OUR REGION
The Hawke’s Bay region is a major producer,
processor and exporter of primary products
including logs, forestry products, pipfruit,
vegetables, meat and wine. For the year ended
31 March 2018, primary produce represented
12.2%9 of Hawke’s Bay gross regional product by
value, compared to the national average of 6.7%9.
AUCKLAND
TAURANGA
HAMILTON
ROTORUA
TAUPO GISBORNE
5 WAIROA
NEW
PLYMOUTH 1 2
OHAKUNE
NAPIER
3 HASTINGS
1 2
WHANGANUI
3
PALMERSTON
NORTH
1
2
1
WELLINGTON
ROAD RAIL RANGES
19N A P I E R P O R T / P R O D U C T D I S C LO S U R E S TAT E M E N T
HAWKE’S BAY IS A KEY PLAYER IN • Demand for log exports from New Zealand has grown
NEW ZEALAND’S FORESTRY INDUSTRY over recent years mainly due to growth in the Chinese
construction industry.12
• Hawke’s Bay has approximately 134,000 hectares10 of planted
forests (approximately 8% of New Zealand’s total planted • The Port is conveniently located for both cargo owners and
forest area) and its forestry exports represent approximately shipping lines and is an export gateway for logs and forestry
11%11 of New Zealand’s total forestry exports. products from Hawke’s Bay, as well as for some areas in the
surrounding regions.
• Forestry harvests in Hawke’s Bay have increased in volume
over recent years, and are expected to further increase • An increase in Hawke’s Bay forestry harvest volumes has
over approximately the next five years due to the significant contributed to the growth in the volume of forestry products cargo
programme of tree planting carried out in the mid-1990s exported through the Port from approximately 1.3 million tonnes
coming to maturity. Trees (predominantly pinus radiata) are in FY2009 to approximately 3.0 million tonnes in FY2018.
typically harvested 25 to 30 years after planting. The increased See Section 8 (Risks to Napier Port’s business and plans –
volumes experienced in recent years are expected to reduce in Forestry sector risk).
accordance with the planting and harvest profile after this next
five year period.
NAPIER PORT FORESTRY PRODUCT EXPORT COMPOSITION
FY2009 TO FY2018, 000 TONNES
2,996
3,000
2,500 2,442
2,106 2,001
2,000 1,966 1,950
1,742 1,724
1,603
1,500 1,305
1,000
500
0
FY2009 FY2010 FY2011 FY2012 FY2013 FY2014 FY2015 FY2016 FY2017 FY2018
Logs Woodpulp Sawn timber Woodchips Paper
HAWKE’S BAY FORESTRY PLANTING
1990 TO 2018, HECTARES
10,000
8,000
6,000
4,000
2,000
0
1990 1992 1994 1996 1998 2000 2002 2004 2006 2008 2010 2012 2014 2016 2018
Source: Forme Forest Industry Consultants.
Infometrics, 2018 Annual Economic Profile, Hawke’s Bay; Year ended March 2018.
9. 11.
Ministry of Transport (Freight Information Gathering System); 2018.
Primary produce defined as agriculture, forestry, fishing and mining. 12.
Ministry for Primary Industries. Situation and outlook for primary industries, June 2019.
10.
Ministry for Primary Industries, Te Uru Rakau, the New Zealand Farm Forestry
Association and the New Zealand Forest Owners Association - National Exotic Forest
Description as at 1 April 2018.
20S E C T I O N 2 / N A P I E R P O R T A N D W H AT I T D O E S
2.4
OUR REGION
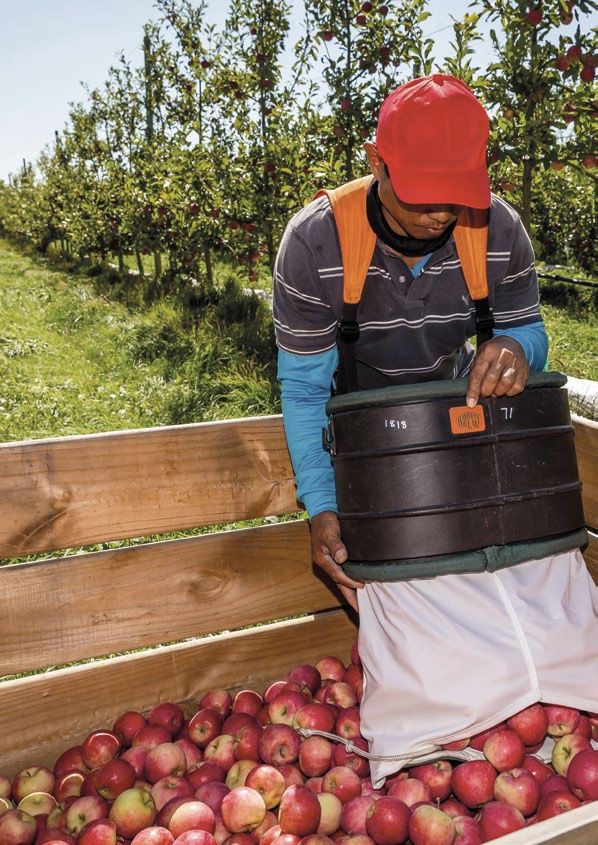
HAWKE’S BAY IS NEW ZEALAND’S • It is anticipated that approximately one million apple trees will
LARGEST APPLE AND PEAR be planted in New Zealand in 2019, with at least two thirds of
(PIPFRUIT) PRODUCER those plantings in Hawke’s Bay.16
• Hawke’s Bay is New Zealand’s main pipfruit producing region, • The Port is the most conveniently located export gateway for
with a total planted area of approximately 6,000 hectares13 of Hawke’s Bay pipfruit, given the close proximity of Hawke’s
pipfruit, representing approximately 61% of New Zealand’s Bay’s orchards to the Port and the need to quickly export the
total planted area of pipfruit.13 fruit following harvest.
• Apples are New Zealand’s third largest horticultural export by • An increase in Hawke’s Bay pipfruit harvest volumes has
value (following kiwifruit and wine).14 contributed to the growth in pipfruit cargo exported through
the Port from 17,368 TEUs in FY2009 to 23,917 TEUs
• New Zealand apple orchards are yielding an average of
in FY2018.
approximately 61 tonnes/hectare14, assisted by the adoption
of new growing strategies and technologies by local growers. • Napier Port has invested in purpose-built refrigerated
The global average yield for apple producing countries is container stacking towers to increase on-Port capacity for
approximately 23 tonnes/hectare.15 pipfruit and other perishable goods and to support product
quality requirements for those goods.
Section 8 (Risks to Napier Port’s business and plans –
Biosecurity risk).
NAPIER PORT PIPFRUIT EXPORTS
FY2009 TO FY2018, TEUs
23,201 23,917
22,094
21,007
19,025
17,368 18,018
16,267
14,575 15,141
FY2009 FY2010 FY2011 FY2012 FY2013 FY2014 FY2015 FY2016 FY2017 FY2018
13.
Hawke’s Bay Regional Council - Regional Pest Management Plan 2018 - 2038.
14.
FreshFacts 2018, The New Zealand Institute for Plant & Food Research Ltd.
15.
FreshFacts 2018, The New Zealand Institute for Plant & Food Research Ltd. Global
average yield based upon 33 countries.
16.
Apples & Pears New Zealand.
21N A P I E R P O R T / P R O D U C T D I S C LO S U R E S TAT E M E N T
61% 13
OF NEW ZEALAND’S
TOTAL PLANTED AREA
OF PIPFRUIT IS IN THE
HAWKE’S BAY REGION
22S E C T I O N 2 / N A P I E R P O R T A N D W H AT I T D O E S
2.5
OUR STRATEGY
Our strategy will guide how we manage our assets (see Section 2.7
(6 Wharf expansion project)), work with our customers to improve their
supply chains (see Section 2.10 (Strategic case studies)) and engage
our people (see Section 2.11 (Culture of care)).
OUR STRATEGY
OUR PURPOSE
TOGETHER WE BUILD A THRIVING REGION BY
CONNECTING OUR CUSTOMERS, PEOPLE AND
COMMUNITY TO THE WORLD
FOCUS AREAS
CUSTOMER HARNESS DATA NETWORKED COLLABORATIVE
CONNECTION & TECHNOLOGY INFRASTRUCTURE PARTNERSHIPS
OUR FOUNDATION
CULTURE OF CARE
23N A P I E R P O R T / P R O D U C T D I S C LO S U R E S TAT E M E N T
OUR FOCUS AREAS
CUSTOMER CONNECTION HARNESS DATA AND TECHNOLOGY
• Develop close customer relationships that help us • Capture data from customer supply chains and operations
to identify opportunities to deliver innovative logistics to deliver productivity gains for customers and Napier Port.
solutions and integrate us into our customer supply • Develop innovative technologies that create efficiencies
chains, with our business model extending beyond the for our customers and our Port operations.
Port gate.
• Use insights gained from these connections to inform our
investment decisions, both on and off the Port.
NETWORKED INFRASTRUCTURE COLLABORATIVE PARTNERSHIPS
• Connect our customers’ cargo to market with an • Work to develop collaborative partnerships with people
established and growing infrastructure network, operating and organisations, particularly those within the Hawke’s
as an integrated and intelligent system. Bay region, with shared interests and aspirations to
• Enhance our reach across our catchment area, and support our efforts to build a thriving region.
provide opportunities to develop further customer • Support our local community and the environment.
solutions, including through our off-Port sites, including
the Thames Street container depot and Whakatu
land holding.
OUR FOUNDATION
CULTURE OF CARE
• Support our strong and resilient culture which encourages
care for our people, the local community and the
environment. This ‘Culture of Care’ is the foundation of
our strategy and is pivotal to achieving our goals. See
Section 2.11 (Culture of care).
24S E C T I O N 2 / N A P I E R P O R T A N D W H AT I T D O E S
2.6
OUR OPERATIONS
We generate revenue by providing port and logistics services,
with core revenue streams arising from container services, bulk
cargo and cruise.
Napier Port’s on-site operations include marine, handling and
value-add services. Supporting our operations, we have a team
of engineers, electricians, carpenters and technicians that
maintain and service the Port’s infrastructure.
PORT ACTIVITIES ON-SITE SERVICES
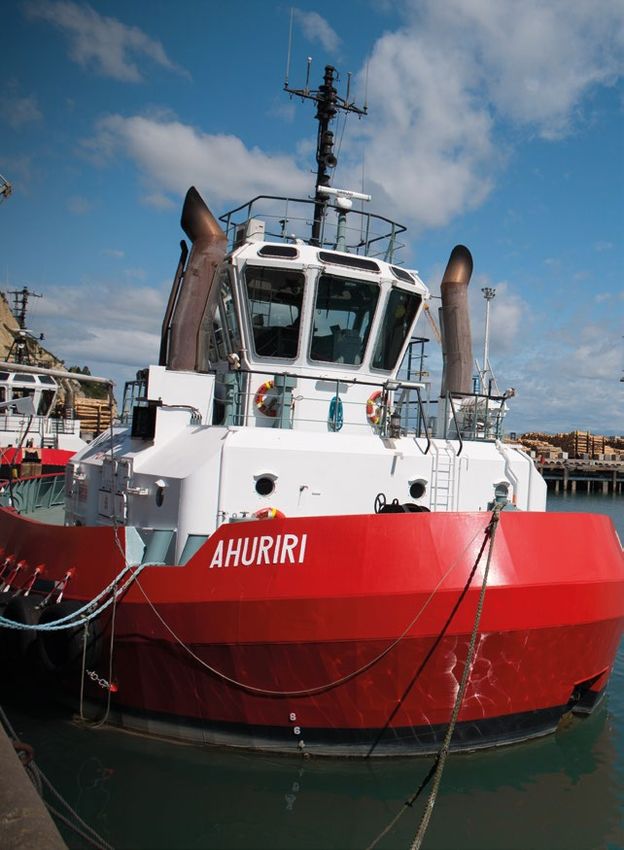
CONTAINERS BULK CARGO CRUISE MARINE SERVICES
• We handled over • We handled over three • We welcomed 70 • Marine services include
260,000 TEUs in million tonnes of bulk cruise ships and pilotage (ships being
FY2018, across a cargo in FY2018 over 115,000 guided through the
diverse range of dry • Exports represented cruise passengers channel by our pilots),
and refrigerated cargo 78% of our bulk in the 2018 / 2019 towage (manoeuvring
and empty containers cargo trade (by weight) cruise season vessels by tugboat)
• Exports represented in FY2018 and berthage and
approximately 80%17 mooring services
of our container trade • Marine services revenue
(by TEU) in FY2018 is based on a fixed all-in
fee depending on the
vessel’s length
Excluding empty and other
17.
container movements.
25N A P I E R P O R T / P R O D U C T D I S C LO S U R E S TAT E M E N T
HANDLING SERVICES VALUE-ADD SERVICES OTHER ON-SITE
• We conduct handling services We have implemented a range SERVICES
for containers, which involve all of value-add services to grow Other services provided
container movements between our service offering, integrate on-site include the leasing
the entrance gate and the vessel us into the supply chains of of four hectares of Port
our customers and attract new space to bulk cargo owners
• Handling services for bulk cargo
customers, in particular from for storage purposes and the
are predominantly conducted by
surrounding regions. These provision of Port space for
external service providers and
services include Port Pack (an external providers to offer
involve all cargo movements
on-site container packing and log fumigation services
between the entrance gate and
unpacking facility operated by (Napier Port is one of only
the vessel
Napier Port) and depot services three ports in New Zealand
• We contract with an external which offers this)
(surveying, cleaning, repairing,
stevedoring company, which
pre-trip inspections and storage
provides on-board stevedore
of containers)
services (guiding and lashing
containers onto vessels)
26S E C T I O N 2 / N A P I E R P O R T A N D W H AT I T D O E S
2.6
OUR OPERATIONS
CONTAINERS A significant portion of containers imported through the Port
EXPORT-DRIVEN DIVERSIFIED TRADE are empty containers required by regional exporters (constituting
approximately 75% of all TEU imported through the Port
Our container trade is predominantly export driven (accounting for
in FY2018).
approximately 80%18 of our container trade by TEUs in FY2018),
and consists of a diverse range of primary produce, including Increasing the proportion of imported TEUs containing goods
forestry products, pipfruit and meat. provides us with a potential future opportunity to grow our position
as an import gateway, improve our revenue and provide two-way
Our service offering includes marine, handling and value-add
income for shipping lines.
services such as depot services, Port Pack and empty container
storage at the Thames Street container depot. Our ability to service larger container vessels is currently
constrained at the Port. The planned new 6 Wharf will extend
Approximately 40% of our exported containers by TEU are
the Port’s container vessel operating capability and capacity. For
refrigerated containers (reefers) carrying perishable primary
further information in relation to the 6 Wharf expansion project, see
products. Reefer exports are high-value cargo to global shipping
Section 2.7 (6 Wharf expansion project) and Section 8 (Risks to
lines, which assists in encouraging shipping lines to call at the Port.
Napier Port’s business and plans – 6 Wharf construction risk).
CONTAINERS – EXPORT PRODUCT MIX CONTAINERS – IMPORT PRODUCT MIX
FY2018, BY TEU18 FY2018, BY TEU18
WOODPULP GENERAL CARGO
22% 47%
TIMBER CANNED / OTHER FOOD
20% 17%
PIPFRUIT FROZEN FOODSTUFFS
19% 9%
MEAT PAPER
12% 9%
CANNED / OTHER FOOD MANUFACTURED ITEMS
8% 5%
FRESH PRODUCE FERTILISER
6% 4%
OTHER OTHER
13% 7%
CONTAINERS – EXPORT DESTINATION MIX
FY2018, BY TEU18
CHINA
34%
ASIA (EXCL. CHINA)
29%
EUROPE
13%
AUSTRALIA / PACIFIC
11%
USA
9%
OTHER
4%
18.
Excluding empty and other container movements.
27N A P I E R P O R T / P R O D U C T D I S C LO S U R E S TAT E M E N T
CONTAINER VOLUMES
FY2009 TO FY2020F, 000 TEUs
300 288
266 269 272
256 257
250
220
204 206
200 181 188
167
150
100
50
0
FY2009 FY2010 FY2011 FY2012 FY2013 FY2014 FY2015 FY2016 FY2017 FY2018 FY2019F FY2020F
Full Empty
Note: Full container includes DLRs; Increase in FY2017 container volumes partially due to the impact of the Kaikoura earthquake on CentrePort Wellington.
28S E C T I O N 2 / N A P I E R P O R T A N D W H AT I T D O E S
2.6
OUR OPERATIONS
BULK CARGO provided by third-party providers. In addition, we lease sheds, silos
LOGS DRIVE CARGO VOLUMES and tanks (or the ground on which such structures are affixed) to
bulk cargo owners.
The principal bulk cargo exports through the Port are log and
forestry products, while the principal bulk cargo imports are Logs account for a significant portion of our total bulk cargo
fertiliser, petrochemicals and cement. throughput (72% by weight in FY2018). Logs represent an
opportunity for increased trade for us over approximately the next
We maintain close relationships with cargo owners, including three
five to ten years as forests planted in the mid-1990s in Hawke’s
forestry estates, eight logging exporters and more than 10 general
Bay and surrounding regions mature for harvest and potential
cargo producers and importers.
export as they approach 25-30 years since planting.
Our service offering to bulk cargo owners includes marine services,
handling services and log fumigation facilities with some services
BULK CARGO – EXPORT PRODUCT MIX BULK CARGO – IMPORT PRODUCT MIX
FY2018, BY WEIGHT FY2018, BY WEIGHT
LOGS FERTILISER
93% 49%
WOODPULP OIL PRODUCTS
4% 41%
TIMBER CEMENT
1% 7%
OTHER OTHER
3% 4%
BULK CARGO – EXPORT DESTINATION MIX
2018, BY WEIGHT19
CHINA
85%
INDIA
5%
JAPAN
4%
SOUTH KOREA
2%
OTHER
4%
19.
Ministry of Transport (Freight Information Gathering System), 2018.
29N A P I E R P O R T / P R O D U C T D I S C LO S U R E S TAT E M E N T
BULK CARGO VOLUMES
FY2009 TO FY2020F, 000 TONNES
3,500 3,380 3,317
3,071
3,000
2,445 2,506
2,500 2,370
2,240 2,156 2,185
2,072 2,025
2,000
1,696
1,500
1,000
500
0
FY2009 FY2010 FY2011 FY2012 FY2013 FY2014 FY2015 FY2016 FY2017 FY2018 FY2019F FY2020F
Logs Other
30S E C T I O N 2 / N A P I E R P O R T A N D W H AT I T D O E S
2.6
OUR OPERATIONS
CRUISE In the 2018/2019 cruise season, we hosted over 115,000
HAWKE’S BAY IS A POPULAR passengers on 70 cruise ship calls, including six visits from
TOURIST DESTINATION Ovation of the Seas (a 348-metre cruise ship which can hold
approximately 4,900 passengers), the largest cruise ship visiting
Hawke’s Bay offers a wide range of tourist attractions including
New Zealand waters.
vineyards and wineries, golf courses, festivals, museums, and
restaurants as well as Napier’s renowned Art Deco architecture. Based on advanced cruise ship bookings, the number of cruise
ship calls to the Port is forecast to increase to approximately 87
We are the gateway to the Hawke’s Bay region for the growing
for the 2019/2020 cruise season. Cruise lines typically book up to
number of cruise visits and we are one of the key ports of
two years in advance, providing visibility for capacity planning and
call for cruise ships in New Zealand. Cruise tourism has
financial forecasting purposes. Our ability to service the growing
grown in popularity over recent years. Globally, the number of
demand for cruise ship visits is currently constrained by congestion
people taking cruises increased from 24.7 million in the year
and 6 Wharf will relieve some of this congestion (see Section 2.7
ended 31 December 2016 to 28.5 million20 in the year ended
(6 Wharf expansion project)).
31 December 2018 (7.7% CAGR). The number of cruise visitors
to New Zealand has grown from approximately 237,000 in the
year ended 30 June 2016 to approximately 259,000 passengers
in the year ended 30 June 2018 (4.6%21 CAGR).
CRUISE SHIP VISITS
2013/2014 SEASON TO 2019/2020F SEASON, NUMBER OF CRUISE SHIP VISITS
87
70
56 54 57
47 45
2013/2014 2014/2015 2015/2016 2016/2017 2017/2018 2018/2019 2019/2020F
season season season season season season season
20.
Cruise Industry Ocean Source Market Report: Australia 2016 & New Zealand 2018.
Stats NZ; Unique cruise passengers to New Zealand (number of passengers), 30 June 2016 to 30 June 2018.
21.
31N A P I E R P O R T / P R O D U C T D I S C LO S U R E S TAT E M E N T
OFF-SITE SERVICES EMPLOYEES 22
We have developed certain off-site services and opportunities to Labour represents a significant cost in our business, making up
develop further customer solutions: approximately 50% of operating expenses for FY2018.
• 11.6 hectares of off-site container storage capacity at nearby We employ over 280 people of which approximately 76% are
Thames Street container depot. directly involved in container, bulk cargo and cruise operations
• 12.3 hectares of off-Port land holding in nearby Whakatu and handling. Approximately 30% of our employees have been
held for the purposes of potential development into an off-site with Napier Port for over 10 years.
port facility, providing us with an opportunity to expand our Approximately 70% of our employees are party to collective
storage capacity. employment agreements across three different unions. The
• a 1.9 hectare container yard and a warehousing facility at the most significant union by number of employees is the Rail and
Manawatu Inland Port which is connected by rail and road Maritime Transport Union (RMTU) (covering 156 employees).
across the lower North Island through to the Port. Napier Port will be required to negotiate a new collective
employment agreement with the RMTU, with the current
agreement expiring on 30 September 2019.
We have not experienced any industrial action for more than
10 years, which we believe is a reflection of the importance
we place on healthy engagement with our people and the
collaborative relationships we endeavour to maintain with
the unions represented at Napier Port. Napier Port has a
predominantly unionised workforce, whose unions and their
members are afforded a number of rights and obligations under
the Employment Relations Act 2000.
22.
Information as at 31 March 2019.
32S E C T I O N 2 / N A P I E R P O R T A N D W H AT I T D O E S
2.7
6 WHARF 2022
EXPANSION TARGET
PROJECT COMPLETION
DATE
The 6 Wharf expansion project will enable us to
address current operational constraints, capitalise
on future growth opportunities and continue to
support our customers, and therefore Hawke’s
Bay and its surrounding regions. The project is 3 WHARF
planned to commence at the end of 2019 and, on 2 WHARF
the basis of this commencement date, is expected
to be completed in 2022. There are risks associated 1 WHARF 4 WHARF
with the 6 Wharf expansion project – see Section 8
(Risks to Napier Port’s business and plans –
6 Wharf construction risk).
6 Wharf will be a multi-purpose 350 metre length wharf, planned 5 WHARF
to be located along the northern face of the existing container
terminal. The 6 Wharf expansion project includes a dredging
programme which will create a new vessel turning area. The
project has received all resource consents expected to be required,
with other construction related consents such as building consents
still to be obtained.
The key operational benefits of the 6 Wharf expansion
project include: 6 WHARF
• Reduced congestion: 6 Wharf will improve operating efficiency
by reducing secondary vessel movements (temporarily moving
vessels off wharves to accommodate other vessels) by an
estimated 100 movements per year
• Ability to handle larger vessels: 6 Wharf will be able to handle
container ships up to 320 metres in length and cruise ships up
to 360 metres in length
• Extending the Port’s container vessel capacity
• Allowing berthing for larger container vessels 24-hours per day
• Operational agility: 6 Wharf will be used for both container and
HEB has been engaged as the main construction contractor and
cruise ships, and will be capable of supporting twin lift gantry
Beca Group has been engaged to provide design and engineering
cranes if required in the future
services. HEB has been engaged pursuant to the binding Letter
• Operational resilience: 6 Wharf’s design improves the Port’s Agreement, which entitles Napier Port to require HEB to execute
potential resilience to a significant seismic event the Construction Contract within a specified timeframe and
then commence carrying out the contract works under and in
There will be an impact on our operations during the period that accordance with the Construction Contract. The Letter Agreement
6 Wharf is under construction, principally through the reduction sets out the contract price for the construction, dredging and
of the operational area for the existing container terminal. related works. The contract price is subject to finalisation based
We are managing this risk through the development of detailed on certain fuel price movements, currency fluctuations and steel
plans for capacity management and expected traffic movements, pricing as well as agreed changes arising from value engineering
health and safety management planning and through the ability undertaken in accordance with the Letter Agreement. Once the
in the Construction Contract to prioritise shipping operations by Construction Contract is executed, the contract price is fixed
temporarily suspending construction works. To create more space other than in respect of certain measure and value items and also
at our main port site we are planning to move components of the subject to cost fluctuation for fuel pricing (unless Napier Port
empty container depot service operation to our Thames Street site. elects to supply the fuel). A more detailed summary of the Letter
However, there are still risks that 6 Wharf expansion project may Agreement and the Construction Contract is available on the Offer
have to our operations – see Section 8 (Risks to Napier Port’s Register – see section 3.4 (Material contracts – Summary of Letter
business and plans – 6 Wharf construction risk). Agreement and Construction Contract) of the document titled
“Other material information”.
33N A P I E R P O R T / P R O D U C T D I S C LO S U R E S TAT E M E N T
2.8
350 $173M – CAPITAL
METRES $190M MANAGEMENT
LENGTH ESTIMATED
COST
Napier Port’s board has determined to target a ratio of Net Debt to
EBITDA in the range of 2.0x – 3.0x over the long term. The Board
has determined that targeting a ratio of Net Debt to EBITDA of no
greater than 3.5x is appropriate through the 6 Wharf construction
period, with the expectation that Napier Port’s Net Debt to
EBITDA ratio will be managed to within its long-term target range
over time, following completion of 6 Wharf.
Immediately after completion of the Offer, Napier Port is expected
to have cash of approximately $22 million and $180 million
available under new debt facilities. This cash and the funds
available under the debt facilities are intended to be applied
towards costs associated with the 6 Wharf expansion project and
general corporate purposes. The Board views that, immediately
following the Offer, Napier Port will have sufficient balance sheet
capacity to fund the expected construction costs of 6 Wharf and to
pay dividends from Free Cash Flow during the 6 Wharf investment
and construction period and beyond. For a description of our
dividend policy, see Section 6.2 (Dividend policy).
The financial covenants applicable to the new debt facilities include
a limit of Net Debt to EBITDA ratio of 4.5x (1.0 x greater than
the Board’s targeted level). The Board does not expect to need to
exceed its targeted level of 3.5x during the 6 Wharf construction
period. However, there are risks associated with Napier Port’s
operations, specifically project execution and operational risks
associated with the 6 Wharf expansion project, which could impact
Napier Port’s targeted Net Debt to EBITDA ratio. These risks are
The 6 Wharf expansion project is estimated to cost outlined in Section 8 (Risks to Napier Port’s business and plans).
$173-190 million, excluding capitalised interest and The Board has considered these risks when establishing Napier
overheads. The expected project cost includes the Port’s capital management and dividend policies.
costs provided for under the Construction Contract with
HEB (approximately $147 million), other costs directly The Board will review its debt facility limits regularly to ensure it
associated with the project (for example, mooring has sufficient flexibility to enable Napier Port to meet its ongoing
system procurement, engineering, project management capital and general corporate requirements.
and environmental) and an estimate of specific and While Napier Port will be in a net cash position immediately
overall project contingencies. The investment meets following the Offer, the Board intends to manage interest costs
Napier Port’s internal long-term return thresholds. and the risk of volatility as it draws on its banking facility through
The net proceeds from the Offer received by Napier an appropriate hedging policy.
Port will be used to pay down existing debt and provide
capital structure capacity to fund the 6 Wharf expansion
project through Napier Port’s cash on balance sheet
and new debt facilities (see Section 2.8 (Capital
management) and Section 3 (Purpose of the Offer).
34You can also read