A NEW BANKING MODEL FOR AFRICA: Lessons on digitization from four years of operations - International Finance ...
←
→
Page content transcription
If your browser does not render page correctly, please read the page content below

A NEW BANKING
MODEL FOR AFRICA:
Lessons on digitization from
four years of operations
By Christian Rodriguez, Julia Conrad, Gisela Davico, Susie Lonie
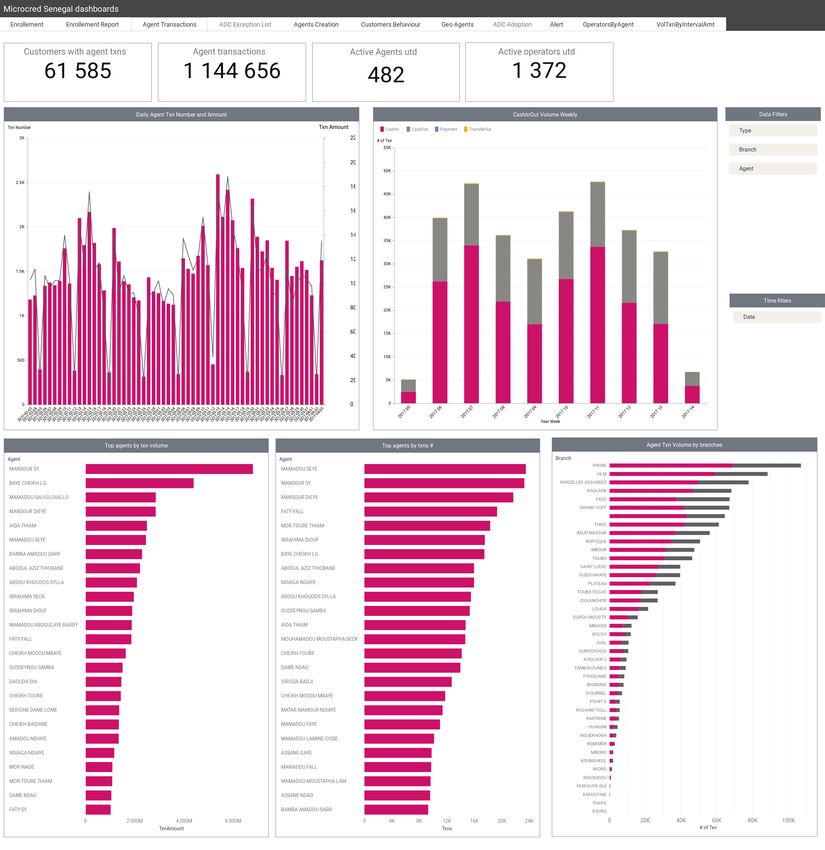
Table of Contents
    Executive Summary............................................................................................................                      5
    Overview............................................................................................................................ 6
    Study Background...............................................................................................................                    8
    Lessons Learned.................................................................................................................. 11
    (I) Planning a Digital Financial Service (DFS) rollout............................................................. 11
             Objectives .............................................................................................................................. 11
             Regulatory environment ........................................................................................................ 12
             Business case ........................................................................................................................ 12
             Approach .............................................................................................................................. 15
             Roll-out................................................................................................................................. 16
             Technology ............................................................................................................................ 17
    (II) Managing a DFS........................................................................................................... 18
             Agent recruitment ................................................................................................................. 18
             Network growth.................................................................................................................... 19
             Agent incentives .................................................................................................................... 21
             Smart tools ........................................................................................................................... 22
             Liquidity management ........................................................................................................... 24
    (III) Promoting DFS usage and activity ............................................................................... 26
             Change management ............................................................................................................           26
             Customer activity .................................................................................................................. 27
             Product design ......................................................................................................................    30
    (IV) Ensuring DFS sustainability.......................................................................................... 30
             Sustainability .......................................................................................................................   30
             Geographic expansion ............................................................................................................ 33
             Innovation ............................................................................................................................ 33
             Savings mobilization............................................................................................................... 33
    Present progress and outlook............................................................................................. 34
    Conclusions....................................................................................................................... 39
    Annex ............................................................................................................................... 41

2
TABLES
Table 1: DFS definitions........................................................................................................................ 4
Table 2: Agent liquidity management solutions observed as part of study.............................................. 25

FIGURES
Figure 1: Population above 15 years-old in millions, 2017......................................................................... 8
Figure 2: Gross National Income per capita 2017 (Atlas Method, in US dollars)......................................... 8
Figure 3: Life expectancy at birth in years.............................................................................................. 8
Figure 4: DFS market overview as of December 2017.............................................................................. 9
Figure 5: DFS approaches of study institutions as of December 2017...................................................... 10
Figure 6: Median customer and agent activity rates over course of the study......................................... 13
Figure 7: Average cash-in and cash-out amounts in US dollars over course of the study........................... 13
Figure 8: Agent median cash-in versus cash-out shares over course of the study.................................... 14
Figure 9: Branches (right y-axis), non-HQ staff and agent network size
(both left y-axis) over data reporting period......................................................................................... 16
Figure 10: Monthly agent network growth rates over the operational lifetime...................................... 20
Figure 11: End-month values of active customers per active agents in 2017 ............................................ 20
Figure 12: End-month values of average transaction volume per active agent
in 2017 in US dollars............................................................................................................................ 21
Figure 13: End-month values of average commission income volume per active agent
in 2017 in US dollars............................................................................................................................ 22
Figure 14: Example of a daily operations dashboard.............................................................................. 23
Figure 15: Share of DFS transactions over data reporting period ...........................................................                     26
Figure 16: Customer registration and activity (in 1,000s) over data reporting period .............................. 28
Figure 17: Shares of DFS transactions as of December 2017.................................................................... 34

                                                                                                                                                       3
Table 1: DFS definitions1
DFS Definition
A network of banking agents. More generally, an agent is any third-party acting on behalf of a financial
institution or a non-bank institution to deal directly with customers, under contractual agreement. Here,
agents are contracted by a bank (bank agents) to provide services on their behalf, most importantly cash-in
and cash-out. Agents may (if permitted under local regulations) engage sub-agents to carry out activities on
behalf of the financial institution.
• Proprietary versus non-proprietary (third party): A proprietary agent network is a network the
financial institution recruits, equips, manages, and brands itself. A non-proprietary (third party) agent
network is a network that is owned, equipped, managed, and branded by an external partner, such as a
Mobile Network Operator or other payment network.2
AGENT
• Exclusive versus non-exclusive: An exclusive agent serves only one Digital Financial Service provider. An
NETWORK
agent who serves more than one DFS providers is non-exclusive.
• Dedicated versus non-dedicated: Dedicated agents only conduct DFS business for one or multiple
providers. More common though is that agents also run other kinds of businesses, known as non-
dedicated agents.
• Static versus roving (mobile): A roving (or mobile) agent is (part-time) moving through villages, market
areas, etc. It is a “doorstep service” that serves customers where they live and work rather than making
them find the nearest static agent outlet. The service is especially applicable to the collection of daily
savings from market traders.
Mobile banking (or m-banking) is a service provided by a bank or other financial institution that allows its
customers to conduct conventional financial transactions remotely using a mobile device such as a simple
feature phone, smartphone or tablet.
• USSD versus application: Unstructured Supplementary Service Data (USSD) technology is similar
MOBILE
to Short Messaging Service, but, unlike SMS, USSD transactions occur during the session only. USSD
BANKING
is accessible from any type and model of mobile phone and therefore is currently the best available
technology to deliver mobile financial services to low-income customers. Mobile banking via application
requires a smartphone or tablet with internet access – which low-income populations often still lack.
Internet banking (or e-banking) is an electronic payment system that enables customers of a bank to conduct
INTERNET
a range of financial transactions through the financial institution’s website.
BANKING
A debit card is a bank card that allows bank account holders to pay third parties directly from their account
DEBIT CARD balances electronically. If the available funds on the account are insufficient, the transaction is not completed.
Unlike a debit card, a prepaid card is not linked to a bank account. Generally, when a customer uses a prepaid
PREPAID
card, he or she is using money that has been loaded onto the card in advance.
CARD
1 See AFI “Digital Financial Services Basic Terminology” 2016: https://www.afi-global.org/sites/default/files/publications/2016-08/Guideline%20Note-19%20
DFS-Terminology.pdf
2 See the Mastercard Foundation & BFA “Alternative Delivery Channels for Financial Inclusion: Opportunities and Challenges in African Banks and
Microfinance Institutions” 2016: https://mastercardfdn.org/wp-content/uploads/2018/06/BFA_ADC_FIpaper_April2017-Accessible.pdf
4EXECUTIVE SUMMARY
The ongoing Fourth Industrial Revolution is a technological By the end of the study period, the participating institutions
transformation that is changing the way we live, work and had overcome many external and internal challenges and were
communicate. It is altering every aspect of our society and successfully running their digital channels. Channel maturity
economy, including the financial sector. In Sub-Saharan Africa, varied among institutions. Five of the financial institutions
44 percent of the population subscribed to mobile services in expanded their original DFS scope to explore other service
2017. By 2025, the number of subscribers is expected to grow offerings. Lessons from the study centered around four main
to 52 percent, and 87 percent of those subscribers are expected themes: strategy and business case, staff buy-in, data, and
to have mobile broadband access.3 Results of the 2017 Global DFS management. The research team also documented the
Findex survey reveal significant progress in financial inclusion impact of DFS on outreach and banking operations.
driven by a new generation of financial services accessed
through mobile phones and the internet. Still, with 57 percent Study results show that digital strategies are dynamic,
of its population lacking any form of bank account, Sub- requiring constant readjustment based on client feedback
Saharan Africa remains the region with the greatest potential and changes in market conditions. Although all FIs had a
for the adoption of Digital Financial Services (DFS).4 compelling business plan and strategy before developing
their DFS, these had to be constantly fine-tuned and
From 2014 to 2018, IFC and the Mastercard Foundation adopted to successfully grow their businesses. The original
conducted a longitudinal study with nine partner financial DFS assumptions, in particular around client outreach and
institutions (FIs) in seven Sub-Saharan African countries uptake, had to be adjusted to the realities of financial services
to understand if Digital Financial Services are a viable providers. Moreover, a digital strategy requires internal
strategy for these institutions to expand financial access. support from staff, and a financial institution has to define
More precisely, the study explains the strategic objectives ways to overcome their clients’ initial resistance and fear of
of the institutions and describes how they planned and going digital. The study also revealed that most successful
implemented their DFS rollouts. The study aimed at extracting DFS implementations used strong data-driven approaches to
lessons on implementing internal change management, as monitor and assess DFS operations and they are using those
well as measuring the impact DFS has on business growth, insights to refine products and services, thereby improving
sustainability, outreach and adoption. The study is unique customer service and the overall experience. That said, given
as it identifies valuable benchmarks on DFS implementation that most FIs in the study started their DFS offering from
that fit the banking context, which differs from many scratch, internal capacities needed to be built and the costs
studies in the existing literature that focus on MNO-led DFS for that development were often higher than anticipated. The
implementations. It serves as a guide for target-setting and institutions also had to learn how to assess and work with
strategic engagement of FIs seeking to implement or scale external partners (i.e. mobile network operators, technology
digital channels. The study also differentiates itself by focusing companies, among others). For several of the participating FIs,
on many institutions over multiple years and countries. managing partnerships was a challenge. With respect to agent
banking, FIs saw the importance of prioritizing quality over
quantity, and providing the right incentives to network agents.
3 See GSMA “The Mobile Economy Sub-Saharan Africa 2018”: https://www.gsma.com/mobileeconomy/sub-saharan-africa/
4 See World Bank Global Findex Database 2017 “Account (% age 15+)”, retrieved from: https://globalfindex.worldbank.org/
5OVERVIEW
From 2014 to 2018, IFC and the Mastercard Foundation
conducted a research study on the implementation of Digital
Financial Services with nine financial institutions across The Longitudinal Study on Digitizing
seven markets in Sub-Saharan Africa. The objective was to Distribution Channels
understand implementation strategies, the effect of digital
channels on business models, and the impact of digital The Partnership for Financial Inclusion is a $37.4 million
transformation on the institutions. This report shares the joint IFC-Mastercard Foundation initiative to expand
findings and best practice insights gained from the research. and advance Digital Financial Services in Sub-Saharan
Africa. Under this Partnership, the Longitudinal Study is
All nine FI partners successfully implemented digital channels a four-year cross-country applied research project that
over the study period, some starting earlier than others. documents the experience of nine financial institutions
Although all the institutions faced significant external in seven Sub-Saharan Africa countries. In identifying
challenges (e.g. regulation, market context), as well as internal best-practices, the study also supports the FIs towards
challenges (e.g. staff resistance, technology incompatibility), implementing digital delivery channels (agent networks,
by 2018 the first FIs had outsourced significant shares of their mobile banking, debit cards, etc.) as part of their business
transactions to the digital channels. The institutions with operations.
more mature channels are reporting that they are on their way
to reaching financial sustainability and are already covering The study employs a mixed-methods research approach,
agent commission costs with generated fee income. Several combining quantitative and qualitative data collection
institutions are expanding the initial strategic scope of DFS to at the institutions with structured interviews and user
explore additional DFS offerings. feedback:
The study identifies a number of lessons from FIs with • Qualitative questionnaires: Between Q2 2014
established digital channels and presents best-practices for and Q1 2018, a research team conducted four
financial institutions planning new digital channels. The key rounds of visits at the nine bank partners in Sub-
findings of the study are: Saharan Africa. Structured interviews guided all
meetings with the FI management and department
• Digital channels provide a viable business model for representatives and were later adapted to the
microfinance Institutions (MFIs). individual context of each participating institution.
• Digital channels are effective for reaching new customers These interviews touched on multiple aspects of
and expanding financial inclusion. DFS implementation, such as strategy, regulation,
• FIs should draw on strategies, best-practices and partnerships, markets and products, distribution,
benchmarks that are appropriate for the banking sector technology, risk management, business model, and
to successfully implement digital channels. Business other operational considerations.
models and benchmarks established from other sector
actors, such as mobile network operators (MNOs), are not • Quantitative data: Eight institutions that
replicable in a traditional financial sector context. implemented digital delivery channels provided
• Change management strategies are vital to support quarterly data on outreach, transaction flows,
internal and external organizational changes. staffing, fee revenue and operating costs of the
respective channels. Although nine participated
in the study, one institution delayed its DFS
implementation to Q4 2017 and comparative data
was therefore not collected at this time. All data was
collected from January 2015 to December 2017, with
a later reporting start of FIs that launched their DFS
after January 2015. An analysis of the data describes
how digital channel implementations have evolved
and affected the overall business of institutions over
time. The team also conducted an assessment of how
initial digital channel business model assumptions
had materialized by the end of the study timeline.
6• Additionally, the team interviewed agents and • Research Report Aligning Expectations - The
customers from the FIs, as well as savings and/or loan Business Case for Digital Financial Services:
groups to incorporate the perspectives of DFS users. This research report provides a complete set of DFS
financial modeling benchmarks, based on the study’s
The study has produced a number of intermediate findings. It is addressing one of the main challenges
publications, in addition to this report, which focus for the industry to date, which is the lack of
on specific areas of business strategy, best-practices sufficient information on appropriate benchmarks.
and risk areas that financial institutions face when Realistic expectations for a DFS solution are built
implementing Digital Financial Services: from a digital strategy to guide development of the
business case and a financial model to assess the
• Breaking Free of the Branches - Microfinance long-term viability of the project.
and Alternative Delivery Channels in Sub-
Saharan Africa: This field note is a recap of findings • Changing Change Management - Adapting
from the first round of interviews the research team Internal and External Culture in Times of
conducted after most FIs had launched their DFS Digital Transformation: As for the effects of
with plans to fully integrate the new services into DFS implementation on staff and customers, the
the institutions’ operations. Major challenges to a study shows that managing change is not easy
successful DFS rollout in this initial phase included and requires dealing with emotional responses and
regulation and partnerships – which delayed the initial resistance. This field note discusses internal
project in many cases – staff capacities, technical and external aspects of a digital transformation
limitations as well as risk and agent liquidity and how institutions should address these in their
management. change management strategy.
• Turning FI Digital Strategies into Reality: This
field note shares key strategic lessons from the
study that FIs should consider before embarking
on a DFS strategy: First, greater outreach has
shown to be faster and easier to achieve than
deposit mobilization, and strategic objectives
evolve over time. Second, overall buy-in of staff
is key, particularly when staff is in direct contact
with clients. Third, agent network planning should
focus on high-quality active agents5 vis-à-vis a large
number of agents. Lastly, the study found that the
cost of an agent transaction is 25 percent less than
the cost of a branch transaction.
5 An active agent has completed one value transaction within 30 days. As transaction counts cash-in or cash-out from customer account, P2P payment, bill
payment, etc. Balance inquiries, PIN resets and other transactions that do not involve the movement of value do not qualify as value transaction.
7STUDY
BACKGROUND
Over the past ten years, the introduction of mobile money and The study sought to examine how digital channels impact
agent banking has transformed the financial sector in Sub- the ability of FIs to expand access, scale and outreach
Saharan Africa and greatly contributed to the expansion of the without relying on traditional branch infrastructure as well
financial inclusion rate from 23 percent in 2011 to 43 percent in as the impact of DFS on overall FI operations. It identifies
2017. The promise of new technology and innovative business both the efficiencies and challenges that these services
models has attracted a range of market actors to the evolving bring to such institutions. The study extracts lessons
Digital Financial Services space in attempts to find sustainable learned and establishes best-practices that can be used
ways of serving the mass market. and adapted by other institutions in different markets,
providing benchmarks around performance, costs and
The objective of the Longitudinal study was to understand if benefits of DFS implementations for the microfinance
Digital Financial Services are also a viable strategy for FIs to sector as well as the general banking industry (Figure 1
reach financially excluded populations. to 4 give a short overview of general – and DFS market
statistics on the study markets).
Cameroon DRC Madagascar Nigeria Rwanda Senegal Tanzania
Figure 1: PopulationDRC
Cameroon abobe 15 Madagascar
years-old in millions, 2017
Nigeria Rwanda Senegal Tanzania
Population Below Poverty Line (using $1.90 a day as per 2011 PPP)
Figure 1: Population abobe 15 years-old in millions, 2017
Population Below Poverty Line (using $1.90 a day as per 2011 PPP)
Tanzania
Tanzania
Senegal
Senegal
Rwanda
Rwanda
Nigeria
Nigeria
Madagascar
Madagascar
DRC
DRC
Cameroon
0 20 40 60 80 100 120 140 160 180 200
Cameroon
Note: Using poverty headcount ratio at national poverty lines (percent of population); reporting years are 2009 for Nigeria, 2011 for Tanzania,
2012 for Senegal,
0 Madagascar
20 and DRC,402013 for Rwanda,
60 2014 for
80Cameroon.100 120 140 160 180 200
Figure 2: Gross National Income per capita Figure 3: Life expectancy at birth in years
2017 (Atlas Method, in US Dollars)
65,7
Figure 2: Gross $2
National
100 Income per capita Figure 3: Life expectancy at birth in years
2017 (Atlas Method, in US Dollars) 66,7
$1 370
$1 240 67,1
65,7
$2 100
$910
$720 53,4 66,7
$460 $400
$1 370
$1 240 65,9
67,1
$910
$720 53,459,6
$460 $400
58,1 65,9
59,6
58,1
Figure 4: DFS market overview as of December 2017
Note:
Reporting years are 2015 for Tanzania, 2016 for Senegal,
Figure 4: DFS market overview as of December 2017 Madagascar, DRC, Cameroon and Nigeria, 2017 for Rwanda.
865,7
$2 100
66,7
$1 370
$1 240 67,1
$910
$720 53,4
$460 $400
65,9
59,6
58,1
Figure 4: DFS market overview as of December 2017
Senegal Rwanda
Mobile subscriptions: 50% Mobile subscriptions: 46%
Mobile internet users: 23% Mobile internet users: 21%
M-money accounts: 32% M-money accounts: 31%
FI accounts: 20% FI accounts: 37%
Nigeria
Tanzania
Mobile subscriptions: 49%
Mobile internet users: Mobile subscriptions: 38%
24% Mobile internet users: 14%
M-money accounts: 6% M-money accounts: 31%
FI accounts: 39% FI accounts: 21%
Madagascar
Cameroon DRC
Mobile subscriptions: 27%
Mobile subscriptions: 49% Mobile subscriptions: 35% Mobile internet users: 12%
Mobile internet users: 26% Mobile internet users: 14% M-money accounts: 12%
M-money accounts: 15% M-money accounts: 16% FI accounts: 10%
FI accounts: 27% FI accounts: 15%
Notes: Mobile subscription is the market penetration rate for unique subscribers calculated as total subscribers at the end of the period and
expressed as a percentage share of the total market population. Unique subscribers are the total unique users who have subscribed to mobile
services at the end of the period, excluding M2M. Subscribers differ from connections such that a unique user can have multiple connections.
Mobile internet is the share of total unique users who have used internet services on their mobile device(s) at the end of the period. Mobile
internet services are defined as any activity that consumes mobile data (i.e. excluding SMS, MMS and cellular voice calls). M-money account
- and Financial institution account ownership only consider adult population, i.e. population of 16 years and older. Data sources are GSMA
Intelligence database and World Bank Global Findex database 2017.
The nine institutions that participated in the study represent a digital channel has been operating for more than three years)
variety of characteristics with regards to market share, sector or young (if the operational life is less than three years). If not
maturity and regulatory frameworks. Notably, DFS strategy otherwise stated, all data presented in this report does not
and operational time frames differ as each institution started include DFS in pilot stage. Most of the banks that participated
channel implementation at different times and progressed in the study have also developed or plan to develop mobile
respectively. By the end of the study, all agent network banking systems to complement the agent banking channel.
solutions were live at various stages of maturity: two network Some institutions have adapted DFS solutions to popular,
solutions were more than five years old, three were operating informal, market solutions, e.g. mobile savings and loan
for about three years, two were in their initial roll-out phases, repayment collection or integration of banking agents into
and two were in pilot stages. For this report, we have classified group lending.
the digital implementations in two categories: mature (if the
9Figure 5: DFS approaches of study institutions as of December 2017
Rwanda
Senegal
Agent Network Agent Network
• propriety & static, since Q3 2014 • propriety & static, since Q2 2013
• “agent kiosk”, since Q4 2017 Mobile Banking
Mobile Banking • USSD, since Q2 2013
• app only, in planning
Tanzania
Nigeria
Agent Network
Agent Network • propriety & static, since Q2 2015
• via 3rd party provider, since Q3 2015 Mobile Banking
Mobile Banking • USSD & app, since Q4 2014
• USSD & app, since Q3 2015
Debit Cards
• since Q4 2016
DRC Madagascar
Agent Network
• propriety & static, since Q2 2017
Mobile Banking, Internet Banking, Agent Network Agent Network
Debit Cards propriety, static & roving, since 2011 • propriety & static, pilot since
• in planning Mobile Banking Q4 2017
USSD & app, since Q3 2017
Prepaid Cards
Cameroon
Agent Network
• propriety & static, since Q1 2015
Mobile Banking
• app only, in planning
Agent Network
• with cash-less branches, proprietray
& static, since Q4 2016
• mobile collectors, since Q3 2016
Mobile Banking
• in planning
10LESSONS LEARNED
Over the course of the four-year research period, the ethnographic research, surveys, and/or analysis of secondary
team has extracted many valuable lessons, actionable data. It may not rely solely on the institution’s marketing or
recommendations, as well as performance benchmarks on research department, and can include frontline cashiers,
DFS deployment in the banking context. This final research loan officers and other roles. Depending on the availability of
report gives a comprehensive summary of key learnings resources, market research activities may also be partly or fully
as of the end of the study. It has been written to provide outsourced to an external company or consultant.
practical guidance to institutions leveraging DFS for greater
financial inclusion and is organized according to these four With regards to internal factors, an institution should consider
phases of DFS rollout: reviewing the following areas:
(I) Planning • The human resources capacity of the institution to put
(II) Managing in place adequate project management skills, market
(III) Promoting usage and activity research, technology, and data analysis that is necessary
(IV) Ensuring sustainability to implement a DFS solution.
• The ability of the institution to transform itself. The digital
(I) LESSONS LEARNED: PLANNING
project might require staff to learn new skills or become
A DFS ROLLOUT familiar with basic DFS concepts. The ability to train and
retrain staff requires implementing capacity building
programs, communication strategies, and change
Defining DFS objectives and a business
management plans to guide existing staff through the
case through analysis of internal factors
digital transformation.
and the market environment
• The durability of legacy infrastructure and its readiness
It is important to define appropriate and compelling business to support new digital channels. The capacity of the IT
objectives that Digital Financial Services can deliver, e.g. department must be assessed in terms of the enterprise
reaching customers in new geographic areas, building better systems and IT infrastructure necessary to support
operational efficiencies, mobilizing deposits, or enhancing the digital channel in terms of core banking systems,
customer experience. Those objectives should be backed by a integration services, hardware (servers, mobile devices,
realistic and achievable business case.6 Point-of-Sale devices), and network communications, for
example. Costs related to improving existing systems or
To achieve this, an institution has to conduct a thorough acquiring new technology should also be considered, as
analysis of external factors, such as market research on these can become significant CAPEX and OPEX items.
potential and existing customers and the overall market
environment where the DFS is to be deployed (i.e. size, Only a few FIs in the study conducted comprehensive market
competition, country infrastructure, regulatory framework); research activities, encompassing both internal and external
as well as internal factors such as staff capabilities and factors, for the design of their DFS strategy and business
legacy systems. The results of this exercise should help in case. The research helped those FIs to have more realistic
the formulation of recommendations and assumptions for expectations in terms of potential market uptake as well as
the initial DFS strategy design and work planning stage. For client needs and expectations for the digital channel. Most
example, market research results on (potential) customer institutions in the study relied heavily on internal information
pains can ensure that (1) the DFS responds to a particular in combination with client focus groups, competitor analysis
market need, (2) the DFS value proposition is in line with what or mystery shopping. Only one institution externalized the
the market expects, and (3) that the market size assumptions market research to a specialized company. Some institutions
for the financial modeling are built on the best available also leveraged publicly available information about mobile
information and a solid rationale. All assumptions and their money services for building their DFS business case. Using
rationales should be well documented in the DFS business information from mobile money services proved not useful for
case.7 building assumptions for the DFS business case as it tended
to mislead FIs in terms of digital channel size, customer
The market research effort is a vital component when building acquisition growth, and transaction volume.
a DFS strategy. It can include different quantitative and
qualitative techniques, drawing on institutional databases,
in-depth customer and staff interviews, focus groups,
6 See the Mastercard Foundation & IFC “Field Note #7 Turning MFI Digital Strategies into Reality” 2017:
https://www.ifc.org/wps/wcm/connect/67a1ee9e-9f95-4baa-8430-2a101ca77a9e/MFI+Digital+Strategy+Field+Note_8.pdf?MOD=AJPERES
7 See the Mastercard Foundation & IFC “Aligning Expectations - The Business Case for Digital Financial Services” 2017:
https://www.ifc.org/wps/wcm/connect/5a322011-52b6-4b52-b4d5-6175039e551d/MFI+Longitudinal+Study_Digital_FA.pdf?MOD=AJPERES
11A careful assessment of the regulatory
environment is an important aspect of the
DFS planning stage
An important aspect of the environment assessment for the Until receiving this license, the institution could not continue
DFS planning stage is a careful review of the relevant banking recruiting new agents or launching new products on this
regulation commonalities in the country or region where the channel. Many of the operating agents were also not
bank operates. As part of this exercise, it may be worthwhile to complying with the new strict requirements that were put in
contrast the country’s relevant banking and DFS regulations – place as part of the background check and they were forced
if they exist – with regulations from countries that are known to close. In this period, agent network expansion was hence
to have enabling DFS environments. This can help in identifying halted and the institution even reduced network size.
challenges and gaps (an overview on the regulatory contexts
of the study countries and their challenges is added in the The study found that digital financial inclusion thrives within
annex). It can also help when seeking regulatory permission for enabling regulatory frameworks and when stakeholders
a digital service delivery model, especially in underdeveloped collaborate closely with policy makers. Only a few of the
markets where the institution may be breaking new ground. study countries had existing regulations for bank-led DFS
It is important to be well prepared when doing so, as in many deployments when the institutions started their DFS journeys:
instances the regulator may not have sufficient knowledge Rwanda, Senegal, and Tanzania. In other markets, the FIs had
itself to be able to adequately assess a proposed initiative. to deal with legal voids and lack of clarity. In those kinds of
situations, taking a pro-active approach and directly engaging
For example, one of the institutions in West Africa that was with regulators can prevent delays in implementation.
studied sought the regulator’s approval to integrate its mobile
banking service with a leading mobile money platform to One FI proactively addressed all concerns regarding the
allow customers to move money between their bank accounts implementation of digital channels before the regulator raised
and mobile wallets. The regulator rejected this request based them. By doing so, it gained the Central Bank’s trust to be the
on existing regulation that does not allow banks to “issue first institution allowed to develop and pilot a bank-led agent
e-money.” However, the law was not clear about the scope network in the country. In other cases, such as Rwanda and
of the term e-money and a case where e-value is only moved Senegal, regulators become more progressive about Digital
between a bank account and a mobile wallet. The lack of Financial Services after better understanding how digital
shared understanding between bank and regulator delayed channels work. Similarly, in some countries like Nigeria, the
the account-wallet integration for more than two years. issue of agent exclusivity became a factor to consider when
expanding an agent network. Different agent paradigms are
Three of the institutions in the study encountered delays depicted in Table 1.
in obtaining approvals and licenses from the regulatory
authorities for their agent banking services. One regulator Defining a realistic DFS business case and
requested an individual background check of each agent
goals that fit the operating environment
candidate, which substantially slowed down agent
recruitment processes and agent network growth at the Most of the institutions participating in the study were first
beginning of the rollout phase. This caused considerable movers. They were the first bank – or even banking institution –
damage to the institution’s implementation plan as agents developing a DFS offering in their respective markets. This was
that had already been recruited and trained were unable to true for the institutions in Cameroon, Democratic Republic
start their business and lost motivation or even eligibility to of Congo (DRC), Madagascar, Nigeria, Rwanda and Senegal.
become banking agents. During the waiting period, some As such, they were forced to rely on their own assumptions or
agents were contracted by competing mobile network the experience of other ecosystem players, primarily mobile
operators to join their networks and lost interest to become network operators, to guide the development of strategies
bank agents. and business models. This would include the number of agents
needed, how many customers an agent would serve, and
One institution only received regulatory consent for a pilot what average transaction sizes would be, for example. They
with four agents. Despite this limitation, the FI proceeded and did not have benchmarks available adapted to the realities
built a network with more than 400 agents within 14 months. of financial institutions. While providing some rudimentary
The bankruptcy of a leading bank in the same country then guidance, such an approach does not consider differences
increased the Central Bank’s concerns about the sector as a in the business nature and culture of different ecosystem
whole and the regulator became increasingly cautious and players. To help fine-tune assumptions that would be more
risk-averse regarding new innovations. Control measures valid for financial institutions and to better understand the
and bureaucratic barriers were raised, blockading further discrepancies between various types of market actors, the
expansion of the bank’s agent network. The regulator required research team compared the initial financial projections for
an individual background check of each new agent, conducted agent banking deployments of the study institutions with the
by the regulator itself. Additionally, the Central Bank required actual realities to date. The team found that:
that financial institutions intending to operate agents set up a
Banking Operations Intermediary and apply for a license first.
12a) Customer and agent registrations do not translate
into activity.8 While customer and agent acquisition
targets set in the financial models were often largely met
or even exceeded, activity rates have remained far below
assumptions.
Figure 6: Median customer and agent activity rates over the course of the study
89%
81%
76%
73%
67%
63% 63% 62% 62%
53%
47%
41%
30% 31% 32%
26%
23% 21% 20% 20%
18% 18% 19%
10%
Q1 2015 Q2 2015 Q3 2015 Q4 2015 Q1 2016 Q2 2016 Q3 2016 Q4 2016 Q1 2017 Q2 2017 Q3 2017 Q4 2017
Customer activity Agent activity Linear (Customer activity) Linear (Agent activity)
b) Customer transaction targets were out of reach. The c) Customer transaction patterns differ from the MNO
research team found that institutions reached only around 16 model. The team noted two main differences between
percent of the projected agent cash transaction volumes and customer transaction patterns at MNOs and banks.
17 percent of the value. This finding goes hand-in-hand with I. Since bank-led agent networks are primarily used as
unmet expectations on customer and agent activity rates. outlets for the repayment of loans, transaction amounts
tend to be higher than those at MNOs. In Q4 2017, the
median cash-in amount of the study institutions was
$146 and cash-out was $117. For MNOs in Sub-Saharan
Africa, GSMA reported an average transaction amount
of approximately $16 for December 2017.9
Figure 7: Average cash-in and cash-out amounts in US dollars over course of the study
$166 $163
$145 $146
$131 $125
$118 $115 $117 $116 $120 $117
$109 $111 $111 $106 $111 $110 $107
$100 $97 $97 $101
$85
Q1 2015 Q2 2015 Q3 2015 Q4 2015 Q1 2016 Q2 2016 Q3 2016 Q4 2016 Q1 2017 Q2 2017 Q3 2017 Q4 2017
Cash-in amount Cash-out amount
8 An active customer has completed one DFS value transaction within 30 days. As transaction counts cash-in or cash-out from account, P2P payment, bill
payment, etc. Balance inquiries, PIN resets and other transactions that do not involve the movement of value do not qualify as value transaction.
9 See GSMA “2017 State of the Industry Report on Mobile Money” 2018:
https://www.gsma.com/mobilefordevelopment/wp-content/uploads/2018/05/GSMA_2017_State_of_the_Industry_Report_on_Mobile_Money_Full_Report.
pdf; in 2017 the average mobile money transaction amount in SSA was at $16, the global average was at $17.5
13II. As of December 2017, the median cash-in share in to (a) an overestimation of fee income from cash-
the transactions performed at agents of the study out transactions generated on the channel, (b) an
institutions was 76 percent (i.e. only 24 percent of underestimation of efforts and costs related to
cash transactions were cash-outs), which differs liquidity management support for agents. With more
from the more balanced transaction mix the unequal float and cash flows, sustaining a sufficient
industry observes for mobile money agents.10 When float and cash balance is more challenging for banking
defining assumptions for financial modeling using agents.
MNO experiences, this misconception may lead
Figure 8: Median cash-in versus cash-out shares over the course of the study
11% 14%
20% 21% 20% 22%
28% 22% 22% 25% 24% 24%
89% 86% 80% 78% 75% 76% 76%
72% 78% 80% 79% 78%
Q1 2015 Q2 2015 Q3 2015 Q4 2015 Q1 2016 Q2 2016 Q3 2016 Q4 2016 Q1 2017 Q2 2017 Q3 2017 Q4 2017
Cash-in share Cash-out share
d) Agent networks are smaller, but agent activity than quantity. These factors contributed to higher agent
rates are higher. Expectations on required agent activity rates for the participating FIs vis-a-vis the larger
management efforts were hence met. The agent MNO networks. Expectations on the level of agent
networks of participating institutions are small – between commission and management costs were largely met or
200 and 1,500 agents – and concentrated around banking even exceeded, despite projections on network activity
branches. The number of active agents varied from 100 to and transactions volume being out-of-reach.11
900. Even the largest network of the study institutions,
which has 1,471 registered agents of which 887 are active, Another important lesson is that financial modeling should
is small compared to standard MNO agent network not be seen as a one-time exercise. New benchmarks that
sizes that are on average ten times larger. The rate of were developed as part of this study can be used to develop
active agents for the FIs was around 60 percent however, further iterations of business models as needed. Institutions
compared to less than 40 percent for MNO networks. This should reassess original plans and make regular revisions
indicates that the financial institutions outperformed based on adoption, usage, and actual growth of the digital
the MNOs in terms of management and stimulation of service throughout its lifespan.
their networks, with a model building on quality rather
10 See GSMA “2017 State of the Industry Report on Mobile Money” 2018: https://www.gsma.com/mobilefordevelopment/wp-content/uploads/2018/05/
GSMA_2017_State_of_the_Industry_Report_on_Mobile_Money_Full_Report.pdf
11 For more information on the findings of the analysis on initial agent banking projections and FI benchmarks, please see the Mastercard Foundation and
IFC “Aligning Expectations: The Business Case for Digital Financial Services” 2017: https://www.ifc.org/wps/wcm/connect/5a322011-52b6-4b52-b4d5-
6175039e551d/MFI+Longitudinal+Study_Digital_FA.pdf?MOD=AJPERES
14Exploring hybrid approaches to adapt DFS act as risk mitigation under this lending methodology, as
to existing customer habits and cultural group members guarantee each other’s loan repayments.
context Traditionally, all payments are done in cash during in-person
group meetings, where deposits are physically handed
Digital channels are said to facilitate access to financial to the loan officer who repays in bulk at a bank branch.
services and enhance customer experience at low cost. This model requires the physical presence at the meeting
There are, however, a number of factors that pose challenges of both the borrowers and the loan officer. At one of the
to market uptake, including a general lack of trust in the institutions being studied, group borrowers were offered
financial sector, self-exclusion, customer stickiness to the option to either repay at an agent outlet or at the roving
informal financial services, and fears about adopting new agent who was participating in the weekly group meetings.
technologies. When interviewing bank customers in the To preserve key elements of the traditional methodology,
field, the researchers found that many people distrust new the institution mandated all group borrowers to confirm
digital services because they are afraid their money may ‘get their on-time repayment during the meetings by handing
lost’ in the digital system due to issues of connectivity or in the transaction receipts from the agents or by using the
human error. Additional reasons for not choosing to adopt roving agent at the meeting. Another institution, which
digital services were a lack of awareness of the DFS value also had a history of relying on group lending, decided to
proposition and self-exclusion, i.e. some of the interviewees move cautiously with DFS so as not to disrupt the existing
believed that they were not sufficiently technology savvy, dynamics of its group clients, which account for 80 percent
financially educated or affluent to use such services.12 of the overall customer base. Consequently, it initially
limited the services it offered at pilot agents to account
A key factor to customer adoption of DFS is trust, but it opening, savings collection, cash-out, and transfers for
takes time to build trusting relationships with customers. individual customers. Loan repayments via agent outlets
FIs operating in generally difficult market environments were not allowed in this first phase, and still require group
or where digital technologies and digitization are still borrowers to participate and repay during regular group
new phenomena may find it particularly challenging to meetings. Individual group members can still open separate
build clients’ trust in digital services. Institutions that accounts and use agents for the purpose of individual
are traditionally targeting customers at the base of the savings. At the end of the study period, the institution was
income pyramid and that are heavily reliant on traditional planning to add a loan repayment option for individual
microfinance strategies (group lending methodologies, loans at agents. The repayment of the group loan, however,
frequent face-to-face interactions with customers, etc.) will remain exclusively within the group meetings.
are advised to move cautiously and to carefully assess the
readiness of the existing customer base or target segments As a test, some of the study institutions tried to incorporate
to move into the digital era. The experience of the study common financial practices and market peculiarities into
institutions shows that FIs will need to invest time and the DFS strategy. For example, the use of so-called susu
capacities in training, marketing, and handholding of collectors for daily savings is common in many West African
clients to support their learning processes and to build trust countries. This informal service relies on mobile collectors
in using the new services. circulating in markets and communities to collect regular
contributions from clients, usually for a monthly or weekly
It may also be wise for institutions to consider a gradual flat fee. One of the study institutions had incorporated the
approach for the implementation of DFS. Adopting a step- susu mechanism into its business operations even before
by-step strategy to sensitize staff and customers alike could going digital, using roving staff to collect daily savings
entail hybrid models where face-to-face interaction with from business customers in market areas. The institution
customers is at least partly preserved at the early stages then digitized the process of this mobile collection service,
of the digitization effort. In this sense, agent banking supported by a proprietary agent network that is centered
models can serve as hybrid model and are particularly around cash-light branches. Its agents focus primarily on
interesting for microfinance institutions that heavily rely collection of loan repayments and cash-out. The digitized
on face-to-face interaction between staff and customers. collection service, which featured instant confirmation of
Instead of branch staff, agents conduct digital transactions deposits via short message, has proved popular and has led
on behalf of customers or are able to offer face-to-face to a significant rise in deposit mobilization and consequently
support to customers when conducting DFS transactions improved the capital structure of the bank. After 18 months,
on their own. Similarly, it may be fruitful to experiment the mobile collection accounted for around $15 million in
with models that tailor DFS offerings to customers’ existing cash, equivalent to about 40 percent of the overall deposit
financial habits and cultural peculiarities. For example, portfolio.
some of the institutions that participated in the study have
tried hybrid models that marry DFS with group lending
methodologies. Groups’ social cohesion and peer pressure
12 Similar results were also observed in research performed by the Mastercard Foundation and IFC regarding perceptions and attitudes towards
mobile money in Cameroon, DRC, Zambia and Senegal. See “A Sense of Inclusion - An Ethnographic Study of the Perceptions and Attitudes
to Digital Financial Services in Sub-Saharan Africa” 2017: https://www.ifc.org/wps/wcm/connect/15e6158a-8e52-444b-9103-391547cb1730/
IFC+A+sense+of+Inclusion+DFS+Ethnographic+Study+2017.pdf?MOD=AJPERES
15In markets where the use of innovative technologies was – in particular tellers and loan officers – felt threatened by
more common and where a DFS ecosystem had already been agents and regarded them as competitors who could make
established, the research showed that institutions found it their roles in the institution redundant. Branch staff, who
easier to move their customers onto digital channels. Even used to be in direct ownership of the customer relationship,
so, client education, effective marketing and well-targeted would therefore refuse to promote the adoption of the new
products and services were critical in ensuring that digital service, leading to limited DFS uptake. Additionally, a digital
channels are differentiated from existing offerings in the project requires putting clients in the center, a difficult
market. task for FIs that normally are product-centric. Therefore,
having a customer-centric approach requires a mindset
Full engagement is needed to successfully change for most staff members of the organization, and it
roll out a DFS requires mechanisms for properly gathering and addressing
customers’ feedback.
To be successful, an institution’s journey into digital In fact, the research shows that some of these concerns are
transformation requires a shift in mindset of staff and legitimate. Figure 9 shows that out of the eight reporting
clients. Most of the financial institutions in the study faced institutions deploying DFS solutions, five either reduced
internal and external resistance to digitization. Internally, the number of their staff outside of the headquarters over
staff felt threatened by the new digitization push as it the course of the study period or they kept staff size more
promised to bring better efficiencies and cost reduction. or less stagnant. At two institutions, the number of non-
It created fear among staff as positions and salaries were headquarter staff rose.
perceived at risk. For example, the FIs noted that branch staff
Figure 9: Branches (right y-axis), non-HQ staff and agent network size (both left y-axis) over data reporting period
BANK 1 BANK 2 BANK 3
1000 25 1000 25 500 18
800 20 800 20 400 17
600 15 600 15 300
16
400 10 400 10 200
200 5 200 5 100 15
0 0 0 0 0 14
BANK 4 BANK 5 BANK 6
2000 25 250 40 800 50
20 200 40
1500 30 600
15 150 30
1000 20 400
10 100 20
500 5 10 200
50 10
0 0 0 0
0 0
BANK 7 BANK 8
600 50 300 20
500 40
15
400 200
30
300 10
20
200 100
5
100 10
0 0 0 0
Staff non-HQ Branches Agents
Notes: Data reporting start dates vary; agent networks in pilot stage are included; for two institutions reporting is incomplete
16It is still important to foster an understanding among staff adopted key performance indicators (KPIs) based on DFS
– particularly branch staff – that ‘going digital’ is necessary, performance, and they have assumed responsibility for
and it is important to accurately communicate that message the management of local agents. Some staff have been
to all employees. Not doing so can create challenges for moved from headquarters to the branches to better
the digital project and even put its success at risk. One guarantee branch oversight and support in areas outside
study institution that did not properly communicate the the capital. Most branch staff were also moved to more
advantages and requirements of the implementation of generic roles as Customer Service Agents, giving the bank
an agent network to its branch staff struggled to get the more flexibility to quickly allocate resources where business
digital channel off the ground. Loan officers did not have needs arise. The financial institution has also introduced
any incentives to encourage customers to use the digital new training opportunities for staff, including, for example,
channel but remained focused on loan recovery. Similarly, coaching staff on how to enroll clients at agents. Younger
branch managers considered the integration of agents to staff have been offered opportunities in leadership roles,
branch operations a low priority. The value proposition of and there has been a positive impact on staff morale and
cashing out at agents (time savings, convenience) and a engagement. Since the implementation of these changes,
detailed instruction on how to use the digital channel were the institution has seen an increase in the number of cash
also not integrated into the financial literacy content of the transactions handled via agents, from 25 percent in May
bank. 2017 to 31 percent in December 2017.
The research further shows that it is important to leverage Friendly technology and a data-driven
senior management when sensitizing staff to the value of approach increase the chances of success
the digital venture, particularly when addressing branch
staff that has the most direct interaction with customers. Technological readiness can make or break a digital
Management should clearly communicate that ownership channel. All of the institutions in the study experienced
of the new digital channels lies with the entire organization severe technological challenges during DFS planning
and not headquarters alone. While it is the role of (and later rollout), including, among others, difficulties
headquarters to manage the harmonization of digital and in selecting appropriate technology providers, delays in
traditional channels, staff located at branches or in the field technology delivery, difficulties integrating DFS systems
should be responsible for promoting digital services in their to the core banking systems, and insufficient network
daily interactions with customers, e.g. by proposing agents strength and coverage. Reliance on Global System for
as faster and easier option for cash services, or explaining Mobile communications (GSM) and internet connectivity is
how agents can facilitate the account opening process. a major risk to the successful delivery of DFS in developing
Internal communication should also center around how the and emerging markets. Consequently, it is advisable that
digital channels benefit staff in their daily functions, e.g. FIs interested in launching DFS take note of the following
how DFS enables loan officers to devote more time to loan during the planning stage:
promotion, origination and recovery instead of collecting
loan repayments.13 • Perform a proper due diligence or a selection
process of the technology providers to use. This
Even if an institution does not get communications or includes asking for references from previous clients.
incentives structures right from the start, it may be possible
to adjust them at a later stage, albeit at a cost. One • Assign enough time for system integration
institution in the study that went through the digitization testing. This type of testing should be both technical
process and concurrently made fundamental structural and functional. On the technical side, one should ensure
changes, failed to define a unified communication plan that that all systems are using the right data exchange and
could address the emotional aspects of change and help communication protocols. On the functional side, one
to integrate the digital channel into the daily operations. should ensure that users will have the right experience and
For many of its employees, the initiative to ‘go digital’ was receive the right responses.
perceived as a threat. They were afraid they would lose their
jobs to agents and the new mobile banking application. • System testing should also look at transaction
reconciliation. Reconciliation testing should include
In 2017, the financial institution mentioned above, began to developing different scenarios on the type of transactions
implement measures designed to increase staff acceptance going through the system with the respective exceptions.
of the DFS project. One immediate action taken by the FIs should aim for transaction reconciliation processes
FI was a revision of incentive structures at its branches. that are fully automated and take less than 24 hours.
The FI transferred ownership of the agent network from
headquarters to the branches. The branches have since
13 See also the Mastercard Foundation & IFC “Field Note 8: Changing change management: adapting internal and external culture in times
of digital transformation” 2018: https://www.ifc.org/wps/wcm/connect/93567f5c-6eb5-4e23-bc13-ee0c55f3eabc/IFC+MCF+Field+Note+8_
DFS+Change+Management+MCF.pdf?MOD=AJPERES
17You can also read