Current Status and Challenges of Gender Equality in Japan - May, 2022 Gender Equality Bureau, Cabinet Office, Government of Japan

Page created by Gene Wilson
 
CONTINUE READING
Current Status and Challenges of Gender Equality in Japan - May, 2022 Gender Equality Bureau, Cabinet Office, Government of Japan
Current Status and Challenges
  of Gender Equality in Japan

              May, 2022
Gender Equality Bureau, Cabinet Office,
        Government of Japan
Current Status and Challenges of Gender Equality in Japan - May, 2022 Gender Equality Bureau, Cabinet Office, Government of Japan
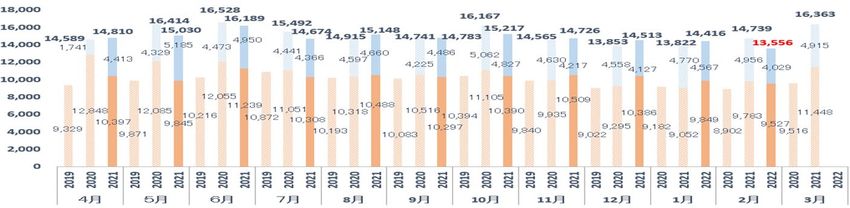
Gender Gap Index (GGI) 2021
As for Gender Gap Index of World Economic Forum, Japan ranks 120th out of 156 countries.

                     Economic Participation and Opportunity                                                      Rank      Country       Score
                                                   (0.604)          • Labour force participation                  1        Iceland       0.892
        Iceland(0.892)                                              • Wage equality survey
                                               1                                                                  2        Finland       0.861
        1/156                                                       • Estimated earned income                     3        Norway        0.849
        Japan(0.656)                                                • Legislators, senior officials and
                                             0.8                      managers
                                                                                                                  4      New Zealand     0.840
        120/156                                                     • Professional and technical workers          5        Sweden        0.823
                                             0.6
        Average(0.677)                                                                                            11       Germany       0.796
                                             0.4                                                                  16        France       0.784
                                             0.2                                                                  23    United Kingdom   0.775
   Political                                                                                                      24        Canada       0.772
                                               0                                     Education
 Empowerment                                                                             (0.983)                  30     United States   0.763
        (0.061)                                                                                                   63         Italy       0.721
     • Women in parliament                                                •   Literacy rate                       79       Thailand      0.710
     • Women in ministerial positions                                     •   Enrolment in primary education
     • Years with female head of state                                    •   Enrolment in secondary education             Russian
                                                                          •   Enrolment in tertiary education
                                                                                                                  81                     0.708
                                                                                                                          Federation
                                                                                                                  87       Viet Nam      0.701
                                                                                                                 101      Indonesia      0.688
                                                                                                                 102     Korea, Rep.     0.687
                                     Health and Survival                                                         107        China        0.682
                                                                        • Sex ratio at birth
                                                (0.973)
                                                                        • Healthy life expectancy
                                                                                                                 119        Angola       0.657
1.Source: World Economic Forum “Global Gender Gap Report 2021”                                                   120        Japan        0.656
2. Indicators with low scores are listed in red.                                                                 121     Sierra Leone    0.655
3.Results by Subindex :Economic Participation and Opportunity(117th), Education Attainment(92nd),
                        Health and Survival(65th), Political Empowerment(147th)                                                                  1
Current Status and Challenges of Gender Equality in Japan - May, 2022 Gender Equality Bureau, Cabinet Office, Government of Japan
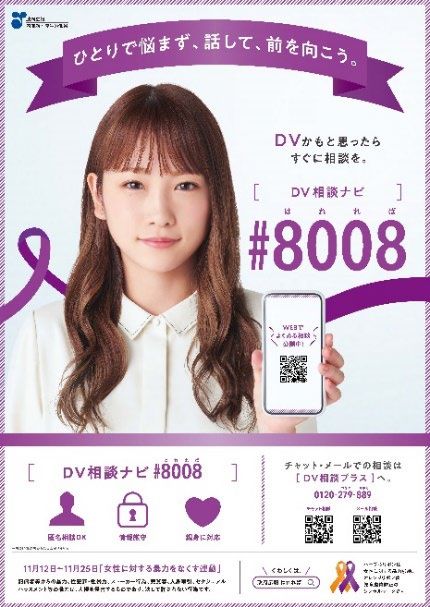
“How Do You Feel about Gender Equality?”
・ Asked about how they feel about gender equality throughout society, 21.2% of respondents felt that women and
men received equal treatment, while 74.1% felt that men are being given privileged treatment (exclusive
privileged treatment for men 11.3% + privileged treatment for men in general 62.8%).
・ By sector, 61.2% of respondents felt that there was gender equality in schools and education, 46.5% in community
activities including PTA, 45.5% at home, 39.7% in law and institutions, 30.7% in the workplace, 22.6% in social
conventions and customs, and 14.4% in politics.

                                         Sense of gender equality throughout society                            Women are being given
                         Men are being given privileged                                                        privileged treatment 3.1%
                               treatment 74.1%
                                                                                                        Privileged treatment Exclusive privileged
                                             Privileged treatment                                       for women in general treatment for women
                  Exclusive privileged
                  treatment for men          for men in general                Equal treatment   Don’t know

                                                                                                                                Numerical Targets on The Fifth
                                                                                                                                Basic Plan for Gender Equality ;
                    Total     11.3%                                 62.8%                              21.2%                    50% for the present (until 2025)
                                                                                                                           0.3% , while the ultimate goal is nearly
                                                                                                                    1.6%2.8%
                                                                                                                                100%

                 Women         13.1%                                   64.4%                             18.4%              0.2%
                                                                                                                     2.1% 1.7%

                    Men       9.2%                              61.0%                                24.5%
                                                                                                                          0.3%
                                                                                                                  1.0%4.0%

                            0.0%             20.0%                  40.0%       60.0%               80.0%              100.0%

                  Source: Cabinet Office, Public Opinion Poll on a Gender Equal Society (Sept. 2019)                                                           2
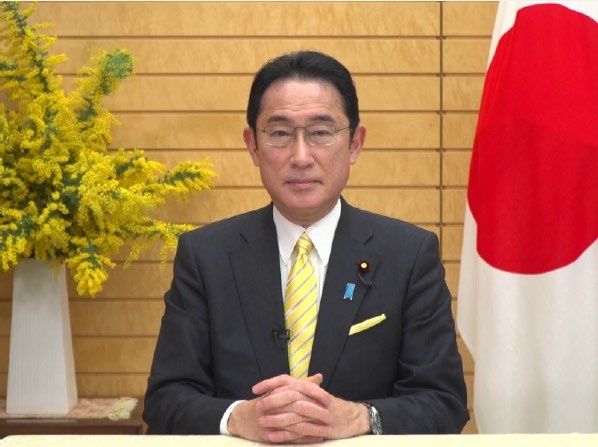
Current Status and Challenges of Gender Equality in Japan - May, 2022 Gender Equality Bureau, Cabinet Office, Government of Japan
Women in Politics
   1. Diet
                                                                   Percentage of female                                            Number of female
                                                                                        Number of members
                                                                        members                                                       members

          House of Representatives                                           9.9%                            465                             46

          House of Councillors                                             23.0%                             243                             56

          Total                                                            14.4%                             708                            102

    2. Local assemblies
                                                                   Percentage of female                                            Number of female
                                                                                        Number of members
                                                                        members                                                       members

          Prefectural assemblies                                            11.8%                          2,598                            306

          Municipal assemblies                                             15.4%                          29,425                          4,520

          Total                                                            15.1%                          32,023                          4,826
Notes 1. As of April 28, 2021 for the House of Representatives, and May 23, 2022 for the House of Councillors (from the House of Representatives and House of
         Councillors websites).
      2. As of December 31, 2021 for prefectural assemblies (survey by the Ministry of Internal Affairs and Communications).
      3. As of December 31, 2021 for municipalities (survey by the Ministry of Internal Affairs and Communications).
      4. Percentage of female voters: 51.7% (based on the preliminary results of the ordinary election for the House of Councillors, Results of the Ordinary Election
         for the House of Councillors, executed on October 31, 2021).
                                                                                                                                                                        3
Current Status and Challenges of Gender Equality in Japan - May, 2022 Gender Equality Bureau, Cabinet Office, Government of Japan
Women in Parliament in G7 Countries

                                                                                                Lower or single house
    Rank                                     Country                                    % Women          Women/Seats

      27          France                                                                      39.5          228/577
      35          Italy                                                                       35.7          225/630
      39          United Kingdom                                                              33.9          220/650
      49          Germany                                                                     31.5          223/709
      52          Canada                                                                      29.6          100/338
      67          United States of America                                                    27.3          118/433
         ・
         ・ ・
           ・

     166          Japan                                                                       9.9            46/465
Note 1. The source for Japan: the websites of the House of Representatives as of April 2022
     2. The source for other countries: “Women in Politics:2021”, the IPU’s website
                                                                                                                        4
Current Status and Challenges of Gender Equality in Japan - May, 2022 Gender Equality Bureau, Cabinet Office, Government of Japan
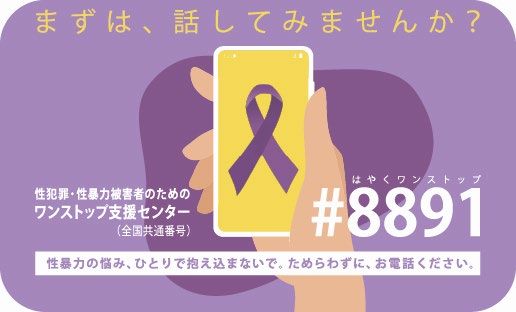
Gender and age structure of people and Diet members in Japan
   Women comprise approximately 51.7% of our nation's electorate. Compared to the gender and age structure of the population as a whole, there
   are fewer women and younger generations of parliamentarians.
                                                                      (1,000 people)                                                                0   10    20      30      40

   [Whole nation]                 0       20
                                        100
                                               40   60   80   100    120                     [Diet members]                                100
                                                                                                                                       or older
                                                                                                                                                                            (People)

                                       or
                                      older                                                     Male                                                         Female
                                                                                                                                           90
                                       90
                                                                                                       Average                                                  Average
                                                                                                      57.4 years                                               54.9 years
                                                                                                                                           80
                                       80

                                                                                                                                           70
                                       70

                                       60                                                                                                  60

                                       50                                                                                                  50

                                       40                                                                                                  40

                                                                      30: Eligibility for election (House of Councillors)
                                       30                                                                                                  30
                                                                                                                                            years
                                       25                           25: Eligibility for election (House of Representatives)
                                                                                                                                           25
                                                                                                                                           25歳
                                                                                        40       30        20         10               0
                                       20                                                                                   (People)
                                       18                           18: Right to vote

     Male                              10                     Female                         Note: Produced by the Gender Equality Bureau, Cabinet Office based on the
                                                                                                   House of Representatives website (as of April 28, 2022) and the House
 (1,000                                                                                            of Councillors website (May 23, 2022) (the number of members and
 people)                              0                                                            their ages are as of April 28 , 2022).
                                  years

                                                                                                                                                                                   5
Note: Produced by the Gender Equality Bureau, Cabinet Office based on Population
      Estimates, Statistics Bureau of Japan, Ministry of Internal Affairs and Communications.
Current Status and Challenges of Gender Equality in Japan - May, 2022 Gender Equality Bureau, Cabinet Office, Government of Japan
Voter Turnout by Gender and Age
          (49th General Election for the Members of the House of Representatives [executed Oct. 31, 2021])

Voter turnout is higher among the 18–19 age group than the 20–29 age group, both for men and women. Also, it is higher among women
between the 18–19 and 60–64 age groups, and higher among men in the 65–69 and older age groups.

    (%)
                   ■       Men
                   ■       Women
                     Total:                      55.9%
                     Men:                        56.1%
                     Women:                      55.8%
                                                                                                                                                        73.1 72.0   74.1          73.5
                                                                                                                                                                           72.5
                                                                                                                                                 70.9
                                                                                                                                          69.7                                           68.7
                                                                                                                                   66.3
                                                                                                                            65.0
                                                                                                                     61.9
                                                                                                       58.5   59.6                                                                              59.7
                                                                                                56.1
                                                                                         54.8
                                                                                  52.3
                                                                           50.5
                                                             46.8   47.3
                   45.7
                                               42.2   43.3                                                                                                                                             42.5
            40.9

                                 35.6   36.7
                          31.8

            18–19       20–24      25–29     30–34    35–39      40–44      45–49     50–54 55–59          60–64      65–69     70–74      75–79      80+                                                     Age group

                                                                                                                                                                                                                  6
     Note: Compiled by the Cabinet Office based on preliminary results from the General Election for the Members of the House of Representatives executed
           Oct. 31, 2021, as published in “Number of Voters by Age” by MIC
Current Status and Challenges of Gender Equality in Japan - May, 2022 Gender Equality Bureau, Cabinet Office, Government of Japan
Women in Central Government
The percentage of women in the national civil service by position level is significantly lower in Japan than that of other countries at all position
levels.

            Women in senior management (Director-                                                                       (%)
                                                                                                                              Women in middle management (Director level)
 (%)        General, Deputy Director-General level)                                                                     60
                                                                                                                              51.3 50.7
50      44.6 42.0                                                                                                                       47.6
                                                                                                                        50                                         42.8
                     37.1 34.0
40                                32.5 30.8                                                                             40                                                   34.8 34.4
30                                                                                                                      30                                                                            25.7
20                                                                                                                      20
                                                                                                8.6
10                                                                                                             4.2      10                                                                                         4.9
  0                                                                                                                      0
                          イUnited

                                         アUnited

                                                      イItaly

                                                                               フFrance
          カCanada

                                                                    ドGermany

                                                                                                                                                         イUnited

                                                                                                                                                                    イItaly

                                                                                                                                                                             フFrance

                                                                                                                                                                                            アUnited
                                                                                                     韓Korea,

                                                                                                               日本

                                                                                                                              ドGermany

                                                                                                                                         カCanada

                                                                                                                                                                                                         韓Korea,

                                                                                                                                                                                                                   日本
                    Kingdom

                                    States

                                                                                               Rep.

                                                                                                                                                   Kingdom

                                                                                                                                                                                       States

                                                                                                                                                                                                      Rep.
                           ギリス

                                          メリカ

                                                       タリア

                                                                                ランス
           ナダ

                                                                     イツ

                                                                                                                                                          ギリス

                                                                                                                                                                     タリア

                                                                                                                                                                              ランス

                                                                                                                                                                                             メリカ
                                                                                                      国

                                                                                                                               イツ

                                                                                                                                          ナダ

                                                                                                                                                                                                          国

                                                                                                                                                                                                                    Japan
                                                                                                                Japan
(%)                  Women in other positions of Central
80     71.4                    government
70                  61.4 55.5
60                               54.6 54.0
50
                                               46.1 42.8
40
30                                                                                                             20.4
20
10
 0
                                                                                                               Japan
                                                                               United States

                                                                                                 Korea, Rep.
                                                   United Kingdom
                                     Canada
                    France
       Germany

                                                                    Italy

                                                                                                                                         Source: Government at a Glance 2021, OECD
                                                                                                                                                                                                                            7
Proportion of women in managerial positions of
                     Number of Employed Women                                                                                         private corporation
        The number of employed women has increased by approximately                                                      The proportion of women in department manager level, director
                     3.4 million in 9 years (2012-2021)                                                                  level, and section chief level is steadily growing.
                                                                                                                         However, the higher the position, the lower the percentage.
(million)
        31                                                                                                         30                                                                                                     Numerical Target
                                                                                               3,002                                                                                                     20.7            (The 5th Basic Plan)
        30
                                         +3.4million                                                               20                             Section chief level
                                                                                                                                                                                                                                30%(2025)
        29

        28                                                                                                                                                                                            12.4                18%(2025)
                                                                                                                                                                                    Director level
                                                                                                                   10
        27
             2,633                              2,658                                                                                                                                                                     12%(2025)
        26                                                                                                                                                                         Department manager level   7.7
                                                                                                                    0
        25                                                                                                              1990        1995           2000           2005          2010          2015                2021 (year)
        24                                                                                                               Note:1. Ministry of Internal Affairs and Communications, Basic Survey on Wage Structure, as of June each year
                                                                                                                               2. Of those workers at corporation with 100 or more permanent workers, managerial staff without fixed terms
                                                                                                                                   of employment.
             2005                      10          12              15                            21                             3. Management positions are defined as follows: Department manager level : In charge of two or more sections
                                                                                                                                   or one section of at least 20 staff (themselves included); Director level: In charge of two or more sub-
                                                                                                      (year)
          Source: “Labor Force Survey (Basic Tabulation),” MIC.                                                                    sections or one sub-section of at least 10 staff (themselves included).4.It should be noted that methods of
                                                                                                                                   estimation have changed from the 2020 survey.

    Number of Women Executives in Listed Companies                                                                              Ratios of Women Executives Overseas
       The number of women executives in listed companies has increased                                                                    0%              10%              20%               30%                 40%           50%
                     by 4.8 times in 9 years (2012-2021)                                                (%)
    3500                                                                                              8.0
                                                                                                                               France                                                                                        45.3%
(number of women executives)
   4000                                                                                        7.5                               Italy                                                                        38.8%
     3000                                                                                             7.0
                                                                                                                            Sweden                                                                          37.9%
                                                                              ratio                   6.0
   3000
    2500
                                                              number of                                          United Kingdom                                                                              37.8%
                                                                                                      5.0
     2000                                                      women                                                       Germany                                                                         36.0%
                                                              executives
   2000                                                                                               4.0                      Canada                                                                   32.9%
     1500
                                                                                                      3.0            United States                                                                   29.7%
    1000
   1000                                              1.6                                      3,055
                                                                                                      2.0                       China                             13.8%
      500                                                                                             1.0                       Japan                            12.6%(※)                                     8
                                                        630                                                                                                  8.7%
      0 0                                                                                             0.0                Korea, Rep
             2003       5                     10        12           15                    20 21 (year)        Source: Values from OECD, Social and Welfare Statistics 2021
                                                                                                                       For EU countries, data refer to the largest 50 members of the primary blue-chip index in each country; for other
   Source: Toyo Keizai ”YAKUIN SHIKIHO”                                                                                countries, companies covered by the MSCI ACWI index (an index of approx.2,900 large- and mid-cap firms).
   Note: Data: as of 31st July each year. Surveyed all listed companies including                              Note: The target ratio for women board members at listed companies in the Fourth Basic Plan for Gender Equality was

                                                                                                                                                                                                                                                 8
         the JASDAQ listed companies. “Board“ means directors, auditors, representative executive officer            calculated from Tōyō Keizai Shinpōsha, Executive Quarterly. (The ratio of women board members at all listed
                                                                                                                     companies as at July 2021 was 7.5%).
         and executive officers of the companied with nomination committee, etc.
Gender Pay Gap

                       Dual labor market                                                Same occupation and length of service

                   Scheduled cash earnings                                          (1000 yen/month)         Childcare workers
(1000 yen/month)   (By employment type and age group)                                  500
 450                                                                                   450                                 Men
                                                                  428.6                400
                                                                                       350
 400                              Regular (men)
                                                                                       300
                                                                                       250
 350                                                                                   200                                                Women
                                       Regular (women)
                                                    305.6           274.7              150
 300
                                                                                                        0 1~4 5~9 10~14 More than 15
 250                                                                                                                              (Years of service)

 200
                                                  Non-regular (men)                                       System consultants, designers
                                                                                     (1000 yen/month)
                                          200.2
                                                      Non-regular (women)
                                                                                                              and software authors
 150
                                                                                       500                                                 Men
       19 or younger 25~29 35~39          45~49        55~59          65~69
                                                                                                                                          Women
                                                                            (Age)      400                                                 Men
                                                                                                                                          Women
                                                                                       300

                                                                                       200
                                                                                                        0 1~4 5~9 10~14 More than 15
   (Basic Survey on Wage Structure 2021, Ministry of Health, Labor and Welfare)                                                   (Years of service)

                                                                                                                                                       9
Gender Equality in Science, Technology and Academic Fields

           Number of women Nobel Prize laureates (in natural science)                                         Proportion of women researchers in foreign countries

                    Physiology,                                                                         United
                                                                                                                                                                                             (%)
                                          Physics           Chemistry            Total                イギリス
                     medicine                                                                         Kingdom                                                              39.0
   United                                                                                               United
   States
                          5                 2                     2                   9               アメリカ
                                                                                                         States                                                    34.0

                                                                                                        France
                                                                                                      フランス
   Europe                 5                 1                     4               10                                                                       28.3

                                                                                                        Germany
                                                                                                         ドイツ
   Japan                  0                 0                     0                   0                                                                    28.1
                                                                                                     Republic of
                                                                                                         韓国                                        21.4
   Other                  2                 1                     1                   4                  Korea
                                                                                                            Japan
                                                                                                            日本                              17.5
   Total                 12                 4                     7               23
                                                                                                                 0.0          10.0         20.0           30.0        40.0            50.0
 * Total laureates through to 2021.                                                               Sources: Survey on Research and Development, MIC (2021); Main Science and Technology Indicators,
                                                                                                                                                                                        (
 * “Other” comprises Israel, Australia, China and Canada.                                                  OECD; and Science and Engineering Indicators, National Science Foundation (NSF)

           Proportion of women undergraduate students in universities                                         OECD survey on learning achievement (15-year-olds)

                                                                                                                                         Japan                        OECD average
             人文科学
             Humanities                   65.0%                        35.0%
                                                                                                                               Total      Boys        Girls       Total      Boys        Girls
            社会科学
          Social sciences         35.8%                       64.2%
                   理学
                  Science     27.8%                         72.2%                         女性
                                                                                          Women      Mean score in
                                                                                                                                529        531         528
                                                                                                                                                                   489        488        490
                  工学 15.7%
             Engineering                                  84.3%                                      scientific literacy
                                                                                                                               points     points      points
                                                                                                                                                                  points     points     points
                                                                                                                                2nd        1st         3rd
                   農学
              Agriculture          45.2%                          54.8%                   男性
                                                                                          Men
  Healthcare (medicine,                                                                              Mean score in              527        532         522
     保健(医歯薬学)
dentistry, pharmacology)            48.9%                         51.1%                                                                                            489        492        487
                                                                                                     mathematical              points     points      points
                                                                                                                                                                  points     points     points
     保健(看護学等)  Healthcare                         91.3%                        8.7%                  literacy                   1st        1st         2nd
            (nursing, etc.)
                   教育
               Education              59.0%                           41.0%                          Mean score in              504        493         514
                                                                                                                                                                   487        472        502
                                                                                                     reading                   points     points      points
             その他等
               Other                47.7%                         52.3%                              performance                                                  points     points     points
                                                                                                                                10th       9th         14th
                                                                                                    * Compiled based on the Programme for International Student Assessment (PISA) 2018, OECD
   Source: FY2021 School Basic Survey, MEXT                                                           Ranked out of 37 OECD member countries. Students attending school who are aged between 15
                                                                                                      years and 3 months and 16 years and 2 months at the time of the survey
                                                                                                      (in the case of Japan: first year senior high school students).                         10
Marriage and Divorce

    120                                                                                                                                                         30
     (million pieces)                                                                                                       26.7                                (%)
                                                                                                                                              26.4
                                            102.9

    100                                                                                                                                                         25
                                                                                                          Ratio of a number in remarriages of a number
                                                                                                                  in all marriages(right scale)

      80                                                                                                                                                        20
                                                                                                                                             Marriage
                                                                                                                                                         Divorce

      60                                                                                                                                                        15
                                                                                                                                                      51.4

      40                                      11.1                                                                                                              10

                                                                                            26.4
                                                                                                                                                         18.8
      20                                                                                                                                                        5

                               6.9

       0                                                                                                                                                        0
           1955         1960         1965   1970     1975   1980   1985   1990   1995    2000      2005     2010   2015     2018     2019    2020     2021

※Number of remarriages: Both spouses remarried or one of them remarried
  Figures for 2021 are preliminary figures including foreigners in Japan. The number of marriages in 2021 is the total of remarriages and first marriages.
                                                                                                                                                                11
  Source: Demographic Surveys, Ministry of Health, Labour and Welfare
Life Expectancy of Men and Women

                                                               Men                                          Women
               Survival rate at
               the age of 90                               28.1%                                           52.6%
               years
               Survival rate at
               the age of 95                               10.5%                                           27.9%
               years
               Average life
               expectancy                            81.56 years                                      87.71 years
               The mode age of
               death (※)                                 88 years                                        93 years
               Population over
               the age of 100                               9,766                                          69,757
               years
               Population over
               the age of 105                                 715                                           5,800
               years
(※)”The mode age of death” is the age with the highest number of deaths.
   “Population over the age of 100 years” and “Population over the age 105 years” are based on the 2020 National Census by Ministry of Internal Affairs
    and Communications, and the others are based on the 2020 Summary of Simplified Life Tables by the Ministry of Health, Labour and Welfare.         12
Changes in the Family Figure

                      1980                                                    2015                                                  2020
Couple and Child(Children)                               Single person                                          Single person
  15,081 thousand
    households
                    42.1   %
                                                        18,418 thousand
                                                          households
                                                                           34.5    %                           21,151 thousand
                                                                                                                 households
                                                                                                                                  38.0    %

3generations, etc.                                     Couple and Child(Children)                             Couple and Child(Children)
   7,124 thousand
     households
                    19.9   %                            14,288 thousand
                                                          households
                                                                           26.8    %                           13,949 thousand
                                                                                                                 households
                                                                                                                                  25.0    %

   Single person                                          Couple only                                            Couple only
   7,105 thousand
     households
                    19.8   %
                                                        10,718 thousand
                                                          households
                                                                           20.1    %                           11,159 thousand
                                                                                                                 households
                                                                                                                                  20.0    %

    Couple only                                         3generations, etc.                                     Single-parent and Child(Children)
   4,460 thousand
     households
                    12.5   %                             5,024 thousand
                                                           households
                                                                             9.4   %
                                                                                                                5,003 thousand
                                                                                                                  households
                                                                                                                                    9.0   %

Single-parent and Child(Children)                      Single-parent and Child(Children)                       3generations, etc.
   2,053 thousand
     households
                     5.7   %
                                                          4,748 thousand
                                                            households
                                                                             8.9   %                             4,283 thousand
                                                                                                                   households
                                                                                                                                    7.7   %

※Based on the National Census by Ministry of Internal Affairs and Communications. Percentage of general households. 3 generations, etc. is the sum of households
 with only relatives other than nuclear family members and households that include non-relatives.                                                              13
Changing Lifestyles of Men
13% of men take childcare leave. One in four 50-year-old men are unmarried (which means they never married). There are 10.94
million of male single-person households (which makes 19.6% of ordinary households). More engagement of men at home and in
the community is necessary.

            Proportion of employees who take childcare                                                            Number of male single-person households (by age group):
                    leave in the private sector                                                                                        10.94 million
                                                                                                         (10,000 households)
                             FY2018               FY2019                 FY2020
                                                                                                           200        198.4       * 10.21 million female single-person households (18.3% of ordinary households)
                                                                                                                                                                                     With spouse
          Women               82%                   83%                   82%                                                     144.4       150.5        154.8                                       Unknown
                                                                                                           150                                                           134.2       Unmarried         Separated
            Men                6%                    7%                   13%                                                                                                         106.9            Bereaved
                                                                                                           100
       Note: Compiled by the Gender Equality Bureau, Cabinet Office, based on the Basic
             Survey of Gender Equality in Employment Management, MHLW                                                                                                                               54.8
                                                                                                             50
         ■ Percentage of male national public employees (general) who took childcare leave
          (survey by National Personnel Authority)
          • 51.4% (FY2020)                                                                                    0
         ■ Percentage male local public employees who took childcare leave (survey by MIC)                            20–29
                                                                                                                    20~29歳        30–39
                                                                                                                                30~39歳         45–49
                                                                                                                                             40~49歳         50–59
                                                                                                                                                          50~59歳        60–69
                                                                                                                                                                       60~69歳         70–79
                                                                                                                                                                                    70~79歳          80+
                                                                                                                                                                                                  80歳以上
          • 13.2% (FY2020)
                                                                                                      Source: Compiled by the Gender Equality Bureau, Cabinet Office, based on the 2020 Population Census, MIC.

                                                                                                                       Primary caregiver for a family member who
               Proportion of the unmarried at age 50                                                                               live together with
   30 (%)                                                                                                                                Daughter-in-law
                                                                                    25.69                                                                                                 Wife
                                                                          23.37
   25                                                 Men

   20                                                                                                                             Daughter
   15
                                                                                    16.37
   10                                                                     14.06
     5        3.33                                                                                                                                                                      Husband
                                                                    Women                                                                                     Son-in-law
                                                                                                                                      Son
     0 1.70
          1970 1980 1990 2000 2005 2010 2015 2020                                                                     2001        2004        2007          2010         2013          2016          2019
                                                                                             (Year)
Sources: Compiled by the Gender Equality Bureau, Cabinet Office, based on the Annual                              Compiled by the Gender Equality Bureau, Cabinet Office, based on the Comprehensive
         Population and Social Security Surveys (2021), National Institute of Population and
         Social Security Research, for 1970-2015, and the 2020 Population Census, MIC, for 2020.
                                                                                                                  Survey of Living Conditions, MHLW.
                                                                                                                                                                                                             14
Changes in Number of Dual-Income Households, etc.
                                   (households where the wife is 64 years old or younger)
 [10,000 households]

1,200                                                                                                                                                                    1173
                               Dual-income households
                                                                                                                                                                                      1177

1,000      937

 800
           849

 600                      Households consisting of an employed
                          husband and a wife without paid work                                                                                                            462

 400                                                                                                                                                                                  458

 200

   0
          2002
           14                2004
                              16             2006
                                              18                2008
                                                                 20               2010
                                                                                    22              2012
                                                                                                     24            2014
                                                                                                                     26              2016
                                                                                                                                       28               2018
                                                                                                                                                         30              2020
                                                                                                                                                                           2 2021
                                                                                                                                                                               3
        (2002)            (2004)             (2006)            (2008)             (2010)          (2012)           (2014)            (2016)            (2018)             (2020) (2021)
    ※ Produced by the Gender Equality Bureau, Cabinet Office based on the Labour Force Survey (Detailed tabulation) by Ministry of Internal Affairs and Communications.
    ※”Dual-income households” refers to households in which both spouses are employed in the non-agricultural and forestry sectors (including non-regular staff and employees) and
        are 64 years of age or younger. “Households consisting of a husband who work as employee and a non working wife” refers to households in which the husband is a non-
        agricultural or forestry employee and the wife is a non-working person (non-working population or unemployed) and 64 years old or younger. Values for 2010 and 2011 are for
        the entire country except for Iwate, Miyagi, and Fukushima prefectures.                                                                                                        15
Employment Rates of Married Women
               by Their Husbands’ Income (aged 30-39)

Employment rates
of wives (%)
   80
                                       75.4
   75                     73.3                       72.9
                                    74.5
              68.2
   70                       69.3
                                              71.0             68.7
   65                                                   67.2
              65.2
                                                                          62.6              All households
   60
                                                                  59.5              56.3
   55                                                                                             54.6
                                                                                                               50.8
                                                                                                                          49.0
   50                                                                            52.2      51.3                                     48.5

   45                                                                                                   46.3
                                                                                 Households with children              45.5                   40.1
   40                                                                                                                            41.8           39.7

   35

   30
          less than 1~1.99         2~2.99     3~3.99    4~4.99        5~5.99     6~6.99    7~7.99        8~8.99       9~9.99 10~14.99 more than
              1                                                                                                                          15
                                                                                                                                           Husbands’ income
                                                                                                                                           (million yen)
   Source: Prepared by the Gender Equality Bureau, Cabinet Office, based on the Employment Status Survey (2017), by Ministry
           of Internal Affairs and Communications.
                                                                                                                                                       16
Percentages of Employed Persons by Income
                                              (by sex, marital status, and age)
                              Men (married)                                                                    Men (unmarried)
100%                                                                               100%

 80%                                                                                80%

 60%                                                                                60%

 40%                                                                                40%

 20%                                                                                20%

  0%                                                                                 0%

                            Women (married)                                                                  Women (unmarried)
100%                                                                               100%

 80%                                                                                80%

 60%                                                                                60%

 40%                                                                                40%

 20%                                                                                20%

  0%                                                                                 0%

                                less than 1          1~1.99                2~2.99                3~3.99                 4~4.99
                               5~5.99                6~6.99                7~9.99                 10 more than                     (million yen)
Source: Prepared by the Gender Equality Bureau, Cabinet Office, based on the Employment Status Survey (2017), by Ministry of Internal Affairs and Communications.
                                                                                                                                                            17
Income of Married Women with
  日本人の年齢構造と国会議員の年齢構造                                                                  a Bachelor Degree or Higher
      100%
                                                                                                                                              1000万円以上
                                                                                                                                              10 million yen or higher

       90%                                                                                                                                    700~999万円
                                                                                                                                              7–9.99 million yen

                                                                                                                                              600~699万円
                                                                                                                                              6–6.99 million yen

       80%                                                                                                                                    500~599万円
                                                                                                                                              5–5.99 million yen

                                                                                                                                              400~499万円
                                                                                                                                              4–4.99 million yen
       70%                                                                                                                                    300~399万円
                                                                                                                                              3–3.99 million yen

                                                                                                                                              200~299万円
                                                                                                                                              2–2.99 million yen
       60%                                                                                                                                    100~199万円
                                                                                                                                              1–1.99 million yen

                                                                                                                                              100万円未満
                                                                                                                                              Less than 1 million yen
       50%                                                                                                                                    無業者
                                                                                                                                              Unemployed

       40%

       30%                                                               about                          about                               about
                                          about                          60%                                                                70%
                                          50%                                                           60%
       20%

       10%

        0%
                         25–34
                        25~34歳                         35–44
                                                      35~44歳                           45–54
                                                                                     45~54歳                          55–64
                                                                                                                    55~64歳          (Age)

Notes:1. Produced by the Gender Equality Bureau, Cabinet Office, based on the Employment Status Survey (2017), Ministry of Internal Affairs and Communications.
      2. Unemployed does not include those people who resigned from their previous job in 1987 or earlier and are still unemployed. Therefore, the number of
         unemployed persons aged 50 or over as of 2017 may in fact be more.                                                                                     18
Single-Parent Households
Over the last 30 years, single-mother households have increased by 1.5 times, single-father households by 1.1 times.
Single-mother households* 0.849million households        1.232 million households (approx. 86.8% of single-parent households)
Single-father households* 0.173million households         0.187million households (approx. 13.2% of single-parent households)
                                        (FY1988)                                                                     (FY2016)
* Total single-mother and single-father households, including households with a co-habitant other than the parent
                                                  Reference: In 2019, there were 11.22 million households with children (Comprehensive Survey of Living Conditions).

                                                     Single-mother                           Single-father
                                                                                                                             General households (ref.)
                                                      households                              households
    Employment
                                                         81.8%
    rate
             Of employees:
             Regular
             Of employees:
             Non-regular                             52.3%

                                                                                        3.98 million yen                   Average earnings
    Average annual work                            2 million yen
                                             Regular: 3.05 million yen              Regular: 4.28million yen                                  million yen
    income                                   Part-time, etc.: 1.33 million yen      Part-time, etc.: 1.90 million yen                    million yen

    Rate of single-parents who receive
    child support

Source: Single-mother and single-father household figures were drawn from Ministry of Health, Labour and Welfare, FY2016 National Survey on Single-
        Parent Households, general households from Ministry of Internal Affairs and Communications, FY2021 Labour Force Survey (aged 15 to 64 )and
        National Tax Agency, FY2020 Statistical Survey of Actual Status for Salary in the Private Sector.
* The composition ratios of regular and non-regular workers in single-mother and single-father households were calculated from the totals of “regular staff”
and “non-regular staff” (total of “Part-time, etc. workers” and “dispatch workers”).                                                                             19
Ages of Mother and Youngest Child in Single-mother Households at Time of Divorce, etc.
  • Approximately half (48.4%) of mothers were in their 30s when they became a single-mother household, followed by 20s (28.8%) and 40s
    (19.4%).
  • In nearly 70% of cases, the youngest child was aged five years or younger when the family became a single-mother household.

 〇 Single-mother households, by mother’s age
                      0%               10%               20%               30%               40%               50%               60%               70%               80%               90%             100%

                          1.9
                                                                                                                                                                                                              0.0
         Divorce,
         離婚等                                       28.8                                                                 48.4                                                         19.4                1.3
           etc.
Total number: 1,709
Average age: 33.4 years

                                      20歳未満
                                       Under 20                 20~29歳
                                                                20–29                     30~39歳
                                                                                          30–39                     40~49歳
                                                                                                                    40–49                      50~59歳
                                                                                                                                                50–59                    60歳以上
                                                                                                                                                                          60+

 〇 Single-mother households, by age of youngest child
                       0%              10%               20%               30%               40%               50%               60%               70%               80%               90%              100%

                                                                                                                                                                                                               0.2
         Divorce,
          離婚等                                                  45.7                                                         22.7                             14.6                   8.9          5.7 2.3
           etc.
Total number: 1,627
Average age: 4.3 years

                                  0–2
                                  0~2 歳                  3–5
                                                         3~5 歳                  6–8 歳
                                                                               6~8                   9–11
                                                                                                     9~11歳                   12–14
                                                                                                                            12~14歳                    15–17
                                                                                                                                                     15~17歳                     18–19
                                                                                                                                                                               18・19歳
Notes:    1. Compiled by the Gender Equality Bureau, Cabinet Office, based on the FY2016 Nationwide Survey on Single Parent Household, MHLW.
          2. A single-mother household is a household in which a fatherless child (aged under 20 years, unmarried) is raised by their mother.
             A single-father household is a household in which a motherless child is raised by their father.
          3. “Divorce, etc.” is defined as living separately in the FY2016 Nationwide Survey on Single Parent Household, and is the sum of divorced, unmarried mothers, deserted, missing and other.
          4. The percentage of single-mother households, by mother’s age group, is calculated as a fraction of all households excluding those in which the mother’s age at the time the family became a single-mother
             household was unknown.
          5. The percentage of single-mother households, by age of youngest child, is calculated as a fraction of all households excluding those in which the youngest child’s age at the time the family became a single-
             mother household was unknown.
Distribution of Equivalent Disposable Income for All Households and for Single-parent Households
 • Approximately half of single-parent households* had an equivalent disposable income at or below the poverty line.
   * Active households with child(ren) and one adult

     (%)
                                                                      All households (2015, 2018)
   16                          Poverty line in 2018
                                 (1,270,000 yen)
   14
                                                             2015                                  2018
   12
   10
    8
    6
    4
    2
    0

                                                                                                                                                                               (10,000 yen)
                             Single-parent households (active households with child(ren) (1 adult)) (2015, 2018)
      (%)
   16                         Poverty line in 2018
   14                           (1,270,000 yen)
   12                                                                         2015
                                                                                                2018
   10
    8
    6
    4
    2
    0

                                                                                                                                                                               (10,000 yen)
Compiled by the Gender Equality Bureau, Cabinet Office, based on the Comprehensive Survey of Living Conditions, MHLW. Figures for 2015 exclude Kumamoto Prefecture. “Adult” refers to a

                                                                                                                                                                                        21
person aged 18 years or older, and “child” refers to a person aged 17 years or younger. “Active household” refers to a household in which the head of the household is aged 18 or older but
younger than 65. Excludes household members whose equivalent disposable income is unknown.
Impacts of COVID-19 on Women’s Employment
                                                                     Changes in the Number of Employed Persons
                                                                                                                                                                                   (Ten thousand
                                                                                              2019 Average                                                                           people)
(Ten thousand people)                             Men                                                                        2020 Average                        2021 Average
                                              (left scale)                               67.50million persons         67.10 million persons               67.13 million persons
       3800                                                                                                                                                                            3120
                                                                                         (+0.68)                      (▲0.40)                             (+0.03)
                                                                                3748     Men 37.44 (+0.18)            Men 37.24 (▲0.20)                   Men 37.11 (▲0.13)
       3760                                                                              Women 30.05 (+0,49)          Women 29.86 (▲0.19)                 Women 30.02(+0.16)
                                                                                                                                                                                       3080

       3720
                                                                      ▲32              3716                                                                                     3698
                                                                                                                                                                                       3040
                  3719
       3680                                                          3011                                                                                                              3000
                                                                      ▲63                                                                                                       3014
       3640      2974               Women                                                                                                                                              2960
                                 (right scale)
                                                                                    2948
       3600                                                                                                                                                                            2920
                  1 2 3 4 5 6 7 8 9 10 11 12 1 2 3 4 5 6 7 8 9 10 11 12 1 2 3 4 5 6 7 8 9 10 11 12 1 2 3
                  2019                                                 2020                                          2021                                                 2022
                                     (Prepared from “Labour Force Survey” by Ministry of Internal Affairs and Communications. Seasonally adjusted series.)

                                                    Year-on-Year Changes in the Numbers of Employed Persons by Industry
 (Ten thousand people)
                                                                             Changes compared to (Ten thousand people)                              Women                 Changes compared to
      60                                            Men                      the same period of 2019 60         The number of
                                                                                                                                       Information and                    the same period of 2019
               The number of                                                                                   employed person                          Medical, health
                                     Information and                                                                                   communications
              employed person                              Medical, health                                                                             care and Welfare
      40                             communications                                                    40
                                                          care and Welfare

      20                                                                                               20

       0                                                                                                0

     -20                                                                                              -20    Accommodations, Eating
                 Accommodations, Eating                                                                       and drinking services
                  and drinking services                                                               -40
     -40

     -60             Living-related and personal                                                      -60
                  services and amusement services                                                                Living-related and personal services   Others
                                                       Others                                         -80             and amusement services
     -80

                                                                                                     -100
     -100
                                                                                                            1~3 4~6 7~9 10~12 1~3 4~6 7~9 10~12 1~3 4~6 7~9 10~12 1~3
            1~3 4~6 7~9 10~12 1~3 4~6 7~9 10~12 1~3 4~6 7~9 10~12 1~3
            2019              2020              2021              2022                                       2019              2020              2021             2022
                                  (Prepared from “Labour Force Survey” by Ministry of Internal Affairs and Communications. Original series)                                                     22
Changes in the Number of DV Consultations, Ages of those who received DV Consultations, and
                                  Content of Consultations
  Changes in the number of DV consultations                                                              Ages of those                           People in their 30s and 40s account for about 50% of the total.

  The number of DV consultations in FY2020 was about                                                    who received DV                                                                                    (N=15,060)

  1.5times that of the previous year.                                                                    consultations
      (Cases)
   200,000

   150,000

   100,000                                                     182,188                                    Contents of consultation
                                                                                                                                                              About 60% of the consultations involved mental domestic violence.
                            119,276                                                                         (multiple answers)
     50,000
                                                                                                                       Physical
            0
                             FY2019                              FY2020                                                  Mental
                      (before the spread of                                                                            Sexual
                           COVID19)                                                                                Economical
                                                 (Source) Gender Equality Bureau, Cabinet Office
                                                                                                                          Social
  Changes in the Number of DV Consultations                                                                                                                   (Source:) Report on "Survey and Research Project for Analysis of Consultation
               (every month)                                                                                                                                  Support in the DV Consultation (Plus Project" for the first half of FY 2021.

         The number of consultations in FY2020 is 182,188, approximately 1.5 times the number in FY 2019.
             Spousal Violence       Domestic Violence Hotline Plus
(Cases)       Counseling and           (From April 2020)
             Support Centers

                  April             May              June               July            August           September          October        November           December          January           February
          According to a survey by Gender Equality Bureau, Cabinet Office. Provisional number of consultations at Spousal Violence Counseling and Support Centers nationwide as of February 28, 2022.
                                                                                                                                                                                                                     March
                                                                                                                                                                                                                                    23
Sexual Crimes and Sexual Violence
                                  Experiences of forced sexual intercourse, etc.
                                     About 1 in 14 women have experienced forced sexual intercourse, etc.

                                          by one person, 5.3%                  by more than one
                                                                               person, 1.6%              N/A, 3.9%

                                     Women                                       Never, 89.2%

                                       Experienced forced sexual intercourse
                                                                                                 Women                Cabinet Office, "Survey on Violence between Men and Women.
                                                                                                                      (Released in March 2021)

                                          Changes in the number of consultations at 52 One-Stop Support Centers
                                     for Victims of Sexual Crimes and Sexual Violence nationwide (first half of FY2021)

               (Cases)
              6,000                 FY 2021                                                                            (Cases)
           FY 2020                          5,186      5,065                                                         30,000
                               4,883                               5,000                                                              +26.4%
              5,000                                                              4,748
                                                                                            4,543
            FY 2019                                                                                                  25,000
                                                                               4,505
              4,000                                              4,293                   4,219
                                                     4,072                                                           20,000

              3,000                      3,139                                                                       15,000                                 29,425
                            3,058
                                                                                                                                                23,286
              2,000                                                                                                  10,000        19,964
                                                              3,437       3,561        3,561
                                     3,235        3,281
                          2,889
                                                                                                                      5,000
              1,000

                                                                                                                           0
                                                                                                                                      1H           1H           1H
                     0
                                                                                                                                                                         24
                            Apr.          May       Jun.        Jul.        Aug.        Sep.                                        FY 2019     FY 2020       FY 2021
Note: The number of consultations is the total number of consultations by phone, interview, email, SNS, etc.
The Number of Suicides
                     Changes in the Number of Suicides                                                                                  The Number of suicides among employed or working
                                                                                                                                                             women
        2019 total                          2020 total                                2021 total
                                                                                                                     (People)
                                                                                                                                                                                                                   1,534          1,549
                                       21,081 people                            21,007 people
                                                                                                                          1800                                                                               (+389 people     (+404 people
  20,169 people                        (+912)                                                                             1600
                                                                                                                                                                                       1,238
                                                                                                                                                                                                           compared to 2019)compared to 2019)

     Men 14,078                                                                 (▲74)                                     1400           1,153                          1,117                        1,145
                                   Men 14,055(▲23)                                                                                                       1,085
                                                                           Men 13,939(▲116)                               1200                                                                                      286           307
     Women 6,091                      Women 7,026
                                                                           Women 7,068(+42)                               1000                                                         266
                                       (+935)                                                                                               234                         214                          221            367           352
                                                                                                                           800                            215
                                                                                                                                            275           252           300            304           288
                                                                                                                           600                                                                                      308           307
      Jan.-Apr. 2020                      Jan.-Apr. 2021                            Jan.-Apr. 2022
                                                                                                                           400              277           270           229            253           211
                                                                                                                                                                                                                                  410
    6,415 people                        7,321 people                             6,849 people                              200
                                                                                                                                            238           212           246            254           277
                                                                                                                                                                                                                    401

      Men 4,553                                                                                                              0
                                       (+906)                                   (▲472)
     Women 1,882                                                                                                                         2015          2016        2017               2018         2019         2020
                                                                                                                                                                                                               2020      2021
                                   Men 4,904(+371)                          Men 4,628(▲276)
                                                                                                                                        ~19歳old
                                                                                                                                        ~19years           20~29歳
                                                                                                                                                          20~29years old            30~39歳            40~49歳
                                                                                                                                                                                                      40~49years  old 50~59歳
                                                                                                                                                                                                                       50~59years old
                                      Women 2,417                              Women 2,221                                                                                          30~39years old
                                                                                                                                        60~69歳
                                                                                                                                        60~69years old     70~79歳
                                                                                                                                                          70~79years old            80歳~
                                                                                                                                                                                    80years old~      不詳
                                                                                                                                                                                                      unidentified    総数total
                                       (+535)                                   (▲196)

 Note: Prepared from “Number of Suicides” on the National Police Agency’s website. Original series. Figures by            Note: Prepared from “Suicide Statistics” Ministry of Health, Labour and Welfare’s website.
 2021 are definite. Figures for 2022 are provisional as of May 20, 2022.                                                  The number of suicides based on the date of discovery (the number of suicides discovered in the year).

                                                                    Numbers of suicides among unemployed women
  (People)
                                             <Unemployed women>                                                                    (People)   <Housewives (included in the number of unemployed women)>
   8000                                                                                                                              2000
                                                                                           4,876         4,886                                    1,498                                                                   1,168         1,136
                 5,733
   6000                        5,211          4,908
                                                                                     ( +405 people   ( +415 people
                                                                                                                                                                1,340
                                                             4,804                                 compared to 2019)
                                                                                   compared to 2019)                                 1500                                     1,215
                                                                                                                                                                                                                  (+143 people    (+111 people
                 1,027
                                                                           4,471                                                                   183                                       1,095              compared to 2019)
                                                                                                                                                                                                                                compared to 2019)
                                 955                                                                                                                                                                       1,025
                                                                                                                      Break down

                                                928                                        888            872                                                    162
                                                              935                                                                                  354                          144
   4000          1,194
                                1,044
                                                                             827                                                     1000                                                      137
                                                                                                                                                                                                                           153          166
                                              1,027                                       1,046          1,049                                                   339                                         122
                                                             1,016           960                                                                                                293                                        251          242
                 1,071          1,003                                                                                                                                                          242           222
                                                872           833                          786            747                                      397
                                                                             726                                                                                 359                                                       313
   2000           791            735            738                                        716            770                         500                                       347            304           288                        322
                                                              699            679
                  826            696            638           652            588           700            667                                      315           273            242            229           203           273          236
         0                                                                                                                                         172           124            113            113           117           118          106
                                                                                                                                        0
                 2015           2016          2017           2018           2019          2020           2021                                     2015           2016           2017         2018           2019           2020         2021
              ~19歳old                20~29歳                 30~39歳old              40~49歳                50~59歳
              ~19years
              60~69歳old
              60~69years
                                     20~29years old
                                     70~79歳
                                     70~79years old
                                                            30~39years
                                                            80歳~
                                                            80years old~
                                                                                   40~49years
                                                                                   不詳
                                                                                              old
                                                                                   unidentified
                                                                                                         50~59years
                                                                                                          総数
                                                                                                          total
                                                                                                                    old                       ~19歳old
                                                                                                                                              ~19years
                                                                                                                                              60~69歳
                                                                                                                                              60~69years old
                                                                                                                                                                   20~29歳
                                                                                                                                                                   20~29years
                                                                                                                                                                   70~79歳old
                                                                                                                                                                   70~79years
                                                                                                                                                                              old         30~39歳
                                                                                                                                                                                          30~39years old
                                                                                                                                                                                          80歳~
                                                                                                                                                                                          80years old~
                                                                                                                                                                                                                40~49歳
                                                                                                                                                                                                                40~49years old
                                                                                                                                                                                                                不詳
                                                                                                                                                                                                                 unidentified       総数
                                                                                                                                                                                                                                        25
                                                                                                                                                                                                                                    50~59歳
                                                                                                                                                                                                                                    50~59years old
                                                                                                                                                                                                                                     total
Note: Prepared from “Suicide Statistics” Ministry of Health, Labour and Welfare’s website. The number of suicides based on the date of discovery (the number of suicides discovered in the year).
                                                                                                                                                                                                                                               25
Measures Against Sexual Assault                                                                                                                              Measures Against
  Policy for enhancement of measures against sexual crimes and sexual assault (Overview)                                                                         Spousal Violence
(June 11, 2020 decision by related ministries and agencies meetings to enhancement of measures against sexual crimes and sexual assault)
Period of intensive enhancement of measures against                                             Initiatives based on the                                            【 DV Consultation Navi】
sexual crimes and sexual assault (Three years from FY2020 to                                 characteristics of Sex Offenses
                                                                                              and Gender Based Violence
FY2022)                                                                                                                                                          ※closest consultation centers
                                                                                                                                                                                   ♯8008

                                                                                                                                       Steady implementation
                  Consider Penal Code and take appropriate steps based on the results
                 Further enhance measures to prevent sex offenders from reoffending

                                                                                                                                              of policy
 First

                    Create conditions conducive to registering complaints and seeking
                                                 advice
                                         Establish seamless, full victim support
                 Educate and raise awareness to change society’s mindset and prevent
                                              violence

                                                      Nights and holidays call
                                                      centers for victims of sexual
                                                      violence (from Oct. 1, 2021)

                                                   The support is provided in cooperation
                                                   with One-Stop support centers. The
   One-stop support centers for
                                                   support is available on nights and
   victims of sexual crimes and                    holidays to respond to victims outside                         Cure Time
   sexual violence                                 of the operating hours of the closest               SNS consultation on sexual
        Nationwide Speed dial                      One-Stop service centers.                                   violence
              「#8891」                                                                                                                                                                           Start 20.April
                                                                                                                                                               Domestic Violence Hotline Plus
                                                                                                                                                                                                2020

                                                                                                                                                                                                      SNS
                                                                                                                                                                                                      Mail

                                                                                                                                                               24Hours(Japanese
                                                       State Guest House
                                                       Akasaka Palace Purple
                                                                                                                                                                 language only)                      Accompanying,
                                                                                                                                                                                                     protection, etc.
                                                       Light Up campaign                                                       Every                           0120-279-889
                                                                                                                               April
                                                       Nov 12–25, every year
                                                                                                  Stop Youth Sexual
                                                                                                                                                                                                                   26
 Campaign for Eliminating Violence against Women
                                                                                                   Violence Month
Policy Speech by Prime Minister KISHIDA Fumio to the 208th Session of the Diet (Excerpt)
                                                                                           (From the Prime Minister's Office website)

〇When we consider raising household income, the gender pay gap is also a major topic. We will review the rules covering
corporate disclosure to fix the gap.

〇What will become the foundation supporting a new form of capitalism is a society that values diversity, in which all
people can feel their purpose in life, whether old or young, male or female, or having a disability.

〇People’s lifestyles and family styles are becoming increasingly diverse. We will work to promote “Women's economic
empowerment” and eradicate violence against women, including domestic violence, which has increased sharply since the
COVID-19 pandemic started.

〇At the Meeting on a Social Security System Oriented to All Generations, we will advance discussions towards creating a
society in which men and women can work as they wish; towards increasing the number of people supporting the social
security system through, for example, restraining increases in the financial burden borne by the young generation and
providing universal workers’ insurance; and towards building a sustainable social security system in which all people, in
accordance with their ability, mutually assist others.                                                                 27
Prime Minister KISHIDA Fumio’s Message on International Women’s Day 2022
                                                                                                         (From the Prime Minister's Office website)

Hello, everyone. I am KISHIDA Fumio, Prime Minister of Japan.
 Today, March 8, is International Women’s Day, as designated by the United Nations in 1975. I wish to express my sincere respect and
appreciation for the passion and the efforts made by all those working earnestly for gender equality and women’s empowerment on a day-
to-day basis. I also want to celebrate this day together with all of you.
 Promoting gender equality is an important and firmly-rooted policy of the Japanese Government and also a norm we share with the wider
international community. Moreover, it is an indispensable element of a society that values individuality and diversity, which my Cabinet
aims to achieve.
 Regardless, it must be said that the current situation in Japan lags significantly behind that of other countries, as indicated by Japan’s
ranking of 120th place globally in the Gender Gap Index. Structural issues are considered to form the backdrop for our current
circumstances, including the existence of a wage gap between men and women and fixed gender role awareness.
 I believe “Economic empowerment” is the key to responding to the challenges and structural issues that Japan’s women are facing. I have
placed “Economic empowerment” at the very core of a “New form of capitalism,” the showcase policy of the Kishida administration.
 We will foster an environment in which women can be financially independent. We will achieve this by taking all manner of measures,
including reviewing public prices, which will precede wage increases in the private sector, reviewing corporate disclosure rules with a view
to rectifying wage discrepancies between men and women, and creating a society in which both men and women can work in the manner
they choose.
As we mark International Women’s Day, as prime minister I once again pledge to do my utmost to enable all women in Japan, and indeed
all women around the world, to walk, full of vitality, down the paths that they themselves choose.
                                                                                                                                            28
You can also read