CYP3A4 mediated pharmacokinetics drug interaction potential of Maha Yogaraj Gugglu and E, Z guggulsterone - Nature
←
→
Page content transcription
If your browser does not render page correctly, please read the page content below
www.nature.com/scientificreports
OPEN CYP3A4 mediated
pharmacokinetics drug interaction
potential of Maha‑Yogaraj Gugglu
and E, Z guggulsterone
Sarvesh Sabarathinam1, Satish Kumar Rajappan Chandra2 &
Vijayakumar Thangavel Mahalingam1*
Maha yogaraja guggulu (MYG) is a classical herbomineral polyherbal formulation being widely used
since centuries. The aim of this study was to investigate the effect of MYG formulation and its major
constituents E & Z guggulsterone on CYP3A4 mediated metabolism. In vitro inhibition of MYG and
Guggulsterone isomers on CYP3A4 was evaluated by high throughput fluorometric assay. Eighteen
Adult male Sprague–Dawley rats (200 ± 25 g body weight) were randomly divided into three groups.
Group A, Group B and Group C were treated with placebo, MYG and Standard E & Z guggulsterone
for 14 days respectively by oral route. On 15th day, midazolam (5 mg/kg) was administered orally to
all rats in each group. Blood samples (0.3 mL) were collected from the retro orbital vein at 0.25, 0.5,
0.75, 1, 2, 4, 6, 12 and 24 h of each rat were collected. The findings from the in vitro & in vivo study
proposed that the MYG tablets and its guggulsterone isomers have drug interaction potential when
consumed along with conventional drugs which are CYP3A4 substrates. In vivo pharmacokinetic drug
interaction study of midazolam pointed out that the MYG tablets and guggulsterone isomers showed
an inhibitory activity towards CYP3A4 which may have leads to clinically significant interactions.
The use of alternative medicine such as herbal medicines, phytonutrients, ayurvedic products and nutraceuticals
used widely by the majority of the patients for their primary healthcare needs. Utilization of classical herbal
medicines has increased steadily for the last few decades. Most of the classical herbal medicines are chosen over
conventional medicines because of their assumed safe nature1. Cytochrome enzymes play a crucial role in drug
metabolism, and the majority of the drugs are metabolized by CYP3A4 enzyme. Inhibition/Induction of drug
metabolism is a common cause of clinically important pharmacokinetic herb-drug i nteractions2. The specific sub-
strate of CYP450 enzyme may interact with the active phytochemical compounds of herbal medication and which
can diminish the metabolic clearance of a co-administered conventional m edicine3. This issue is significantly
safety concern, especially important with drugs having narrow therapeutic index such as warfarin or digoxin4,5.
Maha-Yograj Gugglu (MYG) tablet is widely used for the management of rheumatoid arthritis, inflammation,
cholesterol-lowering activity, facial paralysis and hemorrhoids. Gugglu is naturally occurring oleoresin from
Commiphora Mukul. Gugglu produces a synergistic effect due to the presence of bioactive compounds such as
E and Z guggulsterone and guggul lipid. The hypolipidemic activity of gugglu and its various fractions has been
studied in several animal models, and clinical studies E-guggulsterone and Z-guggulsterone which reported to
be the main compounds play a major role in lipid-lowering activity in patients with obesity and hypercholes-
terolemia was found in clinical studies with crude gugglu. For the hypolipidemic action of gugglu, there was a
numerous mechanism of action has been established so far. Gugglu may reduce hepatic steroid production, which
is responsible for the elevation of plasma LDL cholesterol. Chief components of gugglu, E and Z guggulsterone,
may elevate the binding sites of LDL cholesterol in the liver and increasing the clearance rate of LDL. Though,
recent findings have proposed that the active isomer of guggulsterone are the highly effective antagonist of the
farnesoid X receptor (FXR), a nuclear hormone receptor that is activated by bile acids, thus allowing increased
cholesterol catabolism and excretion from the b ody6.
1
Department of Pharmacy Practice, SRM College of Pharmacy, SRM Institute of Science and Technology,
Kattankulathur 603 203, Tamil Nadu, India. 2Drug Testing Laboratory, Interdisciplinary Institute of Indian System
of Medicine (IIISM), SRM Institute of Science and Technology, Kattankulathur 603 203, Tamil Nadu, India. *email:
vijaypractice@yahoo.com
Scientific Reports | (2021) 11:715 | https://doi.org/10.1038/s41598-020-80595-5 1
Vol.:(0123456789)www.nature.com/scientificreports/
Figure 1. Chemical structure of E – guggulsterone (a) and Z – guggulsterone (b).
To estimate CYP3A4 mediated drug interaction, midazolam is an established sensitive probe drug due to
its high fraction metabolized by CYP3A4 of 90%7,8. There may be a chance of occurring unintended potential
herb-drug interactions through CYP3A4 inhibition/induction when herbal medicines containing E and Z gug-
gulsterone used concomitantly. Thus, the present study was attempted to investigate the metabolism mediated
pharmacokinetics drug interaction of MYG and E, Z guggulsterone (Fig. 1.) by in vitro assays and in vivo in
rats. To the best of our knowledge, no studies have been conducted towards the estimation of drug interaction
potential of MYG and E, Z guggulsterone by CYP450 inhibition assay and with midazolam in rat model.
Materials and methods
Herbal materials, chemicals and instrumentation. MYG (500 mg tablets contains 17.5 mg of gug-
gulsterones) were purchased from AVN Ayurveda Formulations Pvt Ltd. Madurai, India. Midazolam (purity
98.0%), E & Z—guggulsterone (purity 98.0%) were also purchased from SIGMA-ALDRICH Company (St.
Louis, MO). HPLC grade acetonitrile and Methanol were from Merck Company (Darmstadt, Germany). VIVID
CYP450 Screening Kit and VIVID Substrates were purchased from Invitrogen Drug Discovery Solutions, USA.
VIVID CYP3A4 Red (Cat. no. P2856). Ketoconazole was obtained as a gift sample from M/s Micro Labs Pvt. Ltd,
Hosur, Tamil Nadu, India. All other chemicals were of analytical grade and used without further purification. All
analysis was performed with liquid chromatographic system, (AGILENT technologies 1220 Infinity II LC using
PDA detector). LC solution software is used to record the data. C18- 250 mm × 4.6 mm & 5 µm). other apparatus
included Camag Linomat V (Switzerland) sample applicator, CAMAG automatic TLC sampler III, Remi com-
pact laboratory high speed centrifuge, Electronic balance and PCI Stainless steel analytical ultra Sonicator bath.
Effect of MYG and E, Z—guggulsterone on pooled rat microsomes. Liver microsomes were iso-
lated from Adult male Sprague–Dawley rats (weight 200–250 g) based on the method described by Pandit et al.9.
The Experimental protocol was approved by the Institutional Animal Ethical Committee (662/PO/Re/2002/
CPCSEA Approval No. IAE/212/2019), SRM College of Pharmacy, SRM Institute of Science and Technology.
The Protein concentrations in the liver microsomes were determined by modified biuret method (Multiskan GO
Microplate Spectrophotometer, Thermo Scientific, and Waltham, MA, USA) using bovine serum albumin (BSA)
as standard. BSA powder was dissolved in distilled water and diluted to a concentration of 1 μg/μl. A series of
dilutions (0, 1, 2.5, 5, 10, and 20 μg/well) were made in replicates of 4 with a final volume of 100 μl. After stand-
ards and samples were diluted and transferred to the microplate, 200 μl of biuret reagent was added to each well
and mixed thoroughly with repeated pipetting. The mixture was then allowed to incubate at room temperature
for 20 min. Samples were mixed immediately with repeated pipetting with each addition. Colour was allowed to
develop for 30 min at room temperature and the absorbance was measured at 540 nm and blanked on the water
only control10. Screening of inhibitory activity of MYG and E, Z—guggulsterone was performed with pooled rat
liver microsomes in 96 well microplate, based on the method described by Vijayakumar et al.10. The concentra-
tion of CYP450 was calculated using the formula (Eq. 1).
�APC − �AP
CYP450 (mM) = (1)
91
PC sample, Sample Kept in the Incubator. P Sample, Sample Kept in the room temperature. Where, ΔAPC is the
absorbance difference of the PC sample, and ΔAP is the absorbance difference of the P sample. The percentage
inhibition was calculated using the following formula (Eq. 2).
Blank − Test
%inhibition of CYP450 = × 100 (2)
Blank
High throughput fluorometric assay of CYP3A4. High throughput screening HTS assays were con-
ducted in black 96-well microplates. Fluorescence findings were acquired from BIOTEKFLX 800 fluorescence
microplate reader (BIO TEK, US) using a suitable emission/ excitation wavelength. The assay was carried out in
accordance with the Invitrogen Drug Discovery Solutions, USA pre-determined guidelines. Two-fold serial dilu-
tion of the test samples were prepared and the plates were incubated for 20 min at 37 °C to determine I C50 values.
Scientific Reports | (2021) 11:715 | https://doi.org/10.1038/s41598-020-80595-5 2
Vol:.(1234567890)www.nature.com/scientificreports/
The enzymatic reaction was initiated by the addition of a mixture of NADP + and the appropriate substrate.
Plates were incubated for 10 min at 37 °C and the reaction was stopped by adding 0.5 M tris buffer. All the tests
were performed in triplicate. Product formation from the fluorogenic probes was calculated from fluorescence
data at seven different concentrations of the test and inhibitor (Eq. 3).11
RFU in presence of test compound
%inhibition of CYP3A4 = 1 − × 100 (3)
RFU in absence of test compound
where, RFU is Relative fluorescence unit.
Pharmacokinetics study procedure in rats. Adult male Sprague–Dawley rats (200 ± 25 g body weight)
were obtained from Department of Pharmacology, SRM College of Pharmacy. Before starting the experimental
procedures, all the rats were kept for acclimatization for 1 week in the animal quarters under air conditioning
(25 ± 1 °C) and an automatically controlled photoperiod of 12 h light daily, fed with standard rodent chow and
tap water ad libitum. All experimental procedures and protocols were reviewed and approved by the Institutional
animal ethics Committee and were in accordance with the Guide for the Care and Use of Laboratory Animals.
Eighteen Adult male Sprague–Dawley rats were randomly divided into three groups (a total of 18 rats, n = 6).
Group A: Placebo (Normal saline)
Group B: MYG
Group C: Standard E & Z guggulsterone (10.76 mg).
The MYG tablets were crushed thoroughly and 10 mg dissolved in 10 ml of water and stored at 4 °C until its
administration to the rats. Each animal administered with 0.215 mg/ml concentration of MYG. Group A, Group B
and Group C were treated with placebo, MYG and Standard E & Z guggulsterone solution for 14 days respectively
by oral gavage. 15th day a Midazolam (5 mg/kg) in carboxy methyl cellulose—Na solution was administered
orally to all rats in each group. Blood samples (0.3 mL) were collected from the retro orbital vein into heparin-
ized 1.5 ml polythene tubes at 0.25, 0.5, 0.75, 1, 2, 4, 6, 12 and 24 h of each rat were collected. During the seventh
blood collection, the rats were treated with 2 ml of normal saline in order to restore blood capacity quickly. The
samples were immediately centrifuged at 4000×g for 10 min and the plasma was stored at − 20 °C until analysis.
Chromatographic conditions and quantification of E & Z guggulsterone by HPTLC
method. MYG tablet was standardized by using Camag HPTLC and the E & Z guggulsterone was used
as standard. HPTLC was performed on band width 6 mm with a Camag 100 µl sample syringe (Hamilton,
Bonaduz, Switzerland) on Silica gel precoated aluminum 60 F254 plates (20 cm × 10 cm with 250 μm thickness).
Solution of MYG tablet (10 mg/ml) was prepared by using methanol and the solution was filtered through nylon
syringe filter (0.45 µm). Same procedure was followed to make the solution of E & Z guggulsterone (1 mg/ml).
Different volume of test and standard solutions were applied by Linomat V (Switzerland) sample applicator. The
developed chamber was saturated using (Acetone: Toluene (19:1 v/v)) as a mobile phase. Then the plates were
removed, dried at room temperature and scanned under UV-254 nm. Densitometric scanning is used to esti-
mate the quantity of E & Z guggulsterone in MYG tablet.
Chromatographic conditions for HPLC method. In this chromatographic system, PDA detector
is used (AGILENT technologies 1220 Infinity II LC). LC solution software is used to record the data. C18-
250 mm × 4.6 mm & 5 µm, using a mobile phase containing Acetonitrile: water (ACN) (70:30% v/v). A flow
of 1 ml/min, injection volume of 10 µl, detection wavelength of 220 with the run time of 5mins and instru-
ment was functioned at ambient temperature. The peak purity was checked with the photodiode array detector.
Quantification of compound is determined by peak-area method. The quantification of midazolam & alpha
hydroxy midazolam was performed using HPLC–MS techniques by the peak-area method. SIM mode is per-
formed to determine the target ions (m/z 326 for midazolam, m/z342.50 for alpha hydroxy midazolam and m/z
237 for internal standards). The quantification was estimated with a signal-to-noise ratio of > 10, a precision of
RSD < 20% and RE < 15% verified with five consecutive replicates. Limit of Detection (LOD) were 0.17 μg/ml−1
for Midazolam and 0.12 μg/ml−1 for alpha hydroxy midazolam, Limit of Quantification (LOQ) was 0.85 μg/ml−1
for Midazolam and 0.6 μg/ml−1 for alpha hydroxy midazolam. The linear range used was 5.0–1000 ng/mL in rat
plasma for all analytes. The outcome of chromatographic validation showed that analytical methods were suit-
able for this analysis.
Statistical analysis. The results were presented as the mean ± standard deviation. IC50 values concentra-
tion required to cause a 50% inhibition in enzyme activity were obtained using mean enzyme activity versus
inhibitor concentration curves using GraphPad prism Version 5.01 (GraphPad Prism Software Inc.,USA). Using
the plasma concentration and time curves all the Pharmacokinetics parameters were estimated by non-com-
partmental analysis using Winnonlin software. Comparisons between the groups A, B & C were performed by
analysis of variance (One Way ANOVA.
Scientific Reports | (2021) 11:715 | https://doi.org/10.1038/s41598-020-80595-5 3
Vol.:(0123456789)www.nature.com/scientificreports/
Figure 2. Percentage inhibition of MYG and guggulsterone isomers versus ketoconazole. Values are expressed
in mean ± SEM; n = 3; ANOVA followed by Dunnett’s multiple comparison Test. Level of significance at
*P < 0.05, P < 0.01**.
Results
Standardization of MYG was performed through HPTLC using E & Z guggulsterone as a standard. The calibra-
tion curve for Standard E & Z guggulsterone showed good linearity (2–10 µL). The correlation coefficient for
(r2) was 0.995 and 0.994 for E-guggulsterone and Z-guggulsterone respectively, which showed good correlation
between drug content and peak area. The linear equation for E-guggulsterone is Y = 59.617x + 15.533 for Z- gug-
gulsterone Y = 67.017x + 73.533. The peak of E- guggulsterone and Z- guggulsterone in the MYG tablet was identi-
fied by comparing the R f value of reference standard at 0.61 for E-guggulsterone and 0.23 for Z-guggulsterone.
The findings have been adequate and suitable for further quantitative study. The amount of E-guggulsterone &
Z-g uggulsterone in the MYG tablet was found to be 4.99% (w/w) and 3.95% (w/w) respectively.
The concentration of protein in pooled rat liver microsome was found to be 7.6 mg/ml. CYP450-CO Complex
assay was used to assess the inhibitory potential of MYG and guggulsterone isomers. The CYP450 concentration
of the diluted microsome sample was calculated and was found to be 0.442 nmol/mg of protein. E-guggulsterone
dissolved in DMSO showed higher percentage of inhibition (70.88 ± 2.45%) but MYG tablets (54.44 ± 1.16%,
p < 0.05*) and Z-guggulsterone (40.44 ± 1.67%, p < 0.01**) shown significant difference in the percentage of inhi-
bition when compared to positive control (Ketoconazole) (Fig. 2).
Various concentrations ranging from 2.5 to 250 µg/ml of MYG, E-guggulsterone and Z-guggulsterone were
evaluated for their ability to affect the biotransformation of conventional drugs when administered concomi-
tantly. MYG and guggulsterone isomers showed CYP3A4 mediated inhibitory activity in concentration depend-
ent manner (Fig. 3). All samples were assayed in triplicate, the endpoint mode was selected and IC50 values were
calculated Table 1. IC50 values of E-guggulsterone dissolved in DMSO on CYP3A4 was 03.96 ± 1.04 µg/ml but it
did not show significant difference when compared to positive control (01.74 ± 0.66 µg/ml).
In the present study, RP-HPLC–MS was used for the method development and validation of CYP3A4 probe
drug (midazolam) in rat plasma after oral administration. Good chromatographic separation of midazolam
and alpha hydroxy midazolam was achieved (Fig. 4). The Drug-Drug interaction (DDI) effect of MYG tab-
let and guggulsterones was determined comparing the midazolam pharmacokinetics profiles (Table 2). The
clearance of midazolam in Group A [0.10 ± 0.02 (ng/ml)/h] was significantly decreased (p < 0.05) in Group B
[0.07 ± 0.01 (ng/ml)/h] and Group C [0.05 ± 0.010 (ng/ml)/h]. In Group B and Group C, significant elevation of
AUC (144.5 ± 4.6 μg/ml*h, p < 0.01) and Cmax (31.52 ± 2.34 μg/ml, p < 0.05) was found when compared to Group A.
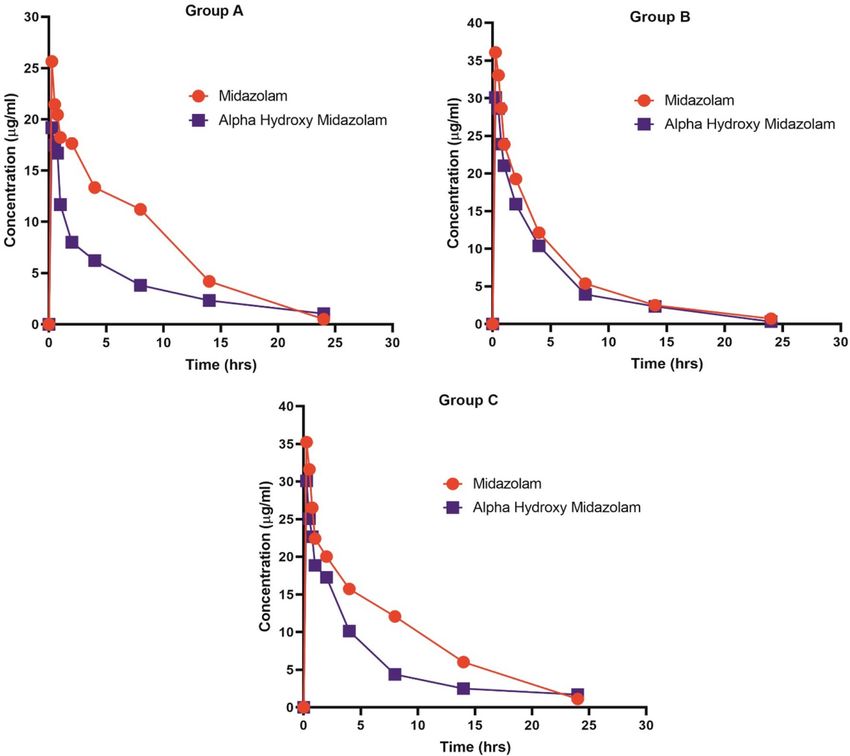
Similarly, midazolam metabolite (alpha hydroxy midazolam) in Group B showed significant elevation in
AUC (113 ± 4.48 μg/ml*h, p < 0.01) and Cmax (32.51 ± 0.63 μg/ml, p < 0.05) when compared with Group A and
Group C. Unlike, midazolam pharmacokinetics, alpha hydroxy midazolam shown significant decrease in Group
B and C when compared to Group A (p < 0.05) in Tmax (Table 3). The results indicated that the metabolism of
midazolam in Group B and C was evidently slowed down hence MYG tablet and its major phytoconstituents
studied (E & Z guggulsterone) had the potential to inhibit rat hepatic CYP450 activity in vivo. Mean plasma
concentration vs Time curves of midazolam and alpha hydroxy midazolam in Group A, Group B and Group C
were presented in Fig. 5.
Discussion
In the contemporary state, there has been a rapid rise in the use of alternative medicines especially herbal medi-
cines for various disorders, Resins from the Commiphora species have been widely used for the management of
arthritis, inflammation, cholesterol lowering activity, obesity, hemorrhoids and gastrointestinal disturbance12,13.
Guggulsterone is one of the major bioactive compounds in commiphora species and also in MYG tablets, which
Scientific Reports | (2021) 11:715 | https://doi.org/10.1038/s41598-020-80595-5 4
Vol:.(1234567890)www.nature.com/scientificreports/
Figure 3. Concentration dependent inhibitory effect of MYG, guggulsterone isomers and ketoconazole on
CYP3A4.
CYP3A4
Test samples IC50 (µg/ml)
MYG 11.43 ± 2.12*
E-guggulsterone 03.96 ± 1.04
Z-guggulsterone 24.08 ± 0.48**
Ketoconazole 01.74 ± 0.66
Table 1. The IC50 (µg/ml) value of MYG, E-guggulsterone, Z-guggulsterone and positive control. Level of
significance at *P < 0.05, **P < 0.01.
is act as inhibitor on Farnesoid X receptor resulting in reduced lipid l evels14. Even though there was no specific
drug toxicity or mortality reported for alternative medicines, there is still risk of herb-drug interactions.
In the present study, an approach was made to evaluate the interaction potential of MYG and isomers of
guggulsterone on CYP450 through rat liver microsomes and high throughput fluorescence screening assay for
CYP3A4. The use of healthy human subjects is considered as ideal approach to generate clinically significant
pharmacokinetic herb-drug interaction information on MYG and guggulsterones. However, due to the risk asso-
ciated with such studies in humans and the rigorous ethical and regulatory requirements, the use of in vitro and
animal models has become the best a lternative15. In both in vitro assays, E-guggulsterone had equal inhibitory
potential as like positive control because there was no significant difference in percentage of CYP450 inhibition
and IC50 values of CYP3A4 of the positive control ketoconazole. As evident from in vitro study, E-guggulsterone
is a major phytomarker has significant interaction potential with CYP3A4 enzymes when compared to extracts
of MYG tablets. In vitro CYP450 assays offer an accurate, relatively inexpensive, first stage assessment tool to
determine the potential for herb-drug interactions. They are useful for initial risk assessment of herbal medicines
capable of causing adverse herb-drug interactions when taken concomitantly with allopathic drugs metabolized
by the same enzyme16. We have selected CYP3A4 probe drug, midazolam for the estimation of drug interaction
potential of MYG tablets and guggulsterone isomers for in vivo method.
The preclinical pharmacokinetic drug interaction study revealed that the significant increases in AUC and
slight increase in Cmax of midazolam in the MYG Tablets and guggulsterone isomers treated groups (Group B
& C) were indicative of enhanced bioavailability of the drug. According to Jambhekar and B reen17, AUC and
Cmax are used in the measurement of the extent of drug bioavailability which inter alia is dependent on first-
pass effect. Therefore, the higher values of AUC and Cmax in the MYG Tablets and guggulsterone treated rats
were indicative of enhanced systemic availability of midazolam and possible inhibition of CYP450 enzymes
involved in the metabolism of midazolam i.e. CYP3A4 and CYP2C11 both in the intestine and liver. Simultane-
ous administration of this herb with drugs which are metabolized by CYP3A4 enzyme may lead to unintended
drug interactions and severe adverse drug events that may impede drug adherence. In order to prevent or predict
interactions, assessment of which herbal medications a patient is taking should be part of the treatment planning
or therapeutic decision making stage.
Scientific Reports | (2021) 11:715 | https://doi.org/10.1038/s41598-020-80595-5 5
Vol.:(0123456789)www.nature.com/scientificreports/
Figure 4. (a) HPLC Chromatogram of Standard midazolam, (b) HPLC Chromatogram of alpha hydroxy
midazolam, (c) HPLC Chromatogram of midazolam (50 µg/ml), and alpha hydroxy midazolam (49.6 µg/ml) in
rat plasma.
Group A (n = 6) Group B (n = 6) Group C (n = 6)
Parameters Placebo MYG E & Z guggulsterone
Tmax (h) 0.09 ± 0.01 0.08 ± 0.012 0.07 ± 0.007
Cmax (μg/ml) 25.29 ± 12 31.52 ± 2.34* 35.5316 ± 1.57ɸ
AUC0-t (μg/ml*h) 109.22 ± 32 144.5 ± 4.6** 169.4 ± 3.52ɸɸ
AUC0-inf (μg/ml*h) 110.91 ± 0.1 145.9 ± 3.7*** 169.9 ± 4.01ɸɸɸ
T1/2 (h) 1.45 ± 0.1 1.5 ± 0.01 2.01
CL/F (ng/ml)/h 0.10 ± 0.02 0.07 ± 0.01* 0.05 ± 0.010ɸ
Table 2. Pharmacokinetic parameters of midazolam in rat plasma. Values are expressed in mean ± SD; (*)
P < 0.05 Group A vs Group B; (ɸ) P < 0.05 Group A Vs Group C. Tmax time required to achieve maximum
plasma concentration; Cmax maximum plasma concentration; AUC(0–24) area under concentration–time curve
extrapolated to 24 h; AUC(0–∞) area under concentration–time curve extrapolated to infinity; CL/F total body
clearance; t½ half-life.
Conclusion
The findings from the in vitro study proposed that the MYG tablets and its guggulsterone isomers have drug
interaction potential when consumed along with conventional drugs which are CYP3A4 substrates. The pharma-
cokinetic study of midazolam confirmed the inhibitory activity of MYG tablets and its major active constituents
such as E & Z guggulsterone towards CYP450 enzymes in the rat model. Specifically, the clearance of midazolam
Scientific Reports | (2021) 11:715 | https://doi.org/10.1038/s41598-020-80595-5 6
Vol:.(1234567890)www.nature.com/scientificreports/
Group A (n = 6) Group B (n = 6) Group C (n = 6)
Parameters Placebo MYG E & Z guggulsterone
Tmax (h) 0.15 ± 0.9 0.08 ± 0.003* 0.07 ± 0.004ɸ
Cmax (μg/ml) 20.29 ± 44 32.51 ± 0.63* 32.95 ± 9.5ɸ
AUC0-t (μg/ml*h) 99.15 ± 43 113 ± 4.48** 128.6 ± 4.6ɸɸ
AUC0-inf (μg/ml*h) 99.16 ± 87 113 ± 4.52*** 129.5 ± 2.3ɸɸɸ
T1/2 (h) 1.25 ± 0.2 1.45 ± 0.5 1.55
CL/F (ng/ml)/h 0.09 ± 0.1 0.007 ± 0.2 0.007 ± 0.1
Table 3. Pharmacokinetic parameters of alpha hydroxy midazolam in rat plasma. Values are expressed in
mean ± SD; (*) P < 0.05 Group A vs Group B; (ɸ) P < 0.05 Group A Vs Group C. Tmax time required to achieve
maximum plasma concentration; Cmax maximum plasma concentration; AUC(0–24) area under concentration–
time curve extrapolated to 24 h; AUC(0–∞) area under concentration–time curve extrapolated to infinity; CL/F
total body clearance; t½ half-life.
Figure 5. Mean plasma concentrations Vs Time curves of midazolam and alpha hydroxyl midazolam in Group
A, Group B and Group C.
decreased while the C max increased, indicating MYG and guggulsterones affected the midazolam pharmacoki-
netics. Therefore, to avoid clinically significant herb-drug interaction, caution should be taken when MYG or
guggulsterones are co-administered with other allopathic drugs metabolized by CYP3A4.
Data availability
The authors confirm that the data supporting the findings of this study are available within the article and its
supplementary materials.
Scientific Reports | (2021) 11:715 | https://doi.org/10.1038/s41598-020-80595-5 7
Vol.:(0123456789)www.nature.com/scientificreports/
Received: 17 October 2020; Accepted: 22 December 2020
References
1. Ekor, M. The growing use of herbal medicines: Issues relating to adverse reactions and challenges in monitoring safety. Front.
Pharmacol. 4, 1–10 (2014).
2. Na, D. H. et al. Evaluation of metabolism-mediated herb-drug interactions. Arch. Pharm. Res. 34, 1829–1842 (2011).
3. Huang, S.-M. et al. New era in drug interaction evaluation: US Food and Drug Administration update on CYP enzymes, transport-
ers, and the guidance process. J. Clin. Pharmacol. 48, 662–670. https://doi.org/10.1177/0091270007312153 (2008).
4. Guengerich, F. P. Cytochrome P450s and other enzymes in drug metabolism and toxicity. The AAPS journal. 8, E101–E111 (2006).
5. Zanger, U. M. & Schwab, M. Cytochrome P450 enzymes in drug metabolism: regulation of gene expression, enzyme activities,
and impact of genetic variation. Pharmacol. Ther. 138, 103–141 (2013).
6. Sarup, P., Bala, S. & Kamboj, S. Pharmacology and Phytochemistry of Oleo-Gum Resin of Commiphora wightii (Guggulu). Sci-
entifica https://doi.org/10.1155/2015/138039 (2015).
7. Halama, B. et al. A nanogram dose of the CYP3A probe substrate midazolam to evaluate drug interactions. Clin. Pharmacol. Ther.
93, 564–571 (2013).
8. Kunnumakkara, A. B. et al. Googling the Guggul (Commiphora and Boswellia) for prevention of chronic diseases. Front. Phar-
macol. 9, 686 (2018).
9. Pandit, S., Ponnusankar, S., Bandyopadhyay, A., Ota, S. & Mukherjee, P. K. Exploring the possible metabolism mediated interaction
of Glycyrrhiza glabra extract with CYP3A4 and CYP2D6. Phytother. Res. 25, 1429–1434 (2011).
10. Tichy, M. et al. Interference of IgM-lambda paraprotein with biuret-type assay for total serum protein quantification. Clin. Chem.
Lab. Med. 47, 235–236 (2009).
11. Vijayakumar, T. M., Kumar, R. M., Agrawal, A., Dubey, G. P. & Ilango, K. Comparative inhibitory potential of selected dietary
bioactive polyphenols, phytosterols on CYP3A4 and CYP2D6 with fluorometric high-throughput screening. J. Food Sci. Technol.
52, 4537–4543 (2015).
12. Duraipandi, S. & Selvakumar, V. Comparative study of isolated Guggulsterones as marker compounds from Guggulu, Commiphora
mukul with Ayurvedic Gugglu containing formulations by HPTLC, an in-house quality control method. J. Pharm. Chem. 1, 1–4
(2014).
13. Shen, T., Li, G. H., Wang, X. N. & Lou, H. X. The genus Commiphora: A review of its traditional uses, phytochemistry and phar-
macology. J. Ethnopharmacol. 142, 319–330 (2012).
14. Sairkar, P. K., Sharma, A. & Shukla, N. P. Estimation of guggulsterone E and Z in the guggul-based commercial formulations using
high-performance thin-layer chromatography. J. Pharm. Bioallied Sci. 9, 1–7 (2017).
15. Parveen, A., Parveen, B., Parveen, R. & Ahmad, S. Challenges and guidelines for clinical trial of herbal drugs. J. Pharm. Bioallied
Sci. 7, 329–333 (2015).
16. Ab Rahman, N. S. et al. Evaluation of herb-drug interaction of SynacinnTM and individual biomarker through cytochrome 450
inhibition assay. Drug Metab. Lett. 12, 62–67 (2018).
17. Jambhekar, S. S. & Breen, P. J. Basic Pharmacokinetics 200–250 (Pharmaceutical Press, London, 2009).
Acknowledgements
We would like to thank Prof. K.S.Lakshmi, Dean, Dr.V.Chitra, Vice-Principal, Dr.K.Manikandan, Associate
Professor, SRM College of Pharmacy, SRMIST and AVN Ayurveda Formulations Pvt. Ltd, Madurai for provid-
ing MYG tablets.
Author contributions
S.S., designed the research and carried out the experiment. S.K.R.C., analyzed the data. V.T.M., supervised the
research work and wrote the manuscript. All authors read and approved the final manuscript.
Competing interests
The authors declare no competing interests.
Additional information
Correspondence and requests for materials should be addressed to V.T.M.
Reprints and permissions information is available at www.nature.com/reprints.
Publisher’s note Springer Nature remains neutral with regard to jurisdictional claims in published maps and
institutional affiliations.
Open Access This article is licensed under a Creative Commons Attribution 4.0 International
License, which permits use, sharing, adaptation, distribution and reproduction in any medium or
format, as long as you give appropriate credit to the original author(s) and the source, provide a link to the
Creative Commons licence, and indicate if changes were made. The images or other third party material in this
article are included in the article’s Creative Commons licence, unless indicated otherwise in a credit line to the
material. If material is not included in the article’s Creative Commons licence and your intended use is not
permitted by statutory regulation or exceeds the permitted use, you will need to obtain permission directly from
the copyright holder. To view a copy of this licence, visit http://creativecommons.org/licenses/by/4.0/.
© The Author(s) 2021
Scientific Reports | (2021) 11:715 | https://doi.org/10.1038/s41598-020-80595-5 8
Vol:.(1234567890)You can also read