Dabur India Limited Investor Presentation June 2018
←
→
Page content transcription
If your browser does not render page correctly, please read the page content below

Dabur India Limited
Investor Presentation
June 2018

                        1
Contents

   1. Dabur – Overview

   2. Business Structure

   3. India Business

   4. The Journey of our Gems

   5. International Business

   6. The next growth wave

   7. Annexure

                                2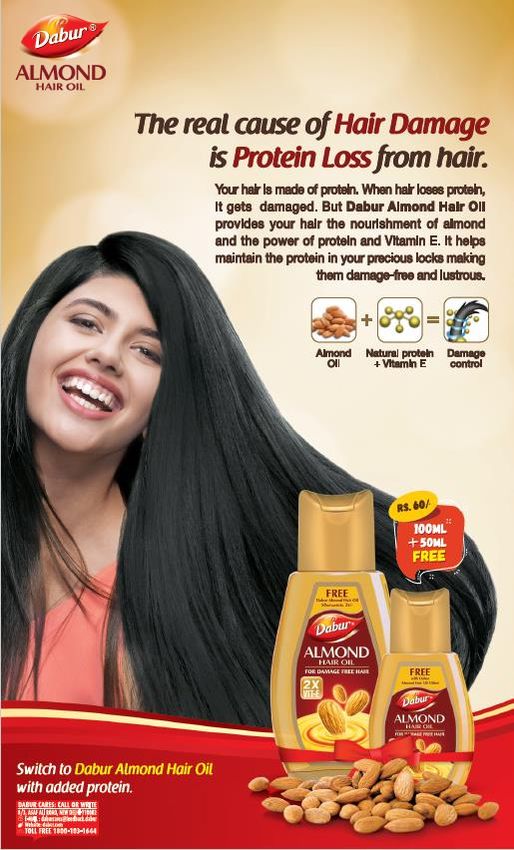
Dabur – Overview

Overview                                                Awards

      Established in 1884 – 134 years of trust and               Dabur Red Paste rated as 2nd most
                       excellence                                trusted brand by the consumers in the
                                                                 Oral Care category by the Brand Equity
                                                                 India’s Most Trust Brand 2017
 One of the world’s largest in Ayurveda and natural
                     healthcare
                                                                 Dabur Vatika #BraveandBeautiful
   Having one of the largest distribution network in             campaign wins 2 Effies
           India, covering 6.3 mn outlets

  20 world class manufacturing facilities catering to            Dabur moves up 4 Places in Fortune
              needs of diverse markets                           India 500 List; ranked 163 in the list for
                                                                 2015
 Strong overseas presence with ~28% contribution
               to consolidated sales
                                                                 Dabur ranked 25 in the list of Best
                                                                 Companies for CSR in India, according
                                                                 to the Economic Times
                                  Market
                                   cap:                          Dabur India successfully held the first-
                                   US$                           ever Guinness World Record attempt
                                   10bn                          for the largest simultaneous Nasya
                                                                 Panchkarma Treatment session

INR:USD F/X Rate: 68.5                                                                                        3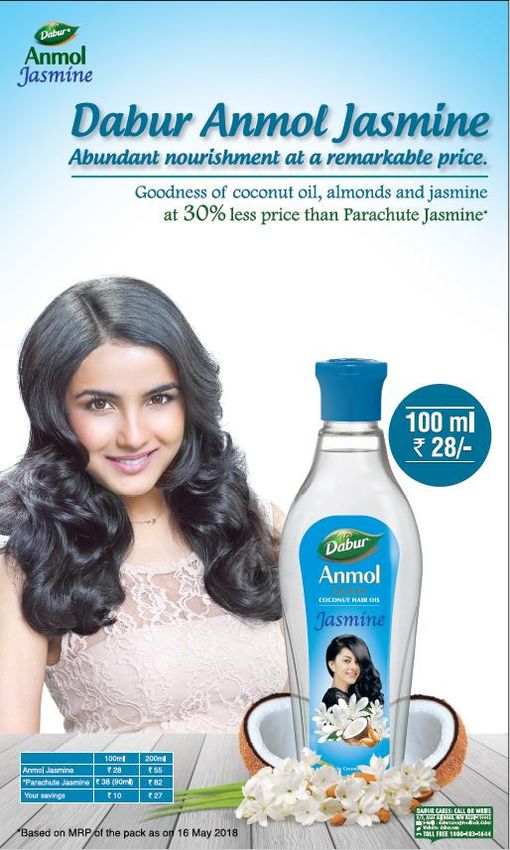
Key milestones

                                                                                                Foods business
Established by Dr. S.K.
                                                 Acquired Balsara                            crossed INR 10.0 bn
  Burman in Kolkata
                                                                                                turnover mark

                     Inducted professional                               Acquired Hobi and
                         management                                          Namaste

 1884         1994        1998         2000       2005         2008       2010       2012        2016        2018

                                  Crossed the INR 10.0                              Crossed the USD 1 bn
                                    bn turnover mark                                   turnover mark

        Came out with first                                                                      Crossed market cap of
                                                            Acquired Fem Pharma
           public issue                                                                                 $10 bn

                                                                                                                    4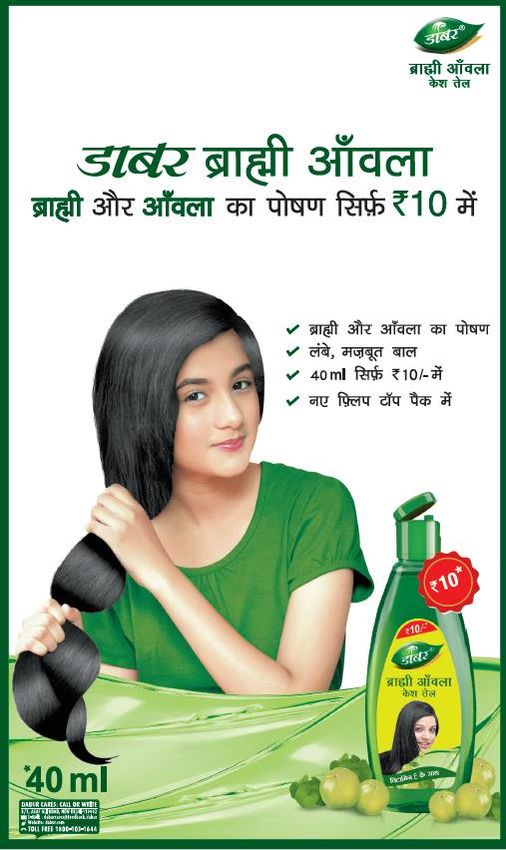
Dabur & Ayurveda

                                 Ayurveda = Dabur’s Core Philosophy

   Synonymous with Ayurveda since 133 years

 Known for making Ayurveda accessible to every
             household in India

                                                                       Anchored by
                                                                        Heritage

Stringent quality test of every ingredient and herb

                                                                 Propelled by
                                                                   Science
   Strong R&D infrastructure including in-house
          Ayurvedic doctors & scientists

                                                                        Governed
                                                                        by Trust
Over 5,000 acres of cultivation of endangered herbs
                     and plants

                                                                                     5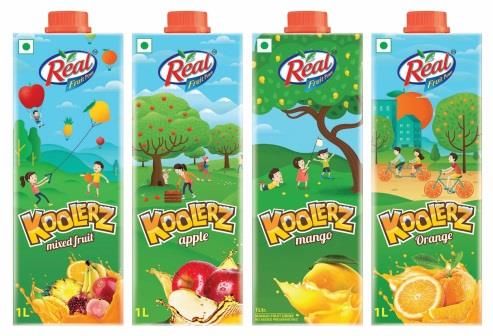
Manufacturing facilities

          12 manufacturing locations in India                 8 international manufacturing locations

                                                                                  UAE

                         Baddi
  Jammu
                                                                                  Egypt
                                    Sahibabad
                     `
             Alwar
                                     Pantnagar       Tezpur
  Newai                                                                           Nigeria

                                 Katni                                            South Africa

                                                                                  Turkey
                                                Narendrapur
  Silvasa

                                                                                  Sri Lanka
  Nasik                                  Pithampur

                                                                                  Bangladesh

                                                                                  Nepal

                                                                                                   6
Distribution Network

                           Urban                                            Rural

                           Factory                                          Factory

                             C&F                                              C&F

 GT Stockist              MT Stockist     Insti Stockist                 Super Stockist

             Wholesaler                                                  Sub Stockist

  Retailer                 Retailer                                         Retailer

  Consumer                Consumer         Consumer                        Consumer

                Distribution reach of 6.3 mn retail outlets with direct reach of 1 mn

                                                                                          7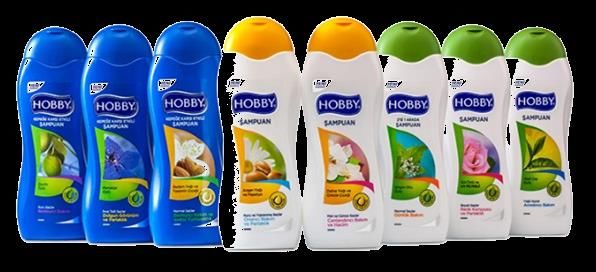
Strong Financial Profile

                                                                          CAGR :                                            • Revenue has become ~3x over
                                                                          11.9%
                                                                                                                              the last 10 years
                                                                                          78.3     78.7      77.0   77.5
                                                                                 70.9
 Revenue                                                    53.1
                                                                      61.7                                                  • Last 3 years’ revenue looks
  from                        28.1      34.0
                                                  41.0
                                                                                                                              optically static due to change
Operations                                                                                                                    in accounting standards,
                                                                                                                              demonetization and
                              FY09      FY10     FY11       FY12      FY13       FY14     FY15     FY16     FY17    FY18
                                                                                                                              implementation of GST

                                                     Operating Profit                 Operating Margins (%)
                                                                                                                    20.9%
                                       18.9%     19.5%                                           19.3% 19.6%
                             16.9%                      16.8% 16.0%              16.6% 16.7%
                                                                                                  15.2      15.1    16.2    • In FY18, the operating margin
 Operating                                                                        11.8    13.1
                                                                      9.9                                                     of 20.9% was the highest ever
   Profit                               6.4       8.0        8.9
                               4.7                                                                                            in the history of the company

                              FY09      FY10     FY11       FY12      FY13       FY14     FY15     FY16     FY17    FY18

                                                        Profit After Tax (PAT)            PAT Margins (%)
                                                                                                                    17.5%
                                                                                                15.9% 16.6%
                             13.8%     14.7%     13.9%                                                                      • PAT has grown at a CAGR of
                                                                                 13.2%   13.5%
                                                            12.1%    12.4%
                                                                                                   12.5      12.8   13.5      15% over the last 10 years
      PAT                                                                         9.3     10.5
                                        5.0       5.7        6.4      7.6                                                   • PAT margin is the highest ever
                               3.9
                                                                                                                              in the history of the company

                              FY09      FY10     FY11       FY12      FY13       FY14     FY15     FY16     FY17    FY18

Note: All figures are in INR bn
FY09 to FY15 is basis IGAAP, FY16 and FY17 are as per IndAS and FY18 is as per IndAS and takes into account GST                                                8
Contents

   1. Dabur – Overview

   2. Business Structure

   3. India Business

   4. The Journey of our Gems

   5. International Business

   6. The next growth wave

   7. Annexure

                                9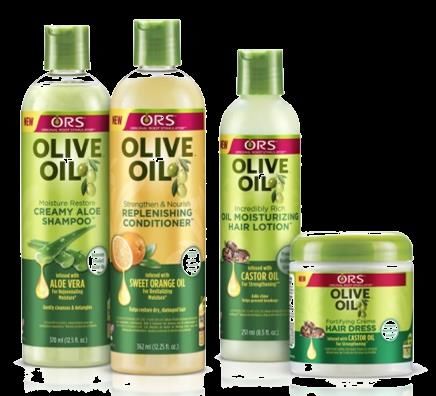
Business structure

                                   Domestic                          International
                                    (72%)                               (28%)

           Domestic
                                                      Others   Organic               Acquired
             FMCG
                                                      (4%)     (67%)                  (33%)
            (68%)

Note: Figures in brackets are based on FY18 revenue                                             10
Contents
1. Dabur – Overview
2. Business Structure
3. India Business
4. The Journey of our Gems
5. International Business
6. The next growth wave
7. Annexure
11Sales by Business Vertical
Domestic FMCG – Business Verticals1 Key categories
Revenue
Category Contribution Key Brands
Domestic FMCG (FY18)
Hair Care 21%
Healthcare
(32%) Foods 18%
HPC Health
17%
(50%) Supplements
Oral Care 17%
Foods
(18%)
OTC & Ethicals 9%
Others2 18%
1. Based on FY18 Revenue
2. Others includes Digestives, Skin Care and Home Care 12Market leader in 6 categories
Leading position in key categories across verticals
#Relative Competitive Position1
#1 #1 #2 #2 #2 #3 #1 #2 #1 #1 #1
Honey Chyawanprash Baby Glucose Hair Oils Oral Care Skin Toilet Cleaners Air Mosquito Juices
Massage Care - Fresheners Repellant
Oil Bleaches Creams
Healthcare Home and Personal Care Foods
1. Position basis Nielsen Market Share data MAT Mar’18 13Building bigger brands
10 bn+ 1 bn+
16 brands with turnover of INR 1bn+ with 3 brands which are INR 10bn+
14Recent Innovations
Vatika Shampoo with Satt Poshan Vatika Enriched Coconut Hair Oil Anmol Jasmine Hair Oil
GlycoDab Tablets Odonil Zipper Real Koolerz
(Ayurvedic Medicine)
15Business strategy
Healthcare Home & Personal Care Foods
• Leadership in Ayurveda – • Ayurvedic / Herbal focus • Maintain leadership in Juices
scientific evidence & • Premiumization & & Nectars category
research Differentiation • Leveraging the Fruit equity
• OTC portfolio to be scaled • Strong innovation agenda associated with the ‘Real’
up through innovation & brand
• Potential to expand in
awareness creation • Focus on ‘Healthy’ range of
adjacencies within current
• Doctor advocacy through categories products
Medico Marketing channel
16Contents
1. Dabur – Overview
2. Business Structure
3. India Business
4. The Journey of our Gems
5. International Business
6. The next growth wave
7. Annexure
17Odonil’s Journey
Led by constant innovation and evolving communication
Revenue Trajectory Market Share % - MAT 2018
CAGR: 20% 9x …and is the ~50%
Odonil has
market leader in
become 9x in
the air
the last 12 3.3x
fresheners ~14%
years… x
category
FY06 FY12 FY18 Odonil Next biggest player
FY06 FY11 FY13 FY15 FY18
Blocks Pluggy Gel 1 Touch Air Sanitizer Zipper
Led by constant
innovation and
new launches in
the space and…
Till FY07
FY07 to FY11 FY11 to FY16 Since FY16
Mal Odor
Transformation(Mood) Transformation(Space) Social Necessity
Removal
Supported by
evolving
communication
themes and
advertisements
18Dabur’s journey to become the 3rd largest toothpaste
company in India
• Over the last 15 years, Dabur has grown from a tooth powder company to
one of the top 3 players in the toothpaste category
• Entered the toothpaste category with the launch of Dabur Red Paste in
2004
• Acquisition of Balsara in 2005 added Babool and Meswak brands to the
herbal oral care portfolio
• Recently launched Dabur Red Gel to capture Ayurvedic segment
among Gel users
• Growing at a rapid pace, Dabur has become the third largest toothpaste
company in the country and has a strong innovation pipeline
Consistent +160 bps
increase in +150 bps
market share of
+350 bps
Dabur in the
toothpaste
category
Mar-06 Mar-08 Mar-11 Mar-18
19Real continues on the journey of dominance in J&N category
Real Fruit Power Real Activ Real Wellnezz
Real Koolerz Real Mocktails Real Activ Coconut Water
• Real Fruit Juices were launched in 1998 to create the packaged fruit juice category in India
• First to launch variants like Litchi, Guava, Pomegranate, Cranberry, Supafruits, Mosambi and the ‘Activ’
range of fruit and veggie blends
• More than 30 variants in the portfolio currently
• Continuing to be the market leader with >50% share
• Recently launched Real Koolerz to enter the drinks category
• Strong innovation pipeline to cater to consumers across the spectrum
20Contents
1. Dabur – Overview
2. Business Structure
3. India Business
4. The Journey of our Gems
5. International Business
6. The next growth wave
7. Annexure
21International Business – Financial Profile
Sales (INR bn)
CAGR: 14%
• International Business comprises the Organic and Acquired business
27.1
24.2 • Organic business (67% of international) is an extension of Indian
23.1 23.2
21.8
portfolio with the same personal care brands operating internationally
18.3
16.2
• Acquired business (32% of international) comprises Hobi and
8.9 Namaste
• FY17 and FY18 were impacted due to geopolitical headwinds and
severe currency devaluation in our key markets
FY11 FY12 FY13 FY14 FY15 FY16 FY17 FY18
Region-wise Sales (FY18) Performance of Key Markets (FY18)
Constant Currency Growth Rate – FY18
Americas
14.0% 31.8%
Middle East
Europe 34.0% 17.3% 16.9%
10.8% 13.7%
10.7% 10.6% 10.0%
Asia
22.4% Africa
(15.8%)
18.8% Egypt GCC Saudi Nigeria Nepal Turkey Namaste SSA
Arabia
22Organic International Business
FY06 FY18
Others
Others
Oral Care 5%
Skin Care 10%
2%
7% Hair Oil
34%
Oral Care
12%
Hamamzaith
& Styling Hair Cream
9% 11%
Hair Oil Shampoo
93% 17%
Organic International Business has evolved from being just a Hair Oil business
to a diversified personal care entity
23Acquired International Business
Namaste Hobi
• Key Geographies • Key Geographies
– USA – Turkey
– Africa • Key Categories
• Key Categories – Hair Styling
– Straighteners – Shampoo & Conditioners
– Styling – Liquid Soap
– Shampoo & Conditioners – Skin & Body Care
24International Business – Strategy
Brands positioned on “Herbal and Natural” platform
Product portfolio customized to local preferences
Strong investments in brands and business
Leveraging Digital platform to enhance consumer awareness
and brand visibility
Local supply chain & management offers strategic advantage
25Contents
1. Dabur – Overview
2. Business Structure
3. India Business
4. The Journey of our Gems
5. International Business
6. The next growth wave
7. Annexure
26The next growth wave
Build bigger brands
More than 15 brands in the range of INR >0.1 to 1 bn which can grow to INR 1bn+
Continued Innovation
NPD pipeline primed to deliver new products in key categories – 4-5 new products every year
Driving distribution expansion
Direct reach of 1 mn +, increasing the no. of SKUs, rural potential, IT enablement, data analytics
Consumer Health
Strong core competence, low competitive intensity, strong profitability, low penetration
Geographical expansion
Expand into overseas focus markets where our brands are relevant – MENA, Africa, SAARC
27Contents
1. Dabur – Overview
2. Business Structure
3. India Business
4. The Journey of our Gems
5. International Business
6. The next growth wave
7. Annexure
28Shareholding, Market Cap and Dividends
Shareholding pattern Market Cap (INR bn)
Retail 678
DIIs 5.7% 576
8.6% 488
439
FIIs
17.6%
Promoters
68.1%
Mar-16 Mar-17 Mar-18 May-18
Dividend history
750%
1. Normal dividend of
250%,
2. Special Dividend of
500% to
commemorate the
200% 200% 225% 225% 25 years of listing
175% 150% 175%
115% 130%
FY09 FY10 FY11 FY12 FY13 FY14 FY15 FY16 FY17 FY18
29Select Advertisements – May 2018
30Select Advertisements – May 2018
31Consolidated Profit & Loss
Q4 FY18 Q4 FY17 Y-o-Y (%) FY18 FY17 Y-o-Y (%)
Revenue from operations 2,032.9 1,914.7 6.2% 7,748.3 7,701.4 0.6%
Other Income 73.2 65.0 12.6% 305.2 298.3 2.3%
Total Income 2,106.1 1,979.7 6.4% 8,053.5 7,999.8 0.7%
Material Cost 1,002.4 976.1 2.7% 3,846.4 3,843.2 0.1%
% of Revenue 49.3% 51.0% 49.6% 49.9%
Employee expense 180.7 173.1 4.4% 792.8 789.6 0.4%
% of Revenue 8.9% 9.0% 10.2% 10.3%
Advertisement and publicity 125.6 123.0 2.1% 606.7 646.1 (6.1%)
% of Revenue 6.2% 6.4% 7.8% 8.4%
Other Expenses 239.0 224.9 6.3% 885.0 913.5 (3.1%)
% of Revenue 11.8% 11.7% 11.4% 11.9%
Operating Profit 485.2 417.6 16.2% 1,617.4 1,508.9 7.2%
% of Revenue 23.9% 21.8% 20.9% 19.6%
EBITDA 558.4 482.6 15.7% 1,922.6 1,807.3 6.4%
% of Revenue 27.5% 25.2% 24.8% 23.5%
Finance Costs 13.2 11.7 13.5% 53.0 54.0 (1.8%)
Depreciation & Amortization 42.6 39.5 7.7% 162.2 142.9 13.5%
Profit before exceptional items, tax
and share of profit/(loss) from joint 502.6 431.4 16.5% 1,707.4 1,610.4 6.0%
venture
% of Revenue 24.7% 22.5% 22.0% 20.9%
Share of profit / (loss) of joint venture (0.2) (0.1) n.m. 0.2 0.3 (5.6%)
Exceptional item(s) 0.0 0.0 n.a. 14.5 0.0 n.a.
Tax Expenses 105.2 97.7 7.7% 335.4 330.3 1.5%
Net profit after tax and after share of
397.2 333.7 19.0% 1,357.7 1,280.3 6.0%
profit/(loss) from joint venture
% of Revenue 19.5% 17.4% 17.5% 16.6%
Non controlling interest 1.0 0.5 81.2% 3.3 3.4 (0.7%)
Net profit for the period/year 396.2 333.1 18.9% 1,354.4 1,276.9 6.1%
% of Revenue 19.5% 17.4% 17.5% 16.6%
Note: All figures are in INR crores, unless otherwise stated 32Consolidated Balance Sheet (1 of 2)
All figures are in INR crores, unless otherwise stated
As at 31/03/2018 As at 31/03/2017
Particulars
(Audited) (Audited)
A Assets
1 Non-current assets
(a) Property, plant and equipment 1,552 1,479
(b) Capital work-in-progress 42 42
(c) Investment property 54 55
(d) Goodwill 412 411
(e) Other Intangible assets 10 14
(f) Financial assets
(i) Investments 3,092 2,499
(ii) Loans 13 12
(ii) Others 4 4
(g) Other non-current assets 3 3
(h) Non-current tax assets (net) 80 95
Total Non-current assets 5,262 4,615
2 Current assets
(a) Inventories 1,256 1,107
(b) Financial assets
(i) Investments 713 741
(ii) Trade receivables 706 650
(iii) Cash and cash equivalents 154 163
(iv) Bank Balances other than (iii) above 152 142
(v) Loans 35 11
(vi) Others 28 14
(c) Current Tax Asset(Net) 2 0
(d) Other current assets 391 290
(e) Assets held for sale 2 0
Total current assets 3,440 3,117
Total Assets 8,702 7,732
33Consolidated Balance Sheet (2 of 2)
All figures are in INR crores, unless otherwise stated
As at 31/03/2018 As at 31/03/2017
Particulars
(Audited) (Audited)
B Equity and Liabilities
1 Equity
(a) Equity share capital 176 176
(b) Other Equity 5,530 4,671
Equity attributable to shareholders of the Company 5,707 4,847
Non Controlling Interest 27 25
Total equity 5,733 4,872
2 Non-current liabilities
(a) Financial liabilities
(i) Borrowings 364 471
(ii) Other financial liabilities 4 4
(b) Provisions 56 53
(c) Deferred tax liabilities (Net) 109 108
Total Non-current liabilities 534 636
3 Current liabilities
(a) Financial liabilities
(i) Borrowings 464 440
(ii) Trade payables 1,410 1,309
(iii) Other financial liabilities 238 174
(b) Other current liabilities 173 169
(c) Provisions 107 93
(d) Current tax Liabilities (Net) 41 38
Total Current liabilities 2,434 2,224
Total Equity and Liabilities 8,702 7,732
34For more information & updates, visit http://www.dabur.com/in/en-us/investor
You can also read