Debugging QUIC and HTTP/3 with qlog and qvis
←
→
Page content transcription
If your browser does not render page correctly, please read the page content below
Debugging QUIC and HTTP/3 with qlog and qvis

                                       Dominik von Künßberg, Benedikt Jaeger∗
                        ∗ Chair of Network Architectures and Services, Department of Informatics
                                        Technical University of Munich, Germany
                               Email: dominikvon.kuenssberg@tum.de, jaeger@net.in.tum.de

Abstract—The powerful properties of the QUIC and HTTP/3                which allows it to be used across implementations, in-
protocols make debugging and inspecting them a challenging             dependent of language-specific characteristics. Each qlog
task. The qlog format and the qvis toolsuite have been                 event is characterized by a timestamp, a category, the
introduced to facilitate this problem. We give an overview of          event type and type-specific data [3]. This format makes
both the format and the visualization tool, introducing and            it easily extensible: to log a specific type of event which
assessing their respective capabilities.                               is not yet present, it can simply be added. Qlog files from
                                                                       different connection endpoints can also be aggregated into
Index Terms—software-defined networks, measurement,                    one single qlog file [3].
high-speed networks                                                        Logging events to analyze the performance and be-
                                                                       haviour of the QUIC protocol is certainly helpful, however
                                                                       it might be hard to extract the needed information from
1. Introduction                                                        textual logs only. Because of this, Marx et al. also created
                                                                       the tool qvis to visualize qlogs [3]. This is especially
     The QUIC protocol is a transport protocol designed to             helpful combined with qlog’s ability to combine logs from
offer lower latency for HTTP traffic while also meeting se-            different endpoints; qvis is then able to visualize relations
curity requirements by encrypting its packets, as described            between the endpoints accurately such as packet loss,
by Langley et al. [1]. Built on UDP, it forms the basis                packet order etc [3].
for HTTP/3. Lower latency is attributed to several things:                 This paper aims to outline the most important aspects
firstly, it streamlines the amount of handshakes needed to             of the qlog format and the qvis visualization tool. We
establish a secure connection by exchanging cryptographic              present the qlog format in Section 2 and address how data
keys and certificates directly in the initial handshake [1]. It        is collected and its scalability in Section 3. In Section
also identifies connections by a connection ID instead of              4, we introduce the qvis toolsuite and its scalability.
the IP / port 5-tuple, allowing for immediate reconnection             Section 5 assesses how the qlog format compares to the
to a server after changing IP addresses [1]. To avoid head-            pcap format commonly used in the TCP+TLS+HTTP/2
of-line-problems like present in the TCP+TLS+HTTP/2                    stack. In Section 6, we conclude that both qlog and qvis
stack, QUIC allows multiple bidirectional streams within a             are powerful tools for debugging the QUIC protocol and
QUIC connection which are independent of each other [1].               summarize future plans for qvis.
Lastly, QUIC packets are entirely encrypted except for
fields necessary for routing, forwarding and decrypting                2. Qlog
the packet [1].
     While this is an effective way to protect the packet’s                The qlog format has so far been defined in two IETF
data, it makes the protocol difficult to analyze and debug.            drafts, one describing the general high-level format of
As there are various implementations of QUIC and its                   qlog [4] and the other defining events specific to QUIC
standardization is still ongoing [2], analysis and debugging           and HTTP/3 [5]. As qlog is a flexible and general format,
are indispensable tools to verify the protocol’s behavior              it can also be used for protocols other than QUIC such as
and find bugs.                                                         DNS or the TCP+TLS stack by defining the events in the
     Capturing the available metadata from packets in tran-            implementation accordingly [3].
sit alone is not sufficient because fields containing states               Fields inside a qlog file follow a JSON-like format.
necessary for analysis are encrypted [3]. Temporarily de-              The basic format is an object:type pair. Available stan-
and encrypting the packets while in transit to extract the             dard types are signed and unsigned integers with lengths
necessary log information is out of the question as this ex-           varying from 8 to 64 bits, floats and doubles, strings, bytes
poses the full payload and requires the respective session             (raw 8 bit long values), booleans, enums and any, which
keys [3]. The only places where the later encrypted states             can represent any data type. Additional notations are listed
are available are the endpoints which send and receive the             in the Internet Draft for qlog [4].
packets [3]. Logging mechanisms have been implemented,                     Every qlog file consists of one top-level file which
however each is specific to their own implementation of                must contain a qlog_version field and an array con-
the protocol which makes them difficult to parse [3] for               taining traces [4, Section 3]. Further optional fields can
further use.                                                           be given such as title, summary, description and
     To alleviate this problem, Marx et al. propose a log-             qlog_format [4, Section 3]. The summary can be useful
ging format called qlog [3]. Qlog is based on JSON [3]                 to get a quick overview of aggregated information about

   Seminar IITM WS 20/21,                                         25                             doi: 10.2313/NET-2021-05-1_06
   Network Architectures and Services, May 2021
all traces that have been logged, being able to list cus- 5.1.1, 5.3]. "Datagrams" in this case refers to UDP-
tomizable features such as total lost packets, total number datagrams [5, Section 5.3.10].
of events and whatever information may be needed in a
specific use-case [4, Section 3.1]. 3. Qlog data collection
2.1. Traces How and at which points qlog logs its data is entirely
up to the implementation. Any necessary data structures
A trace is a structure which contains the recorded need to be created as well as functions for forwarding
events and additional metadata, however, it usually rep- and writing information to a qlog file. Coupled with the
resents the data flow at a single endpoint [4, Section 3.3]. flexible format of qlogs, it allows for precise logs exactly
It must contain a vantage_point field to identify which where it is needed. As an example, the logging of a qlog
type of endpoint it logged, and an array of events repre- event in the Go implementation is structured as follows.
senting all logged events at this endpoint [4, Section 3.3]. The file event.go contains and defines all possible events
Other optional fields allowing for more context are title, that can be logged [6]. Each event contains the needed
description, and, most importantly, the common_fields and optional attributes which can be set [6]. A struct
list [4, Section 3.3], which will be discussed in Section called connectionTracer acts as the trace explained in
2.2. Section 2.1 [6]. It makes use of Go Channels to record
events concurrent to program execution [6]. To avoid race
2.2. Events conditions, a mutex is used on the events channel so that
only one event can be recorded at a time [6]. For instance,
Each event must at least contain the fields timestamp, when the server sends a version negotiation packet to the
name, and data [4, Section 3.4]. Usually it is useful client, the sentPacket function of the connectionTracer
to organize events by assigning them a group_id, a is invoked, which in turn records the event and adds it
protocol_type and perhaps a category [4, Section 3.4]. to the events channel [6]. This behavior is essentially
Consequentially, fields such as these typically tend to stay the same across all functions; when a function is called
the same for the majority of events from the same trace, which necessitates logging, the respective function in the
and thus would need to be constantly logged anew [4, connectionTracer is called and adds the event to the
Section 3.4.8]. To avoid unnecessary duplicate data, a log [6]. Upon stopping the server, the aggregated events
trace can contain the common_fields list, containing in- are written to the qlog [6].
formation which is shared by all events of that trace [4, As this means that qlogs are held in memory and only
Section 3.4.8]. The mentioned fields can then be omitted written to the disk when the connection is terminated, this
in the event itself. approach might cause unwanted occupation of memory
Events can also contain so-called "triggers" in the when logging a large volume of events. As an example,
data field [4, Section 3.4.6]. Triggers are a set of possible the large demonstration file on the qvis website [7] rep-
string values which indicate why an event has occurred [4, resenting a 100 MB download is 31 MB in size, while
Section 3.4.6]. If the event occurs, the applicable trigger the qlog file for a 500 MB download mentioned in [3]
string is then included in the log. This gives a direct is 276 MB. Assuming this can be scaled roughly linearly,
context to the occurrence of the event and eliminates the logging a 10 GB download will then result in a qlog which
need of analyzing logs within roughly the same timeframe is somewhere between 3,1 and 5,5 GB in memory before
to find the reason [4, Section 3.4.6]. the connection is terminated. It is therefore important to
The QUIC specific events described in [5] have been keep this memory occupation in mind and evaluate which
divided into three categories: Core, Base, and Extra [5, events actually need to be logged to minimize the resulting
Section 2.1]. log size, especially when downloading and logging large
Core events should be present in all qlog files and are quantities of data.
used to log very basic information [5, Section 2.1]. Exam-
ples of Core events are packet_sent, packet_received, 3.1. Scalability
version_information and packet_lost [5, Sections
5.3, 5.4.5]. The version_information event logs the In [3], Facebook employed qlog at internet scale and
QUIC versions available for both client and server, as well concluded that it "is two to three times as large" and
as the version which has been selected [5, Section 5.3.1]. "takes 50 % longer to serialize than their previous in-
Base events can depend on Core events but are house binary format." In Facebook’s case, this processing
logged separately for the sake of clarity [5, Sec- surplus was acceptable given the flexibility provided by
tion 2.1]. They provide more detailed information qlog [3].
which is relevant for debugging. Such events are To compress qlog’s size requirements while preserving
for example connection_started, packet_dropped, the format’s desirable properties, an optimized mode [3]
packet_buffered, and congestion_state_updated [5, was introduced. It relies on two aspects: reducing the
Sections 5.1.2, 5.3, 5.4.3]. initial size of qlogs and encoding the smaller qlogs more
Extra events are usually employed to observe the efficiently [3]. The former is accomplished by collecting
internal behavior of the protocol’s implementation, rather repeated values in a dynamic dictionary [3]. The latter is
than the protocol itself [5, Section 2.1]. Examples for Ex- achieved by using the CBOR (Concise Binary Object Rep-
tra events include server_listening, packets_acked, resentation) format to encode the qlogs and the generated
datagrams_sent and datagrams_received [5, Sections dictionary [3]. CBOR is a binary format which preserves
Seminar IITM WS 20/21, 26 doi: 10.2313/NET-2021-05-1_06
Network Architectures and Services, May 2021JSON’s key-value pairs in a concise manner and allows multiplexing strategy [7]. It is also possible to zoom into
for faster processing than JSON [3]. the string of blocks and hover over them to display the
The combination of these two methods results in exact timestamp, utilized stream, number and packet size
significantly smaller file sizes. The qlog for a 500 MB of the block that is being pointed at [7]. This is especially
download is usually 276 MB; utilizing the optimized mode helpful when inspecting large qlogs.
results in a file about a third as large as the original one, Additionally, it is possible to enable two more supple-
ending up at 91 MB [3]. mentary diagrams: the waterfall and byterange diagram
(waterfall diagram shown in Figure 1c) [7]. The waterfall
4. Qvis diagram displays a colored bar for each stream between
the first and last time it received a frame [7]. This makes
Qvis encompasses a set of tools which visualizes qlog it easier to determine roughly when a stream was active,
files and their data in an understandable and descriptive especially when a large number of frames was transmit-
manner. It can handle qlog files which contain traces from ted [7]. The byterange diagram displays the range of bytes
several endpoints to deduce and display information from transmitted by the frames which are shown at the current
the provided data, such as round trip time, congestion con- zoom level [7].
trol and more [7]. Qvis offers four visualization methods:
sequence, congestion, multiplexing and packetization [7]. 4.4. Packetization Tool
It also lists general statistics about the provided qlogs such
as the number and types of events and frames [7]. Qvis is The packetization tool visualizes how QUIC pack-
implemented mainly in TypeScript and Vue and intended ets are composed of QUIC frames and HTTP/3 frames
to be used in a browser [7]. Scalability issues arising from (shown in Figure 1e) [7]. Each layer represents one struc-
this are discussed in Section 4.5. ture: in ascending order, those are QUIC packets, QUIC
frames, HTTP/3 frames and the stream IDs present in
the corresponding packet [7]. Headers within packets and
4.1. Sequence Tool
frames are represented by taking up half the height of the
line compared to the payload. Packet / Frame boundaries
The sequence tool generates a sequence diagram as
can be discerned by the alternating colors within each
shown in Figure 1a. The green squares on both sides
layer [7]. As with the other tools, it is possible to zoom
represent events. If the event is neither packet_received
in on a specific spot and hover over it to view packet or
nor packet_sent, the event name is added next to it [7].
frame information [7].
Besides displaying the information contained in transmit-
ted packets and their respective timestamps, all the green
boxes, event names and packet information can be clicked 4.5. Scalability
which brings up the corresponding qlog file in plaintext,
While it is possible to load large files in qvis and
allowing for further, more detailed packet inspection [7].
the authors of qvis describe in [3] that qvis "scales to
loading hundreds of MB in JSON", it significantly impacts
4.2. Congestion Tool the performance of the tool. It is recommended to use a
Chromium-based browser, as using another might affect
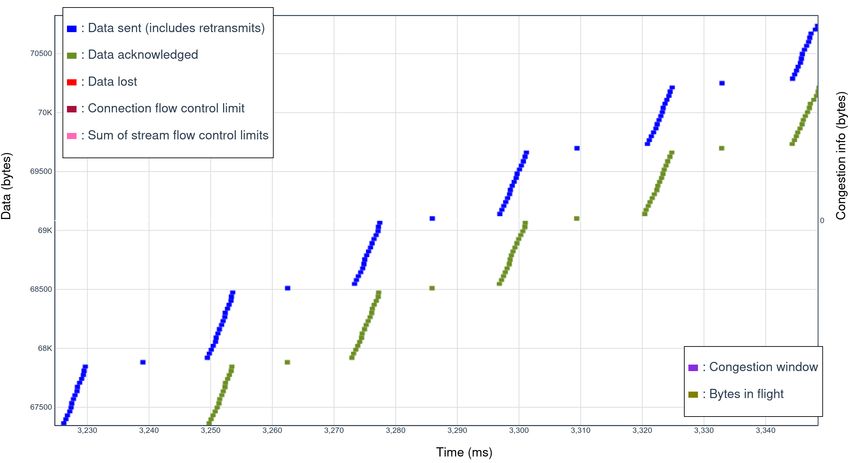
The congestion tool shows two diagrams: one which performance even more [8].
shows the amount of data sent over time in bytes, and one Loading the demonstration file of 31 MB representing
displaying the round trip time [7]. What first appears as a 100 MB download [7] is certainly possible but switching
a slightly jagged line in the first diagram becomes clearer between the different tools, using the zoom function to
when zooming in; it shows the bursts of data being sent in view packet details and other actions noticeably slow
blue and the acknowledgement of that data in green [7], down the web browser. Tools especially affected are the
as shown in Figure 1b. The gap between the blue and sequence, multiplexing and packetization tools.
green blocks on the same height on the y-axis constitutes We observed that the sequence tool initially takes
the round trip time [7]. The congestion tool, therefore, between 10 and 15 seconds to load the entries. However,
makes it easier to identify when data is being sent at a once everything is loaded, the tools work perfectly fine.
different rate indicated by a change of the slope of the The packetization tool also takes about the same time
graph [7]. It can also display crucial information such as to initially load as the sequence tool. The congestion tool
the congestion window size and lost data [7]. is the quickest to respond of all tools, the zoom works
without delay. This is due to the fact that it uses canvas-
4.3. Multiplexing Tool based rendering [8].
Both the multiplexing and packetization tools share a
The multiplexing tool shows how the data sent was performance issue with large files concerning the zoom
divided among the existing QUIC streams (shown in function. Zooming in becomes more important as qlogs
Figure 1d) [7]. It assigns a color to each stream and get bigger to analyze sections of the graph more closely.
displays the sent data as colored blocks strung along the To dissect this issue, it is helpful to analyze how the
timeline, each colored block indicating that the corre- depiction of the diagrams is implemented. Both tools use
sponding stream has been used to transmit data [7]. It rendering of scalable vector graphics (SVG) to display
also indicates which frames had to be resent underneath the diagrams [8]. Each packet / frame is a separate SVG
the corresponding parts of the diagram [7]. This makes entity [8]. When zooming in or out, the dimensions of
it simple to identify unwanted behavior in the applied every entity has to be recalculated, which is slow with
Seminar IITM WS 20/21, 27 doi: 10.2313/NET-2021-05-1_06
Network Architectures and Services, May 2021(a) Sequence diagram.
(b) Congestion diagram.
Request received Colored while stream is "active" (between first and last STREAM frame received)
(c) Waterfall diagram.
10,000 20,000 30,000 40,000 50,000 60,000 70,000 80,000 90,000
Count of STREAM frames received (regardless of size, includes retransmits)
(d) Multiplexing diagram.
Stream IDs
HTTP/3
QUIC frames
QUIC packets
0 200 400 600 800 1,000 1,200 1,400 1,600 1,800
Bytes received max receiving size client: 65527 max receiving size server: 65527
(e) Packetization diagram.
Figure 1: Qvis diagrams.
such big qlogs as this results in tens of millions of SVG options. With default settings, the pcap file for a 500 MB
entities being resized [8]. Therefore, this large workload download will exceed 500 MB, as all packets are directly
is especially noticeable when using the packetization tool, ingested into the log file. However, there are options
as it contains far more SVG entities than the multiplexing to limit the capture size of each incoming packet [11],
diagram [7]. dropping most of the payload. This can dramatically
The SVG rendering approach was chosen because decrease the file size. Measurements showed that when
hover effects to display packet / frame information is easier downloading a 500 MB file using Wireshark with default
to implement this way compared to the canvas-based settings results in a pcap file of 550 MB. Restricting the
rendering used by the congestion tool [8]. However, there size of each logged packet to 100 B to account for headers,
are plans to port the remaining tools to the same rendering the pcap file size drops to 65 MB.
method for performance reasons [8]. The qlog file for a 500 MB download is 276 MB or
91 MB [3] when using the optimized mode explained in
5. Comparison with TCP+TLS+HTTP/2 Section 3.1. This is evidently a noticeable difference in
size.
The TCP+TLS+HTTP/2 (TTH) stack is most com- Despite this, qlog has the advantage of offering a more
monly debugged with tools such as Wireshark [9] or tcp- detailed analysis of internal variables such as congestion
trace [10]. For this purpose, the log consists of timestamps window, lost packets and bytes in flight [3] in comparison
and the captured packets exactly as they were represented to TCP traces and being able to visualize them accordingly
during transmission [3]. As the TTH stack shows most with qvis via the congestion tool [3].
information necessary for debugging in the (unencrypted)
headers of the packets, this is sufficient. For QUIC, this 6. Conclusion
would not work as important metadata for debugging
purposes such as frame numbers, frame type and stream Qlog is a powerful logging tool which has tremen-
IDs are in the encrypted section of the packet [3]. This dous potential for debugging internet protocols, QUIC
makes a direct analysis of packets similar to that of the in particular. Its ability to define custom events and to
TTH stack regarding these properties infeasible. combine multiple traces into one qlog, paired with the
In terms of log size, pcap files created with e.g. terrific visualization capabilities of qvis, makes it a solid
Wireshark can be of varying size depending on the applied basis for anyone debugging QUIC.
Seminar IITM WS 20/21, 28 doi: 10.2313/NET-2021-05-1_06
Network Architectures and Services, May 2021Porting qvis to native code for better performance is [3] R. Marx, M. Piraux, P. Quax, and W. Lamotte, “Debugging QUIC
currently not planned by the original developers of the and HTTP/3 with qlog and qvis,” in Proceedings of the Applied
Networking Research Workshop, ser. ANRW ’20. New York,
tool [8]. While one of the goals is to write qlog importers NY, USA: Association for Computing Machinery, 2020, p. 58–66.
for existing native tools such as Windows Performance [Online]. Available: https://doi.org/10.1145/3404868.3406663
Analyzer, this is not planned for the immediate future [8]. [4] R. Marx, “Main logging schema for qlog,” Inter-
However, the performance issues due to SVG rendering net Engineering Task Force, Internet-Draft, 2020, work
are being worked on as it is planned to convert the in Progress. [Online]. Available: https://quiclog.github.io/
respective tools to canvas-based rendering [8]. internet-drafts/draft-marx-qlog-main-schema.html
[5] ——, “Quic and http/3 event definitions for qlog,”
Internet Engineering Task Force, Internet-Draft, 2020, work
References in Progress. [Online]. Available: https://quiclog.github.io/
internet-drafts/draft-marx-qlog-event-definitions-quic-h3.html
[1] A. Langley, A. Riddoch, A. Wilk, A. Vicente, C. B. Krasic, C. Shi, [6] L. Clemente, “A QUIC implementation in pure go,” 2020.
D. Zhang, F. Yang, F. Kouranov, I. Swett, J. Iyengar, J. Bailey, J. C. [Online]. Available: https://github.com/lucas-clemente/quic-go
Dorfman, J. Roskind, J. Kulik, P. G. Westin, R. Tenneti, R. Shade,
R. Hamilton, V. Vasiliev, and W.-T. Chang, “The QUIC transport [7] R. Marx, “qvis: tools and visualizations for QUIC and HTTP/3,”
protocol: Design and internet-scale deployment,” 2017. 2020, https://qvis.edm.uhasselt.be/.
[2] D. Madariaga, L. Torrealba, J. Madariaga, J. Bermúdez, and [8] ——, “Qvis performance,” 2020. [Online]. Available: https:
J. Bustos-Jiménez, “Analyzing the adoption of QUIC from //github.com/quiclog/qvis/issues/38
a mobile development perspective,” in Proceedings of the [9] “Wireshark,” 2020. [Online]. Available: https://www.wireshark.org/
Workshop on the Evolution, Performance, and Interoperability
of QUIC, ser. EPIQ ’20. New York, NY, USA: Association [10] “Tcptrace,” 2020. [Online]. Available: https://linux.die.net/man/1/
for Computing Machinery, 2020, p. 35–41. [Online]. Available: tcptrace
https://doi-org/10.1145/3405796.3405830 [11] “Wireshark documentation,” 2020. [Online]. Available: https:
//www.wireshark.org/docs/wsug_html/
Seminar IITM WS 20/21, 29 doi: 10.2313/NET-2021-05-1_06
Network Architectures and Services, May 2021You can also read