Democratic Attitudes and Regime Support - Findings from the AmericasBarometer
←
→
Page content transcription
If your browser does not render page correctly, please read the page content below
Democratic Attitudes
    and Regime Support
       Findings from the AmericasBarometer

1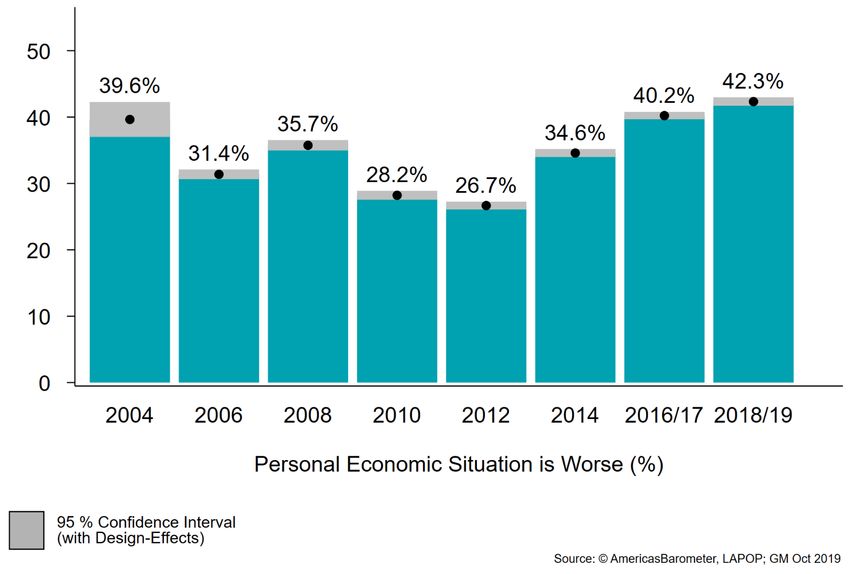
What is the AmericasBarometer?
2004-2019: 310K + interviews in 34
countries
Nationally representative, stratified by
region and rural/urban residence
Face-to-face interviews in 8 languages
using mobile devices
Topics: the economy, rule of law, state
capacity, trust in institutions, individual
values, corruption, security, and more
Data and reports available for free
download on lab website:
www.vanderbilt.edu/lapop
2
What is the AmericasBarometer?
2020 Off-cycle Studies:
4 countries (ECU, HAI, MEX, PER)
Computer-Assisted Telephone
Interviewing
Virtual fieldwork team training and
questionnaire pretesting
3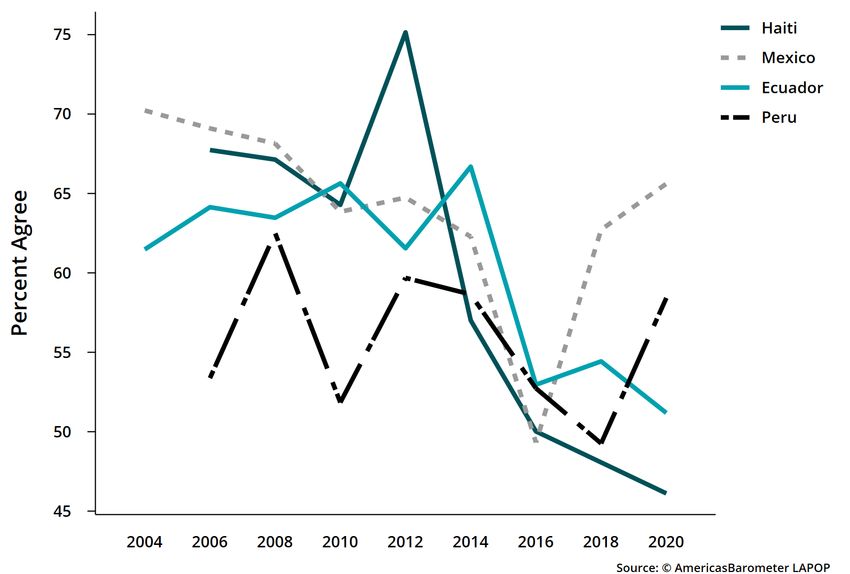
Presentation Outline
    1. Democratic Backsliding

    2. Factors Contributing to the Democratic Deficit

    3. Pandemic and Democratic Attitudes

4
Democratic Backsliding 5
Support for democracy at an all-time low in the
LAC region
80
69.2% 68.4%
S upport for Democracy (%)
67.6% 67.3% 66.4%
58.2% 57.7%
60
40
20
0
2006 2008 2010 2012 2014 2016/17 2018/19
S urvey Wave
95 % Confidence Interval
(with Design-E ffects)
S ource: AmericasBarometer, LAPOP, 2018/19; (GM August 2019)
ING4. Democracy may have problems, but it is better than any other form of government. To what extent do you agree or disagree with this
statement? 5, 6, 7 coded as “support”.
6Satisfaction with democracy has decreased
since 2010
58.7% 57.8%
60
S atisfied/Very Satisfied with Democracy (%)
52.3% 52.4% 53.4%
49.6%
50
40.8% 39.6%
40
30
20
10
0
2004 2006 2008 2010 2012 2014 2016/17 2018/19
S urvey Wave
95 % Confidence Interval
(with Design-E ffects)
S ource: AmericasBarometer, LAPOP, 2018/19; (GM August 2019)
PN4. In general, would you say that you are very satisfied, satisfied, dissatisfied or very dissatisfied with the way democracy works in (country)?
Graph shows % very satisfied or satisfied (vs. not).
7Trust in elections continues to slip
50 45.5%
41.4% 39.9%
38.0%
Trust in Elections (%)
40
30
20
10
0
2012 2014 2016/17 2018/19
S urvey Wave
95 % Confidence Interval
(with Design-E ffects)
S ource: AmericasBarometer, LAPOP, 2018/19; (GM August 2019)
B47A. To what extent do you trust elections in this country? 5, 6, 7 coded as “trust”.
8Tolerance for dissolving Congress (in times of
crisis) is rising
S upport C ongressional Shutdown (%) 25
23.9%
20.4%
20
16.3%
14.8% 14.1%
15
10
5
0
2010 2012 2014 2016/17 2018/19
S urvey Wave
95 % Confidence Interval
(with Design-E ffects)
S ource: AmericasBarometer, LAPOP, 2018/19; (GM August 2019); jc15a
JC15A. Do you believe that when the country is facing very difficult times it is justifiable for the president of the country to close the Congress
and govern without Congress?
9Factors Contributing to the
Democratic Deficit
101 in 4 are crime victims
23.8% 24.0%
25
20.5%
18.9% 18.5%
Victim of C rime (%)
20
15
10
5
0
2010 2012 2014 2016/17 2018/19
S urvey Wave, LAC-18
95 % Confidence Interval
(with Design-E ffects)
S ource: AmericasBarometer, LAPOP
VIC1EXT. Now, changing the subject, have you been a victim of any type of crime in the past 12 months? That is, have you been a victim of
robbery, burglary, assault, fraud, blackmail, extortion, violent threats or any other type of crime in the past 12 months?
11Insecurity continues to rise
19.2%
20
Feels Very Insecure (%) 17.0%
14.3% 13.9%
15
12.2%
11.0% 11.0%
10 8.2%
5
0
2004 2006 2008 2010 2012 2014 2016/17 2018/19
S urvey Wave
95 % Confidence Interval
(with Design-E ffects)
S ource: AmericasBarometer, LAPOP, 2018/19; (GM August 2019)
AOJ11. Speaking of the neighborhood where you live and thinking of the possibility of being assaulted or robbed, do you feel very safe,
somewhat safe, somewhat unsafe or very unsafe? Insecurity is coded as those individuals who said they feel very unsafe.
12Bribe solicitation dropped slightly, but overall
is sticky
20.3% 19.8% 19.8%
18.7% 18.0% 18.3% 18.7%
20
C orruption Victimization
15
10
5
0
2006 2008 2010 2012 2014 2016/17 2018/19
S urvey Wave
95 % Confidence Interval
(with Design-E ffects)
S ource: AmericasBarometer, LAPOP; (GM August 2019)
13Perceptions of corruption are elevated, and
increased
More than half/All Politicians Corrupt (%)
80
67.4%
63.8%
60
40
20
0
2016/17 2018/19
S urvey Wave, LAC-18
95 % Confidence Interval
(with Design-E ffects)
S ource: AmericasBarometer, LAPOP
EXC7NEW. Thinking of politicians in [country], how many do you believe are involved in corruption? Graph shows % “more than half” or “all” are
corrupt.
14Perceptions of a poor personal economic
situation have been increasing since 2012
IDIO2. Do you think that your economic situation is better than, the same as, or worse than it was 12 months ago? Graphs shows % who
respond “worse”.
15Pandemic and Democratic
Attitudes
16Mixed support for democracy
ING4. Democracy may have problems, but it is better than any other form of government. To what extent do you agree or disagree with this
statement? 5, 6, 7 coded as “support”.
17High tolerance for alternatives
Is coup justified under… President postponing
elections justified under…
Health Corruption Health Violence
emergency emergency
Haiti 59% 43% 84% 77%
Mexico 33% 33% 66% 51%
Peru 37% 38% 65% 59%
Ecuador 34% 47% 60% 50%
JC13/JC13COVID. Some people say that under some circumstances it would be justified for the military of this country to take power by a
coup d’état (military coup). In your opinion would a military coup be justified when there is a lot of corruption / when there is a public health
emergency like the coronavirus.
18Democratic attitudes in Peru
Question Proportion
Prefer strong leader with no accountability to leader whose 48%
power is limited by Congress
Votes are counted correctly and fairly “always” 35%
The rich buy the election results “always” 46%
Politicians can find out who each person voted for “always” 75%
or “sometimes”
19LAPOP Lab Team
Elizabeth J. Zechmeister
Noam Lupu
Rubí Arana Luke Plutowski
Fernanda Boidi Mariana Rodriguez
Oscar Castorena Lindsey Thomas
Laura Kramer Valerie Schweizer
Sebastian Larrea Carole Wilson
Daniel Montalvo
Georgina Pizzolitto
This study is made possible by the support of the American People
through the United States Agency for International Development
(USAID). The contents of this study are the sole responsibility of the
authors and LAPOP and do not necessarily reflect the views of USAID
or the United States Government.You can also read