Demographic outcomes of diverse migration strategies assessed in a metapopulation of tundra swans
←
→
Page content transcription
If your browser does not render page correctly, please read the page content below
Ely and Meixell Movement Ecology (2016) 4:10
DOI 10.1186/s40462-016-0075-8

 RESEARCH                                                                                                                                         Open Access

Demographic outcomes of diverse
migration strategies assessed in a
metapopulation of tundra swans
Craig R. Ely* and Brandt W. Meixell

  Abstract
  Background: Migration is a prominent aspect of the life history of many avian species, but the demographic
  consequences of variable migration strategies have only infrequently been investigated, and rarely when using
  modern technological and analytical methods for assessing survival, movement patterns, and long-term productivity in
  the context of life history theory. We monitored the fates of 50 satellite-implanted tundra swans (Cygnus columbianus)
  over 4 years from five disparate breeding areas in Alaska, and used known-fate analyses to estimate monthly survival
  probability relative to migration distance, breeding area, migratory flyway, breeding status, and age. We specifically
  tested whether migratory birds face a trade-off, whereby long-distance migrants realize higher survival rates at the cost
  of lower productivity because of reduced time on breeding areas relative to birds that migrate shorter distances and
  spend more time on breeding areas.
  Results: Annual migration distances varied significantly among breeding areas (1020 to 12720 km), and were strongly
  negatively correlated with time spent on breeding areas (r = −0.986). Estimates of annual survival probability varied by
  wintering area (Pacific coast, Alaska Peninsula, and Eastern seaboard) and ranged from 0.79 (95%CI: 0.70–0.88) to 1.0,
  depending on criteria used to discern mortalities from radio failures. We did not find evidence for a linear relationship
  between migration distance and survival as swans from the breeding areas with the shortest and longest migration
  distances had the highest survival probabilities. Survival was lower in the first year post-marking than in subsequent
  years, but there was not support for seasonal differences in survival. Productivity varied among breeding populations
  and was generally inversely correlated to survival, but not migration distance or time spent on breeding areas.
  Conclusions: Tundra swans conformed to a major tenet of life history theory, as populations with the highest survival
  generally had the lowest productivity. The lack of a uniform relationship between time spent on breeding areas and
  productivity, or time spent on wintering areas and survival, indicates that factors other than temporal investment dictate
  demographic outcomes in this species. The tremendous diversity of migration strategies we identify in Alaskan tundra
  swans, without clear impacts on survival, underscores the ability of this species to adapt to different environments and
  climatic regimes.
  Keywords: Cygnus columbianus, Known fate, Life history, Metapopulation, Migration distance, Productivity, Satellite
  telemetry, Survival, Transmitter effects, Tundra swan

* Correspondence: cely@usgs.gov
U.S. Geological Survey, Alaska Science Centre, 4210 University Drive,
Anchorage, AK 99508, USA

                                         © 2016 Ely and Meixell. Open Access This article is distributed under the terms of the Creative Commons Attribution 4.0
                                         International License (http://creativecommons.org/licenses/by/4.0/), which permits unrestricted use, distribution, and
                                         reproduction in any medium, provided you give appropriate credit to the original author(s) and the source, provide a link to
                                         the Creative Commons license, and indicate if changes were made. The Creative Commons Public Domain Dedication waiver
                                         (http://creativecommons.org/publicdomain/zero/1.0/) applies to the data made available in this article, unless otherwise stated.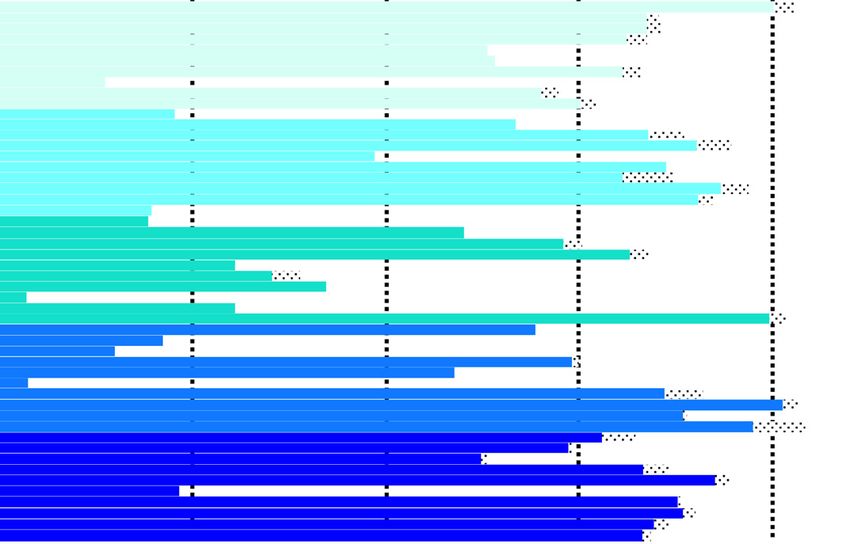
Ely and Meixell Movement Ecology (2016) 4:10                                                                      Page 2 of 15

Background                                                        tested predictions of the time allocation hypothesis with
Migration is a behavioural characteristic that is thought to      variable results (see reviews in [19, 21, 22]).
have evolved to maximize fitness in seasonal environ-                One reason for the persistence of such differing theor-
ments, and is a prominent aspect of the life history of           ies attempting to explain the inter relationships among
many avian species [1–4]. Understanding the demographic           migration distance, survival, and productivity is the lack
consequences of migration has long been a goal of avian           of suitable quantitative data, especially across popula-
ecologists, as identifying the fitness costs associated with      tions of a single species (i.e., a metapopulation). Intra-
different behaviours should further our understanding of          specific comparisons are necessary to test a more rigor-
mechanisms driving the evolution and maintenance of               ous theoretical framework for weighing life-history
avian life history strategies [5, 6]. For arctic-breeding birds   trade-offs, as cross-species comparisons may be mislead-
undergoing lengthy biannual migrations, the costs of such         ing because selective forces act differently on taxa with
an energy demanding behaviour may be substantial in               different life history characteristics. Nichols [21], in a
terms of both reproduction and survival [3, 7, 8].                review of survival rates relative to migration distance,
   The energy cost of long migrations is undeniably high          found equivocal results among studies [15, 20, 23–25] of
with potentially large negative impacts on reproduction,          which he partially attributed to the fact that many
as migrants must balance between using energy for flight          studies used >1 species, and used unreliable methods to
and storing reserves for reproduction [9, 10]. Such costs         determine survival rates. Nichols [21] went on to specif-
are likely greatest in pure capital breeders, that unlike         ically note how informative it would be to “estimate
income breeders, cannot offset the energetic burden of            fitness components (survival and reproductive rates) for
migration by foraging on breeding areas. The cost of              animals associated with different breeding or wintering
migration, especially long-distance migration, on survival        habitats of a migratory metapopulation.”
is less clear but of great interest, because the population          Identifying seasonal timing of mortality in migratory
dynamics of long-lived species are generally predicated           birds is also a key consideration, as estimates of annual
on adult survival [11, 12].                                       survival, while useful, preclude attributing mortality to a
   There are several competing hypotheses concerning              specific period of the annual cycle and may limit identi-
the demographic consequences of long distance migra-              fication of factors likely regulating the population. In
tion. Many authors have argued that long migrations               one of the few studies to link survival of long-distance
must exact a toll in terms of reduced survival compared           migrants to seasonal time periods, Klaassen et al. [13]
to sedentary species [7, 13], and it has been shown that          monitored the migration of several species of raptors
birds carrying more energy reserves (and thus capable of          using satellite telemetry, and found that morality rates
flying farther) are more vulnerable to predation than             were indeed highest during periods of migration.
leaner birds [3, 14]. Birds with longer migrations may               Tundra swans (Cygnus columbianus) are large migratory
also suffer increased mortality because they cross a              waterfowl that breed in tundra habitat throughout most of
greater diversity of landscapes and are hence potentially         the Holarctic and winter in north temperate climates at
exposed to a larger suite of predators than sedentary             varying degrees of latitude. The North American subspe-
species. In contrast, others have argued that birds               cies (C. c. columbianus) nests nearly continuously from
migrate to areas where mortality is reduced, and are              the tip of the Alaska Peninsula in south-western Alaska to
therefore expected to have higher survival rates than             the east side of Hudson Bay Canada, as well as in far east-
resident species or species that travel less far [15–18]. In      ern Chukotka [26]. Migration is a prominent behaviour of
fact, Greenberg [15] proposed that migratory birds face           tundra swans, as they spend most of the year migrating to
a trade-off, whereby long-distance migrants realize               and from the breeding grounds. Migration distances and
higher survival rates because they travel further to reach        routes vary considerably among often disjunct wintering
more benign wintering areas, but at the cost of lower             populations [27–29], allowing for detailed assessment of
productivity due to spending concomitantly less time on           demographic parameters relative to variation in migratory
breeding areas [15, 19]. He termed this dichotomy of              behaviour. Here, using modern technological and analyt-
investment the “Time Allocation” hypothesis which pre-            ical methods, we present information on factors related to
dicts that, in migratory birds, productivity and survival         the survival of tundra swans implanted with satellite
are dictated by temporal investment, with any increase            transmitters that migrated variable distances to wintering
in length of the breeding season leading to a decrease in         sites from five different breeding areas across their range
the amount of time for occupying the non-breeding range.          in Alaska. We use an information-theoretic approach and
As such, one prediction is that populations at higher             known fate survival estimation to assess the relative
latitudes, with long migration distances, should have             importance of factors likely influencing the survival of
higher survival rates and lower productivity than residents       swans, including migration distance, migratory flyway,
or short-distance migrants [15, 20]. Several studies have         age, and breeding success, while accounting for disease
Ely and Meixell Movement Ecology (2016) 4:10 Page 3 of 15
(prevalence of avian influenza viruses and blood parasites) tundra swans (ten at each of five different breeding
and contaminants. We compare survival estimates and areas) throughout the range of the species in Alaska.
breeding-area-specific indices of productivity to assess Transmitters had percutaneous antennas [32, 33] that
potential trade-offs between survival and productivity exited the body to provide the signal strength necessary
in the context of migration distance and temporal for satellite transmission.
investment.
PTT duty cycles and processing location information
Methods PTTs were programmed to transmit for 5 h and then
Study species turn off for 72 h during summer and winter periods, and
Tundra swans (Cygnus columbianus) are considered a k- turn off for 18 h during migration periods in autumn
selected species as they have delayed reproduction (do and spring [34]. The PTTs were designed to transmit for
not breed until at least 3 years of age), and are known to 2 years; if the 2-year period was exceeded, the duty cycle
live over 20 years in the wild [26]. Tundra swans are reverted to 5 h on and 72 h off for the life of the trans-
highly reliant on wetlands for roosting and feeding, but mitter. The Argos Data Collection and Location System
have also adapted to feeding on agricultural crops [30]. [35] was used to obtain information on latitude and lon-
For our study, tundra swans were captured when gitude, date, time, quality of location, body temperature,
flightless, during the annual wing molt in July and and activity of swans instrumented with PTTs. Unlikely
August, 2008 at five different breeding areas in Alaska locations were filtered based on rate and angle of
(Fig. 1). The sex of birds was determined based on movement and the highest quality locations were used
cloacal characteristics and internal examination. Birds to represent daily position [36].
were classified to age as either locals (i.e. cygnets),
second year birds (SY; birds hatched the previous year), Detection of disease and contaminants
or after second year birds (ASY). Second year birds were The presence of low pathogenic avian influenza (LPAI)
distinguished from older birds by the presence of gray viruses in tundra swans can affect migration behaviour
feathering on the head and neck, and sometimes, back [37], so birds were tested for active LPAI viruses at the
[30]. Swans were categorized relative to breeding status time of capture. Cloacal and oral-pharyngeal (OP) swabs
as either breeders (adults with cygnets), territorial pairs were obtained and either analyzed individually or pooled
(adults without cygnets on a territory), or non breeders in the field or in the laboratory in groups of 2 to 5 by
(ASY or SY birds in groups). Satellite transmitters sampling location. Detection of birds actively shedding
(platform transmitting terminals [PTTs]; model 100, two AI viruses was determined according to the standardized
AA batteries [50 g total mass], Microwave Telemetry, USDA National Animal Health Laboratory Network AI
Columbia, MD); were abdominally implanted [31] in 50 real time reverse transcriptase polymerase chain reaction
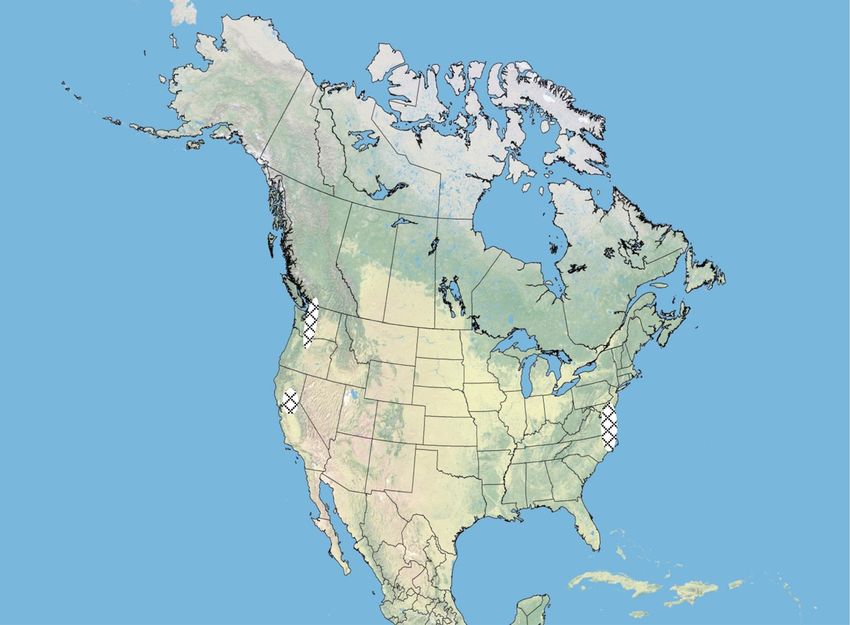
Kotzebue Sound Colville River Delta
Lowlands
Yukon-
Kuskokwim Delta Alaska
Bristol Bay Lowlands
Lower Alaska
Peninsula
BC AB
SK Canada
WA
MT
OR
MD
UT
CA VA
United States NC
Fig. 1 Location of satellite-marking of tundra swans in Alaska during 2008, showing primary migration routes from five different breeding areas.
Autumn and spring migration routes are similar. Hatched polygons are wintering areas. Most Lower Alaska Peninsula swans do not migrateEly and Meixell Movement Ecology (2016) 4:10 Page 4 of 15
(RT-PCR) protocol [38–40]. Previous work summarized normal body temperature and the battery voltage declined
levels of blood parasite infection [34] and lead contam- below 3.2v; encounter histories of birds with transmitter
ination [41] in PTT-marked and unmarked birds from failures were censored to the previous interval of known
each population. fate. Discrepancies in determining fate occurred when the
final transmission revealed normal body temperature and
Migration distance and time on breeding areas normal battery voltage. Under this scenario, it was unclear
Great circle migration distances were calculated using whether 1) the bird died in an event that damaged or
the ruler function in Google Earth to directly measure otherwise blocked the transmitter signal, or 2) the trans-
between stopover locations for each PTT-marked swan. mitter failed due to circuitry, battery, or antenna issues
Annual migration distances were determined by sum- and the bird remained alive. An assessment of location
ming the distance flown by each PTT-marked bird from and activity data did not reveal information that recon-
the breeding location to the southernmost wintering ciled these discrepancies, and we suspected that any of the
area in the autumn, with the distance flown from the options were plausible. Therefore, our analyses are based
wintering area back to the breeding area the following on two versions of the data following methods similar to
spring. Time on breeding areas was calculated by Hupp et al. [44]. In the first analysis, a conservative meas-
subtracting the date the PTT-marked swan arrived on ure of mortality was used in which ‘discrepancies’ were
the breeding area in the spring from the date it left the treated as radio failures, and their encounter histories
area the following autumn. If birds did not migrate away were censored to the interval prior to transmitter failure.
from the breeding ground they were considered breed- In the second analysis, a more liberal approach was used
ing ground residents for 365 days per year. If location for interpreting mortalities by treating discrepancies as
information was not received from a PTT on the date of mortalities in the interval the transmitter went off the air.
arrival or departure, then the date of arrival or departure Encounter histories were constructed with breeding
was assumed to be the midpoint between the dates when location as groups (Lower Alaska Peninsula [LAP], Bristol
the PTT-marked swan was known to be at the wintering Bay Lowlands [BBL], Yukon-Kuskokwim Delta [YKD],
or breeding site and the previous or succeeding date, Kotzebue Sound Lowlands [KSL], and Colville River Delta
when it was enroute. Differences in distance migrated by [CRD]), a breeding-area specific covariate of annual
swans from the different breeding areas, and time spent migration distance, and the individual covariates of age
on breeding areas, were assessed with analysis of and breeding status. For both versions of the capture
variance using a mixed model (PROC MIXED, [42]) to histories, an initial suite of 22 models was considered that
accommodate random and fixed effects. A repeated assessed variation in MSP relative to migration distance,
measures design was implemented to accommodate location (breeding and wintering areas, and management
migration distances flown by each bird across 3 years, population), time (year, season, season*year), age and
and least square means was used for post hoc pairwise breeding status, and transmitter effects (Tables 1 and 2).
comparisons. Mean estimates of annual migration Because our initial model set did not contain combi-
distance for swans from each breeding area were used as nations of some variables, additional models were
covariates in survival analysis. constructed that represented combinations of vari-
ables from models that were supported in the initial
Survival analysis model set.
Known-fate modeling was used in Program MARK [43] to We considered a model in which survival varied linearly
estimate monthly survival probabilities (MSP) of PTT- relative to mean annual migration distance for each breed-
marked tundra swans. Interval lengths corresponded to ing area. To account for additional sources of variation in
calendar months, beginning in August of 2008 and ending survival such as those resulting from differences in migra-
in July of 2012. In each month, birds were specified as tion routes, wintering locations, or factors specific to the
alive, dead, or censored based on information received breeding grounds (Table 1, [41]), we examined a breeding
from the transmitters. Swans were assumed to be alive in area-specific model, and 2 simplified location models.
a given interval if the transmission in that month revealed Tundra swans in North America are managed as 2 distinct
normal body temperature (>40 °C) and normal battery populations, the Western Population (WP) which winters
voltage (>3.2v). Birds were considered to have died during on the Pacific coast of the United States and Canada and
an interval if sensors indicated a drop in body temperature the Eastern Population (EP) which winters along the east-
while battery voltage remained above 3.2v. Months in ern seaboard of the United States. In our first simplified
which the fate of birds were unknown (i.e., signals not location model, we assessed potential differences in sur-
received from transmitters) were censored and therefore vival between management populations by constraining
did not contribute data. It was assumed that a transmitter survival among birds from the WP (LAP, BBL, YKD and
failed while a bird was still alive if sensors indicated KSL) separate from the EP (CRD). Of the WP birds in ourEly and Meixell Movement Ecology (2016) 4:10 Page 5 of 15
Table 1 Characteristics of breeding populations of tundra swans implanted with satellite transmitters relative to marking location in
Alaska. Refer to Fig. 1 for detailed distribution information
Marking location Management population Migration route Winter location Annual migration Time spent on Hunter harvest
distance ± SE (km) breeding area ± SE (d)
Colville River Delta Eastern Upper Plains NC, MD,VA 12719 ± 119 115.2 ± 2 yes
Kotzebue Sound Lowlands Western AB, SK, MT, UT CA 10753 ± 85 141.1 ± 3 yes
Yukon-Kuskokwim Delta Western AB,SK, MT, UT CA 10963 ± 133 130.9 ± 4 yes
Bristol Bay Lowlands Western seAK, BC Pacific NW, CA 7906 ± 286 172.6 ± 5 min.
Lower Alaska Peninsula Western Gulf of Alaska AK,WA, BC 1021 ± 405 351.5 ± 7 no
Annual migration distance was the combined distance of autumn and spring migration to and from marking locations on the breeding area to primary wintering
location. Hunter harvest of Bristol Bay tundra swans was considered minimal as they do not commonly migrate through the western states of Montana, Idaho and
Utah, that allow sport harvest of tundra swans, and there is no sport harvest for tundra swans allowed in the Bristol Bay region of Alaska. Tundra swans from the
Lower Alaska Peninsula are facultative migrants; only 2 of the 10 PTT-marked swans from the Lower Alaska Peninsula migrated during the study, and
only irregularly
marked sample, LAP birds are unique in that many are A year-specific model was considered to account for an-
mostly nonmigratory and winter near their breeding nual variation in survival and a number of models in which
grounds on the Alaska Peninsula [45] (Table 1). YKD and the first year post-release (Aug, 2008–July, 2009) was esti-
KSL birds first migrate eastward and then south through mated separately from remaining years (Aug, 2009–July,
western Canada, Montana, and Utah into California ([27, 2012; Table 2). These included 3 models to assess potential
41]; Fig. 1). BBL birds migrate more westerly than YKD deleterious effects associated with surgery and implantation
and KSL birds, and winter predominantly in the Pacific of the transmitters, and 6 models in which various season
Northwest [41]. CRD birds had the longest migration, as models were combined with models of annual variation.
they traversed through north central Canada, then flew Mortality risks associated with capture and transmitter
across the mid-continent northern prairies before continu- implantation were expected to be highest immediately
ing eastward to winter along the east coast [28, 41]; (Fig. 1). following surgery, and decrease thereafter. To assess this
In our final location model, we assessed variation in sur- hypothesis, a model was considered where survival was
vival relative to wintering area by considering a model that estimated separately for months 1–2 post release and
grouped birds from the three migratory WP breeding months 3–12 post release, a model where survival
areas (BBL, YKD, KSL) and estimated survival unique to increased linearly during the first 12 months post release,
the non-migratory WP location (LAP), and the breeding and a model where survival in the first year was different
area from the EP population (CRD) (Table 2). than survival in years 2–4.
To assess seasonal variation in MSP, months were Subadult swans typically have lower survival than
grouped by periods that approximated varying life-history adults [46, 47], therefore age effects were assessed by
components and differential risks to survival. June through considering a model where survival was age-specific in
August were breeding months when successful breeders the first year post-release (Table 2). Likewise, the effect
reared young and failed or non-breeders congregated in of breeding status in the first year post-release was
molting flocks; September through December represented assessed by estimating survival separately for birds cap-
autumn staging and migration when birds were exposed to tured with cygnets or on breeding territories (breeders)
hunting pressure and the physiological stress of migration; and those from molting flocks (non-breeders). Breeders
January and February were winter months during which were expected to have higher survival than non-breeders
birds remained at localized areas; and March through May because breeders are generally older birds and have thus
represented spring migration and return to the breeding already survived multiple annual cycles.
grounds. A season-specific model was considered in which Relative support among models was assessed using
survival was estimated separately for each of the 4 seasons. Akaike’s Information Criterion corrected for sample size
Because survival may be lowest during fall when swans are (AICc) and model weights (wi; [48]). To avoid selecting a
exposed to hunting pressure and risks associated with mi- model with uninformative parameters, we considered
gration, a model was considered where survival in fall models with one additional parameter competitive only
months was estimated separately from the remaining if their AICc values were lower than the simpler model
months. A third season model assessed variation in survival [48, 49]. Estimates of MSP were back-transformed from
of migration months (spring and autumn) versus non- the logit link and the delta method was used to calculate
migration months (winter and breeding) under the hypoth- associated variances. Estimates of annual survival were
esis that mortality risks were higher during migration than calculated as the product of 12 MSPs, corresponding to
while birds were generally sedentary (Table 2). August through July.Ely and Meixell Movement Ecology (2016) 4:10 Page 6 of 15
Table 2 A priori models (n = 22) considered for known-fate estimation of monthly survival probabilities (MSP) of PTT-implanted tundra
swans from Alaska, USA, 2008–2012. Ten swans were marked and released at each of 5 breeding areas: Lower Alaska Peninsula (LAP),
Bristol Bay Lowlands (BBL), Yukon-Kuskokwim Delta (YKD), Kotzebue Sound Lowlands (KSL), and Colville River Delta (CRD). Year 1 refers
to the 12 months following release in August of 2008. K = number of model parameters
MSP model K Model description
Location models
S(Migration distance) 2 Survival varies relative to annual migration distance
S(Management population) 2 Survival varies by Western Population (LAL, BBL, YKD, KSL) and
Eastern Population (CRD)
S(Wintering area) 3 Survival varies by location of wintering area (BBL, YKD, KSL + LAL + CRD)
S(Breeding area) 5 Survival varies by 5 breeding areas (LAL + BBL + YKD + KSL + CRD)
Time models
S(.) 1 Survival is constant
S(Yr) 4 Survival varies by year
Season models
S(Migration) 2 Survival during migration seasons (Autumn, Spring) varies from sedentary
seasons (Winter, Breed)
S(Autumn) 2 Survival during Autumn varies from other seasons (Spring, Winter, Breed)
S(Season) 4 Survival varies by 4 seasons (Spring + Autumn + Winter + Breed)
Age and breeding status models
S(Age*Yr1 + Yrs2-4) 3 Survival varies between SY and ASY birds in Year 1 and is constant thereafter
S(Breeding status*Yr1 + Yrs2-4) 3 Survival varies by breeders and non-breeders in Year 1 and is constant thereafter
Transmitter effect models
S(Yr1 + Yrs2-4) 2 Survival in Year 1 varies from years thereafter
S(Yr1*Trend + Yrs2-4) 3 Survival varies in a linear monthly trend during Year 1 and is constant thereafter
S(Mo1-2 + Mo3-12 + Yrs2-4) 3 Survival varies by Months 1-2 and Months 3-12 and is constant thereafter
S(Yr1*Trend + Yr) 5 Survival varies in a linear monthly trend during Year 1 and by year thereafter
S(Mo1-2 + Mo3-12 + Yr) 5 Survival varies by Months 1-2 and Months 3-12 and by year thereafter
Season * Year models
S(Migration*Yr1 + Yrs2-4) 3 Survival during migration seasons (Autumn,Spring) varies from sedentary seasons
(Winter, Breed) in Year 1 and is constant thereafter
S(Autumn*Yr1 + Yrs2-4) 3 Survival during Autumn varies from other seasons (Spring, Winter, Breed) in Year 1
and is constant thereafter
S(Season*Yr1 + Yrs2-4) 5 Survival varies by 4 seasons (Spring + Autumn + Winter + Breed) in Year 1 and is
constant thereafter
S(Migration*Yr1 + Yr) 5 Survival during migration seasons (Autumn, Spring) varies from sedentary seasons
(Winter, Breed) in Year 1 and by year thereafter
S(Autumn*Yr1 + Yr) 5 Survival during Autumn varies from other seasons (Spring,Winter,Breed) in Year 1
and by year thereafter
S(Season*Yr1 + Yr) 7 Survival varies by 4 seasons (Spring + Autumn + Winter + Breed) in Year 1 and by
year thereafter
Estimates of productivity and K. Sowl, unpubl. data). Productivity estimates for the
Estimates of productivity (% young in winter flocks) of WP collected in Utah were presumed to represent birds
tundra swans from the different breeding areas was from western Alaska (YKD and KSL), whereas productivity
obtained from the Management Plan for Western estimates from Washington were presumed to represent
Population Tundra Swans [50], the Management Plan birds from the Bristol Bay Lowlands, based on distribution
for Eastern Population Tundra Swans [51], and from field of satellite-marked and neck-banded tundra swans ([41];
studies conducted on the Lower Alaska Peninsula (C. Dau C. Ely et al. unpubl. data).Ely and Meixell Movement Ecology (2016) 4:10 Page 7 of 15
Results post-release. Of 15 definitive mortalities, 9 occurred in the
Characteristics of marked birds first year post-marking, three occurred in each of the 2nd
Ten birds were implanted with PTTs at each of the five and 3rd years, and none occurred in year 4. The majority
breeding areas (Fig. 1). Twenty-five implanted birds were of transmitter failures occurred in year 4 (Table 3);
categorized as breeders or in territorial pairs, and 25 four transmitters were still operating at the conclu-
were determined to be non-breeders. Of the 25 birds sion of the study. There were seven transmitters for
that were breeders or on territories, 21 were ASY which fate was not discernible (i.e., discrepancies) be-
females and four were ASY males (from the YKD), cause the body temperature and battery voltage were
whereas of the 25 non-breeders, 17 were ASY females, both within normal levels upon the final transmission
six were SY females, and two were SY males. None of event. These occurred in year 2 (n = 2), year 3 (n = 4),
the implanted birds tested positive for LPAI viruses [52]. and year 4 (n = 1) (Table 3). No birds died in the first
month following release. Fifty percent (25 of 50) of
Migration distance the implanted swans were either with cygnets or on
There was significant variation across breeding popu- territories, and of the 15 definite mortalities during
lations with respect to migration routes and distances the course of the study, 10 were swans designated as
travelled between breeding and wintering areas with breeders at the time of capture. Five of the ten mor-
CRD>YKD,KSL>BBL>LAP (F3,41 = 516.55, P YKD,KSL>CRD from Yrs2-4 and contained an age-effect in Yr1 (Table 4).
(F3,40 = 327.16, PEly and Meixell Movement Ecology (2016) 4:10 Page 8 of 15
Marking Location CB1
CB2
CB3
Lower Alaska CB4
CB5
CB6 UK
CB7
Peninsula CB8
CB9
CB10
*
KS1
KS2
KS3
* *
KS4
Bristol Bay KS5
KS6 *
KS7
Lowlands KS8
KS9
**
KS10
YK1
YK2
YK3
YK4
* UK
Yukon- YK5
YK6 * UK
YK7 UK
Kuskokwim Delta YK8
*
YK9
YK10 *
KZ1
KZ2
* *
Kotzebue Sound
KZ3
KZ4
KZ5
* U
Lowlands
KZ6
KZ7
KZ8
* K
KZ9
KZ10
NS1
NS2 UK
NS3
NS4
Colville River NS5
NS6
NS7 *
Delta NS8
NS9
NS10 UK
0 365 730 1095 1460
July 2008 July 2009 July 2010 July 2011 July 2012
Days Deployed
Fig. 3 Histories of 50 tundra swans implanted with satellite transmitters (PTTs) at 5 different breeding areas in Alaska in 2008. Stippled horizontal
bars indicate number of days swans were known alive based solely on body temperature information. * designates birds assumed to be dead
based on low body temperatures just before or at the time of final transmission. UK indicates a bird whose fate was in doubt, as the PTT battery
voltage was not low when transmission ceased
CI : −0:00020; 0:00007 ), season, or breeding status considered. Monthly survival of swans from LAP was
(Table 4). MSP in Yr1 for ASY swans from all locations 0.994 (SE = 0.004), for CRD was 0.992 (SE = 0.005) and
was 0.981 (SE = 0.006). Monthly survival in Yrs2–4 was for BBL, YKD, and KSL was 0.980 (SE = 0.005). True
0.989 (SE = 0.005) for BBL, YKD, and KSL birds. No SY survival of our PTT-marked birds is likely bracketed
swans died in the first year, and no birds from LAP or between estimates from conservative and liberal ap-
CRD died in Yrs2-4, so MSP was 1.0 for each of these proaches (Fig. 4).
groups.
For the second analysis, a more liberal approach Timing of mortality
was employed to discern mortalities, and 22 birds There was no support found for models that included
were considered to have died. The best supported seasonal variation in survival, as mortalities of implanted
model (w = 0.17) constrained survival by wintering area swans were nearly equally distributed across different
(Table 6). The ‘migration distance’ model received limited phases of the annual cycle (Fig. 3; Table 4). Because of
support (ΔAICc = 1.15; w = 0.10) but was not supported over the different migration chronologies across breeding
the ‘constant’ model (ΔAICc = 1.01 w = 0.11), and the migra- areas, a combination of date and location was used to
tion distance effect was equivocal (β^ mig dist ¼ −0:00008; 85% categorize “season” of mortality. Of the 15 PTT-
CI : −0:00016; 0:00001). There was little support for vari- implanted swans that we are confident died during the
ation in survival relative to transmitter effects, season, study (based on low body temperature), 7 (46.7 %) died
breeding status, or year, so additional models were not during summer (on breeding areas), 5 (33.3 %) died
Table 3 Fate of tundra swans marked with abdominally implanted satellite transmitters in Alaska in 2008
Fate of marked birds
Year Interval Survived Died Transmitter failures Unknown
1 (Aug-2008–Jul-2009) 41 9 0 0
2 (Aug-2009–Jul-2010) 36 3 0 2
3 (Aug-2010–Jul-2011) 25 3 4 4
4 (Aug-2011–Jul-2012) 4 0 20 1
Swans with unknown fates (i.e. “discrepancies”) had transmitters that reported normal body temperature and normal battery voltage in their last transmission. All
mortalities the first year were ASY birdsEly and Meixell Movement Ecology (2016) 4:10 Page 9 of 15
Table 4 Model selection results for estimating monthly survival during migration (while in transit between breeding and
probability (MSP) of PTT-implanted tundra swans from Alaska, wintering areas; 3 in spring and 2 in autumn), and 3
USA, 2008–2012. Results include 22 models from the a priori model (20 %) died during winter (while at terminal southern
set and are based on a version of the data containing 15 sites). Of the summer mortalities, one occurred before
mortalities (see text). Models are ranked based on Akaike’s nest initiation (26 May 2009 in Kotzebue Sound
Information Criterion adjusted for small sample sizes (AICc)
Lowlands), two during the incubation period (11 June
and model weight (wi). K = number of model parameters;
AICc of top model = 168.19
2009 and 13 June 2010 in the Bristol Bay Lowlands), two
during the early brood rearing period (12 July on the Y-
MSP model K ΔAICc wi Deviance
K Delta and 13 July on the Colville River Delta), and two
Wintering area 3 0.00 0.19 162.17
just before autumn migration (16 September 2008 on
Age * Yr1 + Yrs2-4 3 0.09 0.18 162.26 the Y-K Delta, and 16 September 2008 in the Kotzebue
Yr1 + Yrs2-4 2 1.48 0.09 165.66 Sound Lowlands; Fig. 3).
Yr1 * Trend + Yrs2-4 3 1.85 0.07 164.02
Management population 2 2.08 0.07 166.26 Population-specific productivity
Autumn * Yr1 + Yrs2-4 3 2.83 0.05 165.01 Productivity, determined by the proportion of young
Constant 1 3.10 0.04 169.28 swans observed in winter flocks, varied significantly
Breeding area 5 3.19 0.04 161.34
among swans from the different breeding areas (Fig. 5;
F3,72 = 20.62, PEly and Meixell Movement Ecology (2016) 4:10 Page 10 of 15
Table 6 Model selection results for estimating monthly survival Nearctic tundra swans are considered to be income
probability (MSP) of PTT-implanted tundra swans from Alaska, USA, breeders (Nolet 2006), and therefor likely do not
2008–2012. Results include 22 models from the a priori model set undergo the great increases in spring body mass as
and are based on a version of the data containing 22 mortalities other large-bodied arctic-nesting waterfowl that are
(discrepancies considered mortalities). Models are ranked based on capital breeders. As such they may be relinquished
Akaike’s Information Criterion adjusted for small sample sizes (AICc)
from the burden of carrying large energy stores and the
and model weight (wi). K = number of model parameters; AICc of
top model = 232.52
concomitant increased risk of predation.
Few other studies have simultaneously estimated
MSP model K ΔAICc wi Deviance
magnitude and/or timing of mortality relative to flight
Wintering area 3 0.00 0.18 226.50
distance in birds, and of the studies conducted, there has
Breeding area 5 0.71 0.13 223.19 not been a consensus on the relationship between migra-
Constant 1 1.01 0.11 231.53 tion distance and mortality. Sandercock and Jaramillo [22]
Migration distance 2 1.15 0.10 229.66 used a modern analytical approach to determine survival
Age * Yr1 + Yrs2-4 3 1.37 0.09 227.87 rates of several passerine species relative to migration
distance and found no relationship, nor did Souchay et al.
Management population 2 1.70 0.08 230.21
[56] who studied two subpopulations of greater snow
Autumn 2 2.76 0.05 231.27
geese (A. caerulescens atlanticus) that migrated different
Yr1 + Yrs2-4 2 2.77 0.05 231.28 distances. In contrast, Gillis et al. [57] found that resident
Migration 2 3.02 0.04 231.53 dippers (Cinclus mexicanus) had lower annual survival
Yr1 * Trend + Yrs2-4 3 3.13 0.04 229.63 rates than migrants, and Varner and Eicholz [58] found a
Autumn * Yr1 + Yrs2-4 3 4.12 0.02 230.62 positive relationship between survival and migration
distance for subadult (but not adult) trumpeter swans
Mo1-2 + Mo3-12 + Yrs2-4 3 4.66 0.02 231.16
(Cygnus buccinator). A similar age-dependent relationship
Breeding status * Yr1 + Yrs2-4 3 4.67 0.02 231.17
between migration distance and survival has been found
Migration * Yr1 + Yrs2-4 3 4.73 0.02 231.23 for greater flamingos (Phoenicopterus roseus; [59]), with
Yr 4 5.29 0.01 229.78 young birds showing a negative relationship and older
Yr1 * Trend + Yr 5 5.66 0.01 228.14 birds a positive relationship, the latter of which was attrib-
Autumn * Yr1 + Yr 5 6.64 0.01 229.12 uted to the better body condition of adult birds migrating
to a more suitable, but distant, wintering area. Alves et al.
Season 4 6.79 0.01 231.28
[60] reported that populations of Icelandic black-tailed
Mo1-2 + Mo3-12 + Yr 5 7.19 0.01 229.67
godwits (Limosa limosa islandica) that wintered in milder
Migration * Yr1 + Yr 5 7.26 0.00 229.74 climates fared better than populations wintering in a
Season * Yr1 + Yrs2-4 5 7.93 0.00 230.41 harsher environment, regardless of migration distance,
Season * Yr1 + Yr 7 10.47 0.00 228.91 while Lok et al. [61] found that Eurasian spoonbills
(Platalea leucorodia – a large-bodied waterbird) that
migrated the furthest were the least likely to survive,
migration in terms of daily energy expenditure. Tundra which they attributed, in part, to constraints of tradition,
swans are known to be slow migrants, and can take up to or “migratory tendency”. The latter finding highlights the
several months to move between wintering and breeding difficulty in finding generality in migration strategies
areas [27–29, 53]. If the energetic cost of migration is across species with different life history traits, especially if
spread out across a long time period, then the daily or behavioral attributes such as migration tradition, are
weekly burden of energy intake is greatly diminished and unaccounted for.
migrants can spend more time in non-foraging activities
such as predator detection and pair and family mainten- Transmitter effects
ance. Prolonging migration over several months may also Attaching a transmitter to an animal can cause mortality
benefit tundra swans indirectly if such a tactic releases directly due to physical encumbrance or indirectly by
them from energetic or behavioural constraints such as negatively affecting behaviour that could increase vulner-
hyperphagia and rapid weight gain, which several authors ability to predators or limit foraging. Many negative
have speculated increases susceptibility to predation impacts of external transmitters can be overcome with
relative to leaner birds [3, 54, 55]. A loss of agility, even in transmitter implantation, but internal devices and the
tundra swans (whose large body size provides protection surgical procedures necessary to implant them might
from many predators), could prove decisive, as they rely on also reduce survival. The 2–4 weeks following surgical
agility to avoid eagles and other large predators, which are implantation are considered by many to be the time
common on staging areas across North America. However, when surgery-related mortality would most likely occurEly and Meixell Movement Ecology (2016) 4:10 Page 11 of 15 Fig. 4 Annual survival probabilities of satellite-implanted tundra swans based on 15 mortalities (solid circles) or 22 mortalities (open circles). Age and year were supported parameters for the 15-mortality model while only location was supported in the 22-mortality model [32, 62]. None of the tundra swans in this study died and behaviourally more similar to swans, Hupp et al. [33] during this post-operative period, suggesting that acute studied the effects of implanted radios on the behaviour effects of implantations were minimal. However, there and survival of Canada geese (Branta canadensis) and may have been delayed (>2 months post release) effects found very few deleterious effects, with just 1 % of overall of handling and implantation as the version of encounter mortality attributed to transmitter implantation. histories that used a conservative approach (i.e. 15 mortalities) contained a disproportionate number of Timing of mortality mortalities in the first year post-release (9 of 15). Also, The finding that mortalities of swans in this study were the estimate of annual survival for the year immediately evenly distributed throughout the annual cycle is in con- following release (0.79) was lower than estimates for the trast to the findings of other studies that have reported subsequent 3 years (range: 0.87–1.0). However, several declines in survival during specific times of the year. factors indicate that transmitter effects were likely Although Gauthier et al. [51] reported adult survival rates minimal, and if present, were likely limited to the first in greater snow geese were highest during periods of year post release, as 1) survival in the first 2 months was migration and reproduction, most studies of large-bodied not lower than the following 10 months; 2) MSP during migratory birds have shown survival is lower during the first year post-release did not increase linearly periods of migration, including barnacle geese (Branta through time; and 3) mortalities were distributed evenly leucopsis; [65]), greater white-fronted geese (Anser albi- throughout the first year post-release. frons; [66]), and emperor geese (Anser canagicus; [44]). In Previous studies of large waterfowl, including common perhaps the most extensive study of the timing of mortality eiders (Somateria mollisma), have demonstrated that im- events, Klaassen et al. [13] reported that mortalities of 69 plantation of transmitters can lead to first year mortality, satellite-tracked raptors occurred throughout the year, but affect behaviour, and influence dive performance [63, 64]. that mortality was highest during periods of migration. However, the birds in these studies were likely adversely Hence, despite our finding here, there is ample evidence affected by transmitter implantation during the nesting that the migration period is costly to many species of long- period [63], and by the effects of organ compression dur- lived migratory birds. However, even in species for which ing diving [64]. In contrast, in a species morphologically costs can not be directly linked to the period of migration,
Ely and Meixell Movement Ecology (2016) 4:10                                                                                                 Page 12 of 15

                                                         30

                                Productivity (% young)
                                                         25
                                                                                                   (21)
                                                         20

                                                         15
                                                                                 (21)

                                                         10                                                        (21)
                                                                 (10)
                                                          5

                                                              Lower Alaska   Bristol Bay      Yukon-Kuskokwim    Eastern
                                                              Peninsula      Lowlands         Delta/Kotzebue    Population
                                                                                              Sound
                                                                                                                (Colville River
                                                                                                                  Delta)
                                                                             Breeding Location
 Fig. 5 Productivity of tundra swans from 4 breeding area in Alaska, as represented by percentage of immature (hatch year) birds observed in winter
 flocks. Data for the Lower Alaska Peninsula are from 1978 to 2006, non-inclusive, whereas estimates from the other sites are for 1980–2000 (see Methods).
 Eastern population swans are represented by Colville River Delta swans. Values in parentheses are the number of years with productivity estimates

it is possible that the cumulative costs of migration may                                  (C. Ely et al. unpubl. data), which demonstrates heterogen-
be realized outside periods of travel, whereby deficits                                    eity in the migration tendencies of LAP swans, although it
incurred during migration may not be manifest until                                        does not necessarily establish them as an open population.
a later date, and hence “carried over” [67]. Such carry                                      High annual survival in swans as found in this study
over effects could be in the form of nutrient deficits, de-                                has also been noted by other investigators. In a cross-
layed responses to pathogen exposure, or to decreased                                      species comparison, Bart, Earnst and Bacon [69] found
survival due to a breakdown in pair bonds and family                                       that migratory swan species, including tundra, Bewick’s
structure, especially in species such as swans and geese                                   (C. c. bewickii), whooper (C. cygnus), and trumpeter
with complex multi-generational social structures. So-                                     (C. buccinator), had higher annual adult survival rates
cial structure is likely most labile in geese and swans                                    (near 90 %), than non-migratory adult swans, including
while they are in large concentrations on staging areas                                    mute (C. olor), black (C. atratus), and black-necked
when disturbance by predators and humans is likely                                         (C. melanocoryphus) which generally had annual sur-
magnified [68].                                                                            vival rates of 80–85 %.

Survival estimates compared to other studies                                               Possible sources of variation in survival
Our estimates of annual survival for swans marked on the                                   For both versions of the data used in estimation of survival
Lower Alaska Peninsula ranged from 0.93 to 1.0. This is                                    the top models differentiated survival by wintering loca-
considerably higher than the mean apparent annual                                          tion, predicting that swans with winter ranges along the
survival estimate of 0.61 during the years 1978–1989 for                                   Pacific coast had lower survival than those that wintered
neck-collared swans at the same location [47]. Meixell et                                  on the eastern seaboard and the relatively sedentary swans
al. [47] suggested the low and variable estimates of                                       from the lower Alaska Peninsula. There are many factors
apparent annual survival for LAP swans may have resulted                                   related to the distribution of avian populations that may
from high and variable rates of permanent emigration. Of                                   affect survival [70]. Hunter harvest is known to limit
the 10 swans we marked on the LAP, only 2 migrated out                                     populations of large-bodied Anatidae [71] and could
of Alaska during the winter, and both individuals returned                                 potentially impact tundra swan populations, although
the same year. A high proportion of neck banded swans                                      none of our PTT-marked birds were reported to have
from the LAP were detected on wintering areas each year                                    been harvested. This is not too surprising as federal and
Ely and Meixell Movement Ecology (2016) 4:10 Page 13 of 15 state/provincial agencies generally restrict harvest of survival and productivity, with CRD and LAP swans tundra swans compared to other waterfowl, and on having relatively high survival and low productivity as average
Ely and Meixell Movement Ecology (2016) 4:10                                                                                                              Page 14 of 15

Availability of supporting data                                                       13. Klaassen RH, Hake M, Strandberg R, Koks BJ, Trierweiler C, Exo KM, et al.
The location and sensor data for the PTT-implanted tundra                                 When and where does mortality occur in migratory birds? Direct evidence
                                                                                          from long-term satellite tracking of raptors. J Anim Ecol. 2014;83(1):176–84.
swans supporting the results of this article are available in                         14. Burns JG, Ydenberg RC. The effects of wing loading and gender on the
Movebank (https://www.movebank.org) and are available                                     escape flights of least sandpipers (Calidris minutilla) and western sandpipers
upon request. Maps showing movement of individual birds                                   (Calidris mauri). Behav Ecol Sociobiol. 2002;52(2):128–36.
                                                                                      15. Greenberg R. Demographic aspects of long-distance migration. In: Keast A,
can also be accessed via the Alaska Science Centre                                        Morton ES, editors. Migrant birds in the Neotropics: ecology, behavior,
website: http://alaska.usgs.gov/science/biology/avian_in                                  distribution, and conservation. Washington: Smithsonian Institution Press;
fluenza/TUSW/index.php#map.                                                               1980. p. 493–504.
                                                                                      16. Ketterson ED, Nolan V Jr. The evolution of differential bird migration.
                                                                                          Current Ornithology. 1983;(1)357–402. Springer.
Competing interests                                                                   17. McKinnon L, Smith PA, Nol E, Martin JL, Doyle FI, Abraham KF, et al. Lower
The authors declare that they have no competing interests.                                predation risk for migratory birds at high latitudes. Science. 2010;327(5963):
                                                                                          326–7. doi:10.1126/science.1183010.
Authors’ contributions                                                                18. Alves JA, Gunnarsson TG, Hayhow DB, Appleton GF, Potts PM, Sutherland
CE conceived of the study, carried out field work, performed data analysis,               WJ, et al. Costs, benefits, and fitness consequences of different migratory
and drafted the manuscript. BM performed data analysis, and helped draft                  strategies. Ecology. 2013;94(1):11–7.
the manuscript. Both authors read and approved the final manuscript.                  19. Bell CP. Inter-and intrapopulation migration patterns. In: Greenberg R, Marra
                                                                                          PP, editors. Birds of two worlds. Baltimore: Johns Hopkins University Press;
                                                                                          2005. p. 41–52.
Acknowledgements                                                                      20. Hestbeck JB, Nichols JD, Hines JE. The relationship between annual survival
We are grateful to the U.S. Geological Survey (USGS), and the U.S. Fish and               rate and migration distance in Mallards: an examination of the time-allocation
Wildlife Service (USFWS) that funded this work as part of an effort to monitor            hypothesis for the evolution of migration. Can J Zool. 1992;70(10):2021–7.
avian influenza viruses in wild migratory birds and identify factors related to       21. Nichols JD. Sources of variation in migratory movements of animal
the transmission of the viruses in North America. We especially appreciate the            populations: statistical inference and a selective review of empirical results
support of Dirk Derksen (USGS) and Kimberly Trust (USFWS) who arranged                    for birds. In: Rhodes OJ, Chesser RK, Smith MH, editors. Population dynamics
funding for the study. We are grateful to the many field assistants and                   in ecological space and time. Chicago: University of Chicago Press; 1996. p.
veterinarians with helped with capture and marking in Alaska. Christian Dau               147–97.
and Kristine Sowl kindly provided productivity data from the LAP. We                  22. Sandercock BK, Jaramillo A. Annual survival rates of wintering sparrows:
appreciate the software programming and advice provided by David Douglas.                 assessing demographic consequences of migration. Auk. 2002;119(1):149–65.
We are thankful for the oversights of the Institutional Animal Care and Use           23. Sherry TW, Holmes RT, Martin T, Finch D. Summer versus winter limitation
Committees (IACUC) of the U.S. Fish and Wildlife Service Region 7, and the U.S.           of populations: what are the issues and what is the evidence. In: Martin TE,
Geological Survey (USGS), Alaska Science Centre (ASC), under Federal Permit #             Finch DM, editors. Ecology and management of neotropical migratory birds.
MB789758 (2007–2010), and ASC IACUC # 2008–15 (2009–2010). Any use of                     New York: Oxford University Press; 1995. p. 85–120.
trade, firm, or product names is for descriptive purposes only and does not           24. Harrington BA, Hagan JM, Leddy LE. Site fidelity and survival differences
imply endorsement by the U.S. Government. The authors declare that they                   between two groups of New World Red Knots (Calidris canutus). Auk. 1988;
have no conflict of interest. We appreciated the helpful reviews provided by              105(3):439–45.
John Pearce, Joel Schmutz, James Sedinger, and two anonymous reviewers.               25. Nichols J, Johnson F. Wood duck population dynamics: a review. In:
                                                                                          Fredrickson LH, Burger GV, Havera SP, Graber DA, Kirby RE, Taylor TS, editors.
Received: 9 December 2015 Accepted: 30 March 2016                                         Proceedings of the North American Wood Duck Symposium. Missouri: St.
                                                                                          Louis; 1990. p. 83–105.
                                                                                      26. Limpert RJ, Earnst SL. Tundra Swan: Cygnus columbianus. The birds of North
References                                                                                America. Washington: American Ornithologists’ Union; 1994.
1. Lack D. Bird migration and natural selection. Oikos. 1968;1:1–9.                   27. Ely CR, Douglas DC, Fowler AC, Babcock CA, Derksen DV, Takekawa J.
2. Berthold P. Control of bird migration. London: Chapman and Hall; 1996.                 Migration behavior of tundra swans from the Yukon-Kuskokwim Delta,
3. Alerstam T, Hedenström A, Åkesson S. Long-distance migration: evolution                Alaska. Wilson Bulletin. 1997;109(4):679–92.
    and determinants. Oikos. 2003;103(2):247–60.                                      28. Petrie S, Wilcox K. Migration chronology of eastern-population tundra
4. Winkler DW, Jørgensen C, Both C, Houston AI, McNamara JM, Levey DJ, et                 swans. Can J Zool. 2003;81(5):861–70.
    al. Cues, strategies, and outcomes: how migrating vertebrates track               29. Nolet BA. Speed of spring migration of Tundra Swans Cygnus columbianus
    environmental change. Mov Ecol. 2014;2(10):1–15.                                      in accordance with income or capital breeding strategy? Ardea. 2006;94(3):
5. Stearns SC. The evolution of life history traits: a critique of the theory and a       579–90.
    review of the data. Annu Rev Ecol Syst. 1977;8:145–71.                            30. Baldassarre G. Ducks, Geese, and Swans of North America. Baltimore: Johns
6. Alerstam T, Högstedt G. Bird migration and reproduction in relation to                 Hopkins University Press; 2014.
    habitats for survival and breeding. Ornis Scand. 1982;13(1):25–37.                31. Korschgen CE, Kenow KP, Gendron-Fitzpatrick A, Green WL, Dein FJ.
7. Alerstam T, Christie DA. Bird migration. New York: Cambridge University                Implanting intra-abdominal radiotransmitters with external whip antennas
    Press; 1993.                                                                          in ducks. J Wildl Manag. 1996;60(1):132–7.
8. Newton I. The migration ecology of birds. Amsterdam: Academic; 2010.               32. Mulcahy DM, Esler D. Surgical and immediate postrelease mortality of harlequin
9. Bromley RG, Jarvis RL. The energetics of migration and reproduction of                 ducks (Histrionicus histrionicus) implanted with abdominal radio transmitters with
    Dusky Canada Geese. Condor. 1993;95(1):193–210.                                       percutaneous antennae. J Zoo Wildl Med. 1999;30(3):397–401.
10. Bruderer B, Salewski V. Lower annual fecundity in long-distance migrants          33. Hupp JW, Pearce JM, Mulcahy DM, Miller DA. Effects of abdominally implanted
    than in less migratory birds of temperate Europe. J Ornithol. 2009;150(1):            radiotransmitters with percutaneous antennas on migration, reproduction, and
    281–6.                                                                                survival of Canada geese. J Wildl Manag. 2006;70(3):812–22.
11. Lebreton J, Clobert J. Bird population dynamics, management, and                  34. Ramey AM, Ely CR, Schmutz JA, Pearce JM, Heard DJ. Molecular detection of
    conservation: the role of mathematical modelling. In: Perrins CM, Lebreton            hematozoa infections in tundra swans relative to migration patterns and
    JD, Hirons GJM, editors. Bird population studies: their relevance to                  ecological conditions at breeding grounds. PLoS One. 2012;7(9):e45789.
    conservation and management. Oxford: Oxford University Press; 1991. p.            35. CLS (Collecte Localisation Satellites). Argos User’s Manual. 2011. www.argos-
    105–24.                                                                               system.org/manual/.
12. Schmutz JA, Rockwell RF, Petersen MR. Relative effects of survival and            36. Douglas DC, Weinzierl R, Davidson SC, Kays R, Wikelski M, Bohrer G, et al.
    reproduction on the population dynamics of emperor geese. J Wildl Manag.              Moderating Argos location errors in animal tracking data. Methods Ecol
    1997;61(1):191–201.                                                                   Evol. 2012;3(6):999–1007. doi:10.1111/j.2041-210X.2012.00245.x.
Ely and Meixell Movement Ecology (2016) 4:10 Page 15 of 15
37. Van Gils JA, Munster VJ, Radersma R, Liefhebber D, Fouchier RA, Klaassen M. 61. Lok T, Overdijk O, Piersma T. Migration tendency delays distributional
Hampered foraging and migratory performance in swans infected with low- response to differential survival prospects along a flyway. Am Nat. 2013;
pathogenic avian influenza A virus. PLoS One. 2007;2(1):e184. 181(4):520–31.
38. Purchase HG, Arp LH, Domermuth CH, Pearson JE. A laboratory manual for 62. Hupp JW, Hodges JI, Conant BP, Meixell BW, Groves DJ. Winter distribution,
the isolation and identification of avian pathogens. 3rd ed. Dubuque: movements, and annual survival of radiomarked Vancouver Canada geese
Kendall/Hunt Publishing Co.; 1989. in southeast Alaska. J Wildl Manag. 2010;74(2):274–84. doi:10.2193/2009-057.
39. Spackman E, Senne DA, Myers T, Bulaga LL, Garber LP, Perdue ML, et al. 63. Fast PLF, Fast M, Mosbech A, Sonne C, Gilchrist HG, Descamps S. Effects of
Development of a real-time reverse transcriptase PCR assay for type A implanted satellite transmitters on behavior and survival of female common
influenza virus and the avian H5 and H7 hemagglutinin subtypes. J Clin eiders. J Wildl Manag. 2011;75(7):1553–7. doi:10.1002/jwmg.220.
Microbiol. 2002;40(9):3256–60. 64. Latty CJ, Hollmén TE, Petersen MR, Powell AN, Andrews RD. Abdominally
40. U.S. Avian Influenza Interagency Working Group. An early detection system implanted transmitters with percutaneous antennas affect the dive
for highly pathogenic H5N1 avian influenza in wild migratory birds. US performance of common eiders. Condor. 2010;112(2):314–22.
Department of Agriculture. Washington, DC; 2006. doi:10.1525/cond.2010.090022.
41. Ely CR, Franson JC. Blood lead concentrations in Alaskan tundra swans: 65. Owen M, Black JM. Factors affecting the survival of barnacle geese on
linking breeding and wintering areas with satellite telemetry. Ecotoxicology. migration from the breeding grounds. J Anim Ecol. 1989;58(2):603–17.
2014;23(3):349–56. 66. Schmutz JA, Ely CR. Survival of greater white-fronted geese: effects of year,
42. SAS. STAT user’s guide: statistics. Cary: SAS Inst Inc; 2004. p. 123–36. season, sex, and body condition. J Wildl Manag. 1999;63(4):1239–49.
43. White GC, Burnham KP. Program MARK: survival estimation from 67. Duriez O, Ens BJ, Choquet R, Pradel R, Klaassen M. Comparing the seasonal
populations of marked animals. Bird Study. 1999;46(S1):S120–S39. survival of resident and migratory oystercatchers: carry-over effects of
44. Hupp JW, Schmutz JA, Ely CR. Seasonal survival of radiomarked emperor habitat quality and weather conditions. Oikos. 2012;121(6):862–73.
geese in western Alaska. J Wildl Manag. 2008;72(7):1584–95. doi:10.1111/j.1600-0706.2012.20326.x.
45. Dau CP, Sarvis JE. Tundra Swans of the lower Alaska Peninsula: differences in 68. Owen M, Black JM, Liber H. Pair bond duration and timing of its formation
migratory behavior and productivity. Waterbirds. 2002;25(Supplement):241–9. in barnacle geese (Branta leucopsis). In: Weller M, editor. Waterfowl in
46. Nichols JD, Bart J, Limpert RJ, Sladen WJ, Hines JE. Annual survival rates of winter. Minneapolis: University of Minnesota Press; 1988. p. 23–38.
adult and immature eastern population tundra swans. J Wildl Manag. 1992; 69. Bart J, Earnst SL, Bacon PJ. Comparative demography of the swans: a
56(3):485–94. review. Wildfowl. 1991;Supplement(1):15–21.
47. Meixell BW, Lindberg MS, Conn PB, Dau CP, Sarvis JE, Sowl KM. Age-specific 70. Saracco J, Royle J, DeSante D, Gardner B. Modeling spatial variation in avian
survival of tundra swans on the Lower Alaska Peninsula. Condor. 2013; survival and residency probabilities. Ecology. 2010;91(7):1885–91.
115(2):280–9. 71. Menu S, Gauthier G, Reed A. Changes in survival rates and population
48. Burnham KP, Anderson DR. Model selection and multimodel inference: a dynamics of greater snow geese over a 30-year period: implications for
practical information-theoretic approach. New York: Springer; 2002. hunting regulations. J Appl Ecol. 2002;39(1):91–102.
49. Arnold TW. Uninformative parameters and model selection using Akaike’s 72. Eastern Population Tundra Swan Committee. A Management Plan for the
Information Criterion. J Wildl Manag. 2010;74(6):1175–8. doi:10.2193/2009-367. Eastern Population of Tundra Swans. 2007. www.pacificflyway.gov/
Documents/Ets_plan.pdf.
50. Council PF. Management plan for Western Population tundra swans. Pacific
73. U.S. Fish and Wildlife Service. Management Plan for Western Population
Flyway Study Committee on tundra swans. Portland: U.S. Fish and Wildlife
tundra swans. Portland; 2001. http://pacificflyway.gov/documents/wts_plan.
Service; 2001.
pdf.
51. Gauthier G, Pradel R, Menu S, Lebreton J-D. Seasonal survival of greater
74. Møller AP, Erritzøe J. Predation against birds with low immunocompetence.
snow geese and effect of hunting under dependence in sighting
Oecologia. 2000;122(4):500–4.
probability. Ecology. 2001;82(11):3105–19.
75. Ricklefs RE. On the evolution of reproductive strategies in birds:
52. USFWS/USGS. Sampling for highly pathogenic Asian H5N1 avian influenza
reproductive effort. Am Nat. 1977;111(979):453–78.
in migratory birds in Alaska:results of 2008—2010 field seasons. Progress
Report. U.S. Fish and Wildlife Service (Region7, Alaska), U.S. Geological
Survey, Alaska Science Centre, Anchorage, Alaska and U.S. Geological
Survey, National Wildlife Health Centre, Madison, Wisconsin. http://alaska.
usgs.gov/science/biology/avian_influenza/pubs.php. 2009.
53. Nuijten RJM, Kölzsch A, van Gils JA, Hoye BJ, Oosterbeek K, de Vries PP, et al.
The exception to the rule: retreating ice front makes Bewick’s swans Cygnus
columbianus bewickii migrate slower in spring than in autumn. J Avian Biol.
2014;45(2):113–22. doi:10.1111/j.1600-048X.2013.00287.x.
54. Rogers CM. Food limitation among wintering birds. In: Greenberg R, Marra
PP, editors. Birds of two worlds. Baltimore: Johns Hopkins University Press;
2005. p. 106–13.
55. van den Hout PJ, Mathot KJ, Maas LRM, Piersma T. Predator escape tactics
in birds: linking ecology and aerodynamics. Behav Ecol. 2010;21(1):16–25.
doi:10.1093/beheco/arp146.
56. Souchay G, Gauthier G, Lefebvre J, Pradel R. Absence of difference in
survival between two distant breeding sites of greater snow geese. J Wildl
Manag. 2015;79(4):570–8. doi:10.1002/jwmg.879. Submit your next manuscript to BioMed Central
57. Gillis EA, Green DJ, Middleton HA, Morrissey CA. Life history correlates of and we will help you at every step:
alternative migratory strategies in American Dippers. Ecology. 2008;89(6):1687–95.
58. Varner DM, Eichholz MW. Annual and seasonal survival of trumpeter swans in • We accept pre-submission inquiries
the upper midwest. J Wildl Manag. 2012;76(1):129–35. doi:10.1002/jwmg.280. • Our selector tool helps you to find the most relevant journal
59. Sanz-Aguilar A, Bechet A, Germain C, Johnson AR, Pradel R. To leave or not
• We provide round the clock customer support
to leave: survival trade-offs between different migratory strategies in the
greater flamingo. J Anim Ecol. 2012;81(6):1171–82. doi:10.1111/j.1365-2656. • Convenient online submission
2012.01997.x. • Thorough peer review
60. Alves JA, Gunnarsson TG, Potts PM, Gélinaud G, Sutherland WJ, Gill JA. • Inclusion in PubMed and all major indexing services
Overtaking on migration: does longer distance migration always incur a
penalty? Oikos. 2012;121(3):464–70. doi:10.1111/j.1600-0706.2011.19678.x. • Maximum visibility for your research
Submit your manuscript at
www.biomedcentral.com/submitYou can also read