Design presentationzen - Garr Reynolds - Pearsoncmg.com
←
→
Page content transcription
If your browser does not render page correctly, please read the page content below

“Garr has done it again. Don’t go onstage without him.”   Seth Godin

presentationzen
design
A simple visual approach to presenting in today’s world

Garr Reynolds

presentationzen
design
A simple visual approach to presenting in today’s world

Presentation Zen Design, Second Edition
A Simple Visual Approach to Presenting in Today’s World
Garr Reynolds

New Riders
www.newriders.com

To report errors, please send a note to errata@peachpit.com
New Riders is an imprint of Peachpit, a division of Pearson Education
Copyright © 2014 by Garr Reynolds

Senior Editor: Karyn Johnson
Production Editor: Katerina Malone
Copy Editor: Kelly Kordes Anton
Compositors: Garr Reynolds, Danielle Foster
Proofreader: Rebecca Rider
Indexer: Jack Lewis
Design Consultants: Mayumi Nakamoto, Mimi Heft
Book and Cover Design: Garr Reynolds

Notice of Rights
All rights reserved. No part of this book may be reproduced or transmitted in any form by any
means, electronic, mechanical, photocopying, recording, or otherwise, without the prior written per-
mission of the publisher. For information on getting permission for reprints and excerpts, contact
permissions@peachpit.com.

Notice of Liability
The information in this book is distributed on an “As Is” basis without warranty. While every precaution
has been taken in the preparation of the book, neither the author nor Peachpit shall have any liability
to any person or entity with respect to any loss or damage caused or alleged to be caused directly or
indirectly by the instructions contained in this book or by the computer software and hardware prod-
ucts described in it.

Trademarks
Many of the designations used by manufacturers and sellers to distinguish their products are claimed
as trademarks. Where those designations appear in this book, and Peachpit was aware of a trademark
claim, the designations appear as requested by the owner of the trademark. All other product names
and services identified throughout this book are used in editorial fashion only and for the benefit of
such companies with no intention of infringement of the trademark. No such use, or the use of any
trade name, is intended to convey endorsement or other affiliation with this book.

ISBN-13: 978-0-321-93415-4
ISBN-10:     0-321-93415-6

987654321

Printed and bound in the United States of America

To our children, who remind us always
   to embrace the beginner's mind.
iv Presentation Zen Design

Table of Contents
Acknowledgments, vii

INTRODUCTION
Design Matters, 5

COMPONENTS
Presenting with Type, 29
Communicating with Color, 63
Using Images to Tell Stories, 93
Making an Impact with Video, 127
Simplifying the Data, 147

PRINCIPLES
Seeing and Using Space, 181
Creating Purpose and Focus, 203
Achieving Harmony, 221

The Journey
Slide Samples, 241
Continuous Improvement, 257

Photo Credits, 272
Index, 273
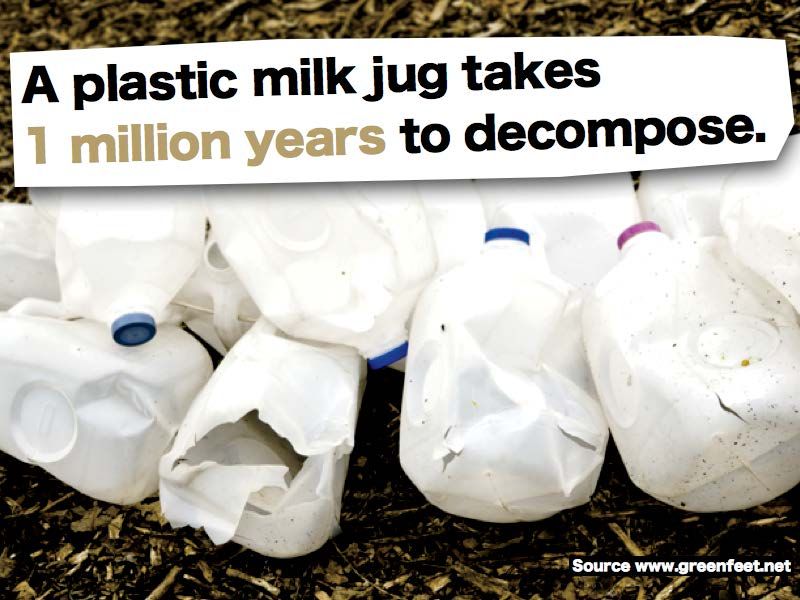
Photo: TEDxKyoto, Mai Morokawa.

Acknowledgments
This book would not have been possible with- To Patrick Newell for his contribution and
out a lot of help and support. I’d like to thank friendship.
the following people for their contributions and A special thanks to Scott Kelby, John
encouragement: McWade, Maureen Stone, Stephen Few,
Nancy Duarte and Mark Duarte and all the David S. Rose, and Nancy Duarte for their
wonderful staff at Duarte, Inc., in Silicon very kind contributions to the book.
Valley, including Paula Tesch and Tracy Barba, Back in the States, a big thank you to those
for their support. who contributed ideas and support, includ-
At New Riders: My great editor Karyn ing Debbie Thorn, CZ Robertson, and to my
Johnson for her fantastic suggestions and buddies in Silicon Valley, Ric Bretschneider
unbelievable patience. Mimi Heft for her help and Howard Cooperstein. Also to Mark and Liz
with the design and the cover. Katerina Malone Reynolds for picking me up in the snow.
(production editor) for her talent and patience, Thank you to Mark Templeton and the amaz-
as well as Danielle Foster for her great produc- ing folks at Citrix.
tion work. Sara Jane Todd for her wonderful I’d like to thank the thousands of subscribers
marketing efforts. to the Presentation Zen blog and to all the blog
Guy Kawasaki, Seth Godin, Daniel Pink, readers who have contacted me over the years
Jim Quirk, and Deryn Verity for their enlight- to share their stories and examples, including
ened advice and content in the early stages of Les Posen in Australia and Olivia Mitchell in
the process. New Zealand.
To Jumpei Matsuoka and all the cool people A very big thank you to Reiko Hiromoto at
at both iStockphoto.com and Pixta for their Kansai Gaidai University for her insights and
tremendous support with the images and the suggestions.
special offers that are included at the back of Although I could not include all the slides
this book. in this book, I want to thank all the people
Designer Mayumi Nakamoto for always being who submitted sample slides, including Jeff
there when I need her. Brenman, Pierre Morsa, Scott B. Schwertly,
The Design Matters Japan and business comm- Dr. Aisyah Saad Abdul Rahim, Marty Neumeier,
unity, including Toru Yamada, Shigeki Yamamoto, Nancy Duarte, Naveen Sinha, Dr. Bonnie
Tom Perry, Darren Saunders, Daniel Rodriguez, Bassler, and Elissa Fink and all the talented
David Baldwin, Nathan Bryan, Jiri Mestecky, guys at Tableau Software.
Doug Schafer, Barry Louie, Michael Bobrove, and And of course my biggest supporter in all of
Keizo Yamada. Thanks to Markuz Wernli Saito for this is my wife Ai, who is always u nderstanding
his beautiful garden photos. To Daniel Kwintner and supportive (and who kept me well fed, too).
and IDA Japan for their contribution. I am blessed indeed to be surrounded by
such great people. Hontoni Arigatou!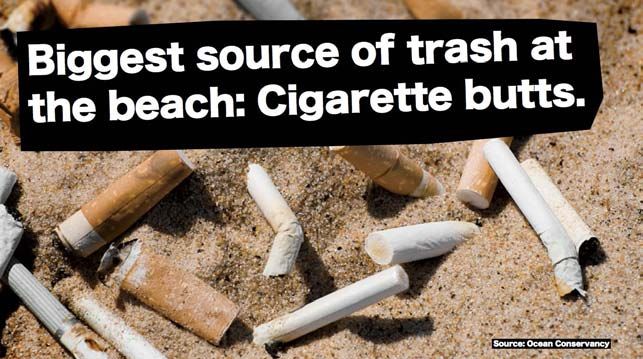

4
Using Images to
Tell Stories
When I was 17, I created my first multimedia presentation. It consisted of
slides for a big project for my high school biology class. The presentation was
on issues related to the effects of pollution on the environment. The slide show
was a visual affirmation of all the natural beauty around us juxtaposed with the
needless manmade destruction to showcase the hypocrisy of human actions.
   I created this presentation before the dawn of the digital age, when personal
computers were not yet used in schools. So, when I say slides I mean real
slides: 35mm transparencies that loaded into a round slide projector called
a carousel. The presentation used two carousels working in sync to achieve
the effect of a smooth cross-dissolve transition between slides. I added a
prerecorded sound track and synchronized the music and images with the
transitions on a single screen. It was simple, beautifully visual, and highly
effective. The resolution of the photographic images was fantastic. It looked
nearly as good as anything created today—but it was a ton of work and the
presentation could not really be shared unless I lugged around a bunch of
equipment with my teacher’s help.
   This was about eight years before Microsoft released PowerPoint, so I had
no examples of how to create and deliver a multimedia presentation. Instead,
I tried to glean visual storytelling and reporting techniques from network
news programs and documentary films. The idea of using bullet points and
long lines of text never occurred to me. The slides, after all, were to be a
visual complement to the narrative. The slides were meant to illustrate, show
evidence, and evoke emotions. I told the story.

                                                 Chapter 4 Using Images to Tell Stories   93
Instead of titles and bullet points, my instructor talked about research,
evidence, structure, and story—about having a point that moves people from
point A to point B. The photographic slides produced by my 35mm camera
were the only visuals I was allowed to use for the assignment.
Because film was expensive—and I had to wait two weeks for the slides to
return from the lab—I thought carefully about the story I wanted to tell and the
types of images I needed to support my argument, make my case, and tell my
story. Only after I did my research and completed the plan on paper, did I set
out with my camera to find evidence of the problem, taking pictures of what
society had to lose (the beauty) and evidence of the threats to it (the pollution).
Long before I ever heard of concepts such as the cognitive load theory or the
dual channels of cognition, like most students, I knew intuitively and through
experience that quality images plus narration was better than narration plus a
lot of text onscreen, even though I was years away from experiencing “death
by PowerPoint.”
These slides are from an updated version of that first multimedia presentation I did back in high
school. I used the lyrics from a Tower of Power song called “Can’t Stand to See the Slaughter”
to introduce the theme of the talk. (Images in slides from iStockphoto.com.)
94 Presentation Zen DesignThe Visual Matters
Traditional literacy is important, of course, but today multimedia literacy—text,
audio, and images, including video—is just as important for learning, teaching,
and communicating both complex and simple ideas. Some might consider it
even more important. Multimedia is immediate and rich, and it enables us
to amplify and clarify the meaning of content in ways text or narration alone
cannot. The language of the 21st century includes images like never before.
The legendary Will Eisner writes in his book Graphic Storytelling and Visual
Narrative (W.W. Norton & Co., 2008): “The proliferation of the use of images
as a communicant was propelled by the growth of technology that required less
in text-reading skills...visual literacy has entered the panoply of skills required
for communication in this century.”
High-quality images make it possible for us to become true digital storytellers.
The late Dana Atchley, the father of the digital storytelling movement, coined the
term digital storytelling and according to him, “...digital storytelling combines the
best of two worlds: the ‘new world’ of digitized video, photography, and art, and
the ‘old world’ of telling stories. This means the ‘old world’ of PowerPoint slides
filled with bullet point statements will be replaced by a new world of examples
via stories, accompanied by evocative images and sounds.”
Atchley was right. While there are still too many uninspiring presentations
that use a strict bulleted format or are overly cluttered, more and more people
are getting the message about the need to become better storytellers. They are
starting to understand the profound power the effective use of multimedia has
for helping us tell better stories.
Storytelling is a shared experience between speaker and listener. Images can
help make that experience more powerful because they help us connect better
with our audience. In the book Going Visual (Wiley, 2005), authors Alexis
Gerard and Bob Goldstein have this to say about using images:
…images have a unique power not just to convey information, but also
to build unity and consensus around that information to promote action
and decision making.... Because images are complete and detailed and
deliver an information experience that has greater impact than words,
a common base of visual information proves to be the most efficient
form of shared experience from which to make decisions.
Chapter 4 Using Images to Tell Stories 95Gerard and Goldstein explain that the evolution of visual communication
technology consists of three main elements:
• Skill level—technology has made visual communication easier to produce.
• Time requirements—creating and using images takes less time today.
• Audience reach—technology now allows us to communicate with more
people visually.
In one of my past presentations I showed the evolution of visual
communication as explained in Going Visual. To do this, I created these
simple slides that were very effective at instantly showing that we have
indeed come a long way in the evolution of visual communication.
Slides adapted from Going Visual by
Gerard and Goldstein. (Images in slides
from iStockphoto.com.)
96 Presentation Zen DesignWe Are Visual Beings
Vision is our most powerful sense. Therefore, designing messages that include
images is a highly effective way to get people’s attention and help them
understand and remember your content. Most live slideware presentations
today still contain a lot of text. However, according to Dr. John Medina, author
of the best-selling Brain Rules: 12 Principles for Surviving and Thriving at Work,
Home, and School (Pear Press, 2008), this is inefficient because our brains
are not as good at identifying letters and words as identifying and remembering
pictures. Says Medina, “Professionals everywhere need to know about the
incredible inefficiency of text-based information and the incredible effects
of images.” Dr. Medina says that all professionals should “burn their current
PowerPoint presentations” and instead create slides that take advantage of our
incredible ability to understand images. Each presentation case is different;
however, evidence shows that we should strongly consider the use of images in
the design of presentation visuals.
Slides adapted from Brain Rules by Dr. John Medina.
(Images in slides from iStockphoto.com.)
Chapter 4 Using Images to Tell Stories 97Power of the Photograph
I love still images because the photograph captures a moment in time, allowing
the viewer to slow down and think and wonder and reflect. Many filmmakers—
especially documentary filmmakers—use still photos as a complement to
motion pictures or video. Photos allow for greater emphasis and may have less
distracting elements, giving the presenter or narrator/filmmaker more freedom
to augment the photo for a desired effect. Still images also allow the viewer
time to interpret their own meaning from the image. We can learn a lot from
documentary film, especially from the kind created by Ken Burns, whose films
rely heavily on still images.
One tip is to avoid the usage of imagery only as ornamentation. What you see
in a Ken Burns film is a simple and powerful use of photos and other imagery
that support the narrative and illuminate the story on a visceral level, thereby
making the experience richer and more memorable. When we hear a story that
is amplified by compelling photography, the issue in the story becomes less
of an abstraction. The issue becomes more concrete and emotional. The next
time you give a presentation about an important but complex topic—especially
a social issue—see if you can illuminate the general topic by focusing on a
particular story. This is a technique that storytellers, such as filmmakers, often
use. Powerful images plus thoughtful narration—and maybe even a bit of
text—can help you tell your story in ways that bullet points never can.
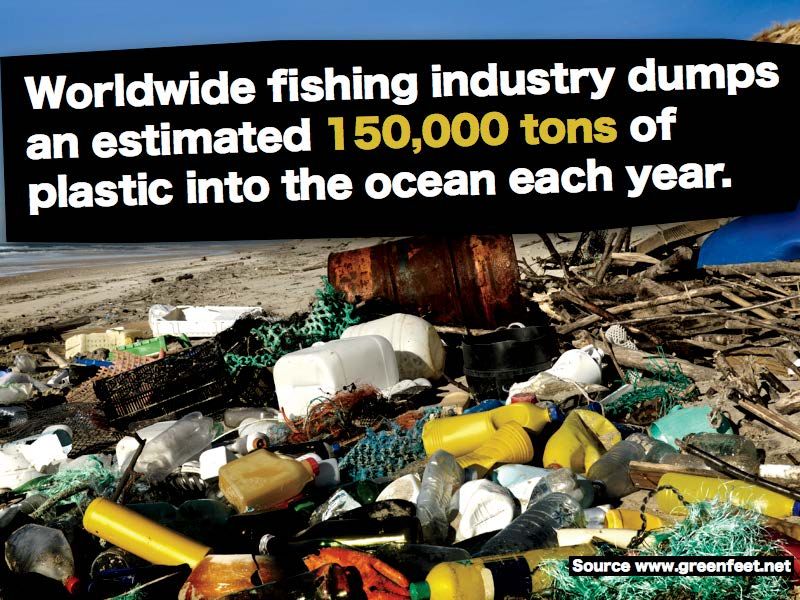
98 Presentation Zen DesignThe use of large images in these slides make an especially powerful impact.
(Images in slides from iStockphoto.com.)
Chapter 4 Using Images to Tell Stories 99Full-bleed images offer ultimate impact
Margins around an image give it a sort of protective frame. When you compare
two or more images on slides, margins are necessary to clearly differentiate
among the images. Generally, however, people use images that are too small,
making it hard for audiences to see the content, thereby reducing the impact
of the photo.
When it makes sense to do so, I suggest you bleed images off the edge
of the slide frame. That is, fill the entire slide area with the image. (Bleed is
actually a term that comes from the printing world. In a book like this one,
when you want to fill an entire page with an image, you must use an image
that is just a tiny bit larger than the area of the page. In other words, you bleed
the image off the page to make sure none of the underlying paper color shows
through the trimmed page, which would destroy the effect.) With slides, all
you need is an image that is exactly the same size as the slide. If your slides
are 1024 x 768 pixels, for example, then the dimensions of the image need to
be at least this large to fill the screen. A full-bleed or full-screen image gives
the illusion that the slide is bigger than it is. This is especially true if part of
the subject in your image runs off the screen. For example, a burger shop may
make a poster featuring a picture of their “Enormo Burger,” but with part of
the burger bleeding off the edge to suggest that it’s so big it can’t fit within
the frame. This makes the image more compelling and it draws the viewer in.
The image in this slide bleeds off the edges, Here is an example of a smaller image
making the slide feel bigger. (Image in slides producing less impact. Which slide better
from iStockphoto.com.) reflects the idea of an enormous burger?
100 Presentation Zen Designtellers, such a
Here, the image is framed against the background Using a white background creates more of a formal
slide template. The background is a distration. border, which emphasizes the photo.
This is a partial bleed. The photo makes a bigger I prefer a white partial border as it seems more
impression, yet still has a border at the bottom. harmonious with this image and more professional.
With a full-bleed (or full-screen) image, the background slide is gone. Now the image becomes the background
and the type becomes part of the image, creating a more dynamic, engaging visual that is easily seen from
the back of the room.
Chapter 4 Using Images to Tell Stories 101tellers, such a
Here, the image is rather small and the background The image is at least larger, as is the text, but it is
template from the slideware is “noisy” due to all still not a very clean slide.
the gridlines.
This is not bad. The template is gone and the image Here, the image is even larger, filling the whole
has a frame, which makes it seem like a snapshot screen from left to right, and the text looks good. The
from the station. The text is easy to see. highlight color (green) is taken from the train.
Now the image takes up the entire screen for a more dynamic effect. The type is easy to see in both cases, but a
black box is added to the version on the right for even better legibility.
102 Presentation Zen DesignBEFORE
This is an example of taking a busy slide and breaking it up
over several slides (in this case, four slides). The slide on the
left repeats many of the things the presenter will share with
the audience before he describes the efficient rail system
that moves an incredible amount of people all around the
city each day. But instead of using loads of text on a slide,
he uses large dynamic visuals in harmony with the flow of his
narrative. There are now four slides. First he explains what is
meant by “Greater Tokyo.” Then he takes the audience onto
the train platform to give them a feel for the crowds. The slide
than fades to a blurry version of the same photo so that the
text—his key point— can be seen easily. The last side appears
as he emphasizes just how large a number 40 million is by
comparing it to the population of New Zealand.
AFTER
(Images in slides from iStockphoto.com.)
Chapter 4 Using Images to Tell Stories 103BEFORE AFTER The slides in the left column are the originals. Note how the message in each slide has greater impact when the image fills the slide (right column). (Images in slides from iStockphoto.com.) 104 Presentation Zen Design
The ideal resolution for projection
As a general rule, use images that are 72 ppi to 100 ppi with dimensions that
are the same or very close to the slide dimensions. For example, 800 x 600
or 1024 x 768 when you want to use an image that fills your entire slide (a
slide with an aspect ratio of 4:3). For slides with a more cinematic aspect ratio
of 16:9—an aspect ratio increasingly common at large events such as TED
or professional conferences—photos may need to be at least 1280 x 720, a
popular resolution for a 16:9 screen.

                                                             Flickr offers millions of
                                                             searchable images with a
                                                             Creative Commons license.
                                                             When you find an image you
                                                             like, right-click (Control-click)
                                                             the image to see all the sizes
                                                             available for that image. In
                                                             the example on the left (one
                                                             of my snaps from Sydney),
                                                             the largest size in this case
                                                             is 1200 x 768. My slide
                                                             dimensions are 1024 x 768,
                                                             so this image will work fine.
                                                             Once in slideware (below left)
                                                             you can see that the image is
                                                             a bit wider than the slide, but
                                                             I can simply move the image
                                                             to the left to get the framing
                                                             I want. Simple.

                                                 Chapter 4 Using Images to Tell Stories          105
Improve images through cropping
Cropping is a technique for reframing or adjusting the composition of an
original photograph. Of course, it’s always better to take the perfect shot
or purchase the perfect image, but that does not always happen. Cropping
changes the image to better suit your needs. For example, you may have
images of interesting subjects, but the composition is not what you had hoped.
I have loads of holiday snapshots that are not that great, but can be improved
with a bit of cropping.
I took this shot of Bondi Beach in Australia a few years ago using a simple
digital point-and-shoot camera. The original resolution was 300 ppi, measuring
2816 x 2112 pixels. The size of the file was 4.2 MB. For images that will
be placed in slideware, a resolution of 72 ppi or 96 ppi is usually fine. So I
first reduced the resolution to 72 ppi, which decreased the file size to 1.9
MB. Next, I decreased the dimensions of the slide to something closer to
1024 x 768, the size of my slides, using basic photo-editing software. Because
I started with such a large image, however, I can go inside the photograph
and frame it in a way that is a little more interesting and specific. Using the
cropping tool, I selected an area of the photograph that shows only the surfer,
leaving plenty of empty space in case I want to place text inside the image.
Now, the image measures just a bit over 1024 x 768 and the JPEG file size is
about 300 KB. I could reduce the file size further through more compression,
but this would decrease the quality of the image.
106 Presentation Zen DesignThe large image is the original snap I took at the beach. The image below is the cropped version of
the image, which is now the same size as the slide on the right (1024 x 768 at 72 ppi).
Chapter 4 Using Images to Tell Stories 107Basic image file types
Of the many different image file formats, you really only need to be familiar
with a few:
• JPEG. The most common image file format you will work with is JPEG
(.jpg). JPEG stands for Joint Photographic Experts Group, but you do not
need to remember that part. Just remember that JPEGs (jay-pegs) use
“lossy” compression, which means that a bit of image quality is lost during
compression. Usually, the loss in picture quality is only noticeable when
you are using a high level of compression. JPEG is the preferred format for
photographs used on Web pages. Small JPEGs may look great on a Web
site, but they usually look horrible if you significantly increase the image
size for a slide. When you’re selecting large images for slides, make sure
the size and resolution of the original image will work. JPEG compression
does a good job with photographs, especially when you have lots of colors
blending into each other, soft shadows, and so on.
• PNG. PNG, which stands for Portable Network Graphics, features lossless
compression. While I most often use JPEGs for onscreen presentations
in slideware, I do occasionally use the PNG (.png) format to achieve a
transparency effect, such as those shown below.
The images in these slides are PNG files. I created the gradient transparency effect in
Photoshop. The PNG and TIFF formats support these kinds of transparency effects. (Images
in slides from iStockphoto.com.)
108 Presentation Zen Design• TIFF. If you need to print images, I recommend the TIFF format (.tif), which
stands for Tagged Image File Format. Use TIFF files for printing images in
CMYK. (TIFF files can include an alpha channel for transparency effects
and can work in slideware, but the TIFF files are much larger than PNG
files.) TIFF files can be compressed without losing picture quality; however,
compared to JPEGs, TIFF files can be much larger. Larger file sizes will not
usually create problems, especially with newer computers, but there is no
reason to create unnecessarily large files. On older computers, larger image
files can slow things down a bit.
• GIF. GIF, which stands for Graphics Interchange Format, is a file format
used mainly for the Web. The GIF format may be appropriate for line art
with very sharp edges and large areas of the same color. GIF reduces the
colors in an image down to 256, so it is not good for photographs.
• EPS. EPS stands for Encapsulated PostScript. You may run into the EPS
format when you purchase line art or vector graphics or create your own
line drawings in an application such as Adobe Illustrator. An EPS file can
hold photographic information as well, but you are most likely to see this
format used for vector graphics. The advantage of vector graphics is that
you can greatly increase the image scale without decreasing the image
quality. To illustrate this, I took a vector graphic from iStockphoto and
converted a copy of it to a small bitmap (JPEG) image. When I scale up the
bitmap image, you see the quality is reduced as the pixels get larger. The
vector image, however, looks great scaled because it uses mathematical
formulas to make sure all the points on the paths maintain their original
relationships. The EPS format is good for drawings, but for photographs
you’ll stick primarily with good-quality JPEG files.
In this slide, the image on the left is a small
JPEG that I stretched, resulting in some horrible
pixelation. The vector version of the image on
the right stays crisp at any size.
Chapter 4 Using Images to Tell Stories 109John McWade
Designer, author, world’s first desktop publisher
www.bamagazine.com
John McWade is the founder and creative director of Before & After
magazine and the author of numerous books on graphic design. His latest
book is Before & After: How to Design Cool Stuff (Peachpit Press, 2010).
Picture your presentation
Better than charts and bullet points, photographs give your audience an emotional
connection to your words. As presenters, we love data! Fifty-two base hits, 23 aban
doned children, Class 3 hurricanes. We track data, we analyze it, we graph it—and
we cheerfully present it to snoozing audiences everywhere. What’s funny is that data
alone has no v alue. Only in the context of real life does it have meaning. And real life is
conveyed best not with data but with story.
To tell a story, you need the help of p hotos. Photos communicate on many channels.
They wordlessly draw the audience into your world, make emotional connections, and
prepare your listeners for what you have to say.
Meaningful Difference
The strongest, most well-positioned
brands have a distinct Meaningful Difference that
is clearly communicated to the consumer in many
different ways:
- Maytag: Dependability
- Michelin: Safety
- Disney: Wholesome family entertainment
- Nordstrom’s: Better shopping experience
- Jack Daniel’s: Badge of American masculinity
What makes you different?
It’s easy to find generically happy images, but the unseen sadness The top slide consists of only a fancy
that everyone bears will rattle each audience member’s soul. When list of notes. The bottom slide with the
pitching a program like the proposed shelter above, think first not in orange inside the apple is surprising
terms of dollars or “social units” or other statistical data but about and familiar at the same time. The
who you’re helping and why—then find an image to express it. simple question—not a statement—
gets the audience thinking and ready
for what you’ll say next.
110 Presentation Zen DesignYou are the show
The first thing to understand is that you are the show; your audience has come to hear you,
not read slides. Use a slide to fill the listener’s mind with an image, then fill in the details
orally. It’s fun!
BEFORE After
Trax, Inc. acquisition
by Thompson Group
Trax at a glance:
• $2.3 million annual revenue
• Operations in three countries
• 40 non-redundant clients
• Mature corporate structure
This slide, which is basically the presentation notes, is Use a metaphorical image. Many topics don’t have literal
visually useless. The information is fine, but it should imagery that can be photographed. In these cases, you
come from you, where it can be accompanied by your might try using visual metaphors. Think of your talk as
personality, body language, and nuance. The correct use having chapters, and use an image to introduce each one.
of a slide is to make a visual statement that words alone The image provides a visual “hook” for the audience, who
can’t make. will relate everything you say back to the image.
Although it has no photo, this is a good slide because the …which is what a carefully selected image will have your
chart is simple and clearly shows a trend. But oy vey! It’s audience doing. They’ll remember this picture long after
been a terrible year! It started bad and got worse, and, they’ve forgotten your charts, and because it’s funny, you’ll
well, it’s now so bad that the only thing to do is laugh… have their sympathy if not their help in solving your problems.
Chapter 4 Using Images to Tell Stories 111One thought at a time
Make one point per slide, even if you have room for more. This gives the viewer room to
think and to “own” what you’re saying, which are keys to good communication.
BEFORE
Planes, trains, buses, taxis,
589,000; 377,800; 320,900;
218,600—quick! got all that?
It’s useful information, but who
will be moved by it, much less
remember it? Put the data on four
slides, one topic per slide, each
accompanied by a descriptive,
full-screen photo. This gives your
viewer room to think and to own
what you’re saying.
After
589,000 377,800
PASSENGERS PER WEEK PASSENGERS PER WEEK
320,900
PASSENGERS PER WEEK
218,600
PASSENGERS PER WEEK
112 Presentation Zen DesignSearch using iStockphoto’s CopySpace™
How does one find good photos? The artistic part is up to you, but iStockphoto’s
Search with CopySpace function can help with composition. Enter a keyword, specify
what part of the photo you want to leave space for words, and click.
First, create a free account
to use iStockphoto, then:
1. Click Advanced Search.
2. In Search with CopySpace,
click grid squares to specify
areas of the photo to remain
blank (clicked squares turn
green).
3. Enter a keyword such
as “face” and watch what
happens.
It’s cool.
Chapter 4 Using Images to Tell Stories 113Common Image Mistakes
With the ubiquity of digital cameras and smartphones, and the plethora of
photo Web sites, more people than ever are using images in presentations.
That’s good, but unfortunately, people often make the same mistakes with
their images when using them in a slide presentation. We’ll look at a few here.
Top things to avoid when using images
Let’s imagine you are preparing a presentation for a large audience on current
issues in Japanese education. One issue facing schools and universities in
Japan today is the decreasing number of potential students. The source of the
problem is low fertility rates, resulting in fewer children being born. So our
sample slide touches on the low fertility rate in Japan in this context. For an
effective slide, you could use either a full-bleed image like the one below of
the two elementary students walking, or a smaller photograph of a school yard
in Japan. We’ll use the photo of the two kids walking to school as a starting
point and then discuss the ten common mistakes to avoid.
Either of these two slides could work. Notice how the use of the images in these slides sharply
contrasts with their use in the examples that follow. (Images in slides from iStockphoto.com.)
1. Image dimensions are
too small
You do not have to do a full bleed with
an image, but this particular image
does not work at such a small size.
(The slide is 800 x 600 while this
image is 373 x 176.)
114 Presentation Zen Design2. Image is placed randomly on the slide
The image is large enough to be seen easily,
but it’s placed willy-nilly on the slide. Usually,
this causes the text to be lost in the background
(although in this case the text is still legible) and
the image placement appears accidental.
3. Image is almost full screen—but
not quite
Nothing should look accidental. This looks like
the presenter was going for a full bleed but just
missed. Now, the slide’s background template
can be seen just enough to become a bit of
noise. Make sure that your full-bleed images are
indeed full bleed (that is, they fill 100 percent
of the screen).
4. Image is pixelated due to low resolution
This happens when you take a low-resolution
image (such as a JPEG from a Web site) and
stretch it out. Oh, the humanity! Make sure
you use an image that is large enough for
your purposes.
5. Using several small images in one slide
It’s better for your audience if you use one (or
perhaps two) large images rather than several
small images. In most cases you get more impact
and clarity from one clear, large image. (On
your computer screen the images may look big
enough, but that’s because your nose is about
18 inches from the screen.) Using several images
may introduce noise as well.
Chapter 4 Using Images to Tell Stories 1156. Image is pixelated and has a
watermark
Even worse than using a pixelated
image is taking a free preview from
a photo Web site and stretching it
out. This introduces distracting visual
noise and communicates that you are
cheap, lazy, or both. If you cannot
afford images or do not have a camera
or other image source, then it’s better
to use no images at all.
7. Image is distorted
Horizontal or vertical image stretching is all too common. This distortion occurs
when people stretch an image to make it fit the dimensions of a slide without
making sure the proportions stays constant. The image becomes a distraction
and looks odd. (Are young Japanese students really 8 feet tall, or so wide?)
8. Use of the tile feature
Just because the software lets you tile
an image, does not mean you should.
Now the background image has too
much going on (even if it did not have
watermarks).
116 Presentation Zen Design9. Use of clip art
Avoid off-the-shelf clip art. Your own
sketches and drawings can be a
refreshing change if used consistently
throughout the visuals, but generic
clip art is so last century.
10. Image is a cliché or unrelated
to the content
What do two businessmen shaking
hands have to do with the fertility
rate in Japan? Nothing. Yet even if
the presentation is about a business
partnership, the image is still a cliché.
11. The background image has too much going on
and the text is hard to see
Sometimes, the image is actually pretty good, but it needs a little work to get the
text to pop out more. The slide below on the left is not horrible, but the balance
is off and the text is a little difficult to read. For the slide on the right, the image
is cropped for better balance, giving more space for the text to breathe. In
addition, the text is now in a transparent box so it pops out a bit more.
Chapter 4 Using Images to Tell Stories 117You don’t take a photograph, you make it. — Ansel Adams
Making Your Own Images
You can purchase images or obtain them legally from various sources, but
it’s likely that you have your own camera as well. If you’re working on a
professional-level presentation, you may want to purchase good shots or
hire a photographer. In many cases, however, you will be able to use your
own photographs.
   You may not be the world’s greatest photographer, but that’s OK. You can
learn to get better. One of the keys to good shots—like design itself—is to keep
things simple. Scott Kelby is a leading authority on digital photography and
he says that clutter and distraction are the things that most often kill properly
exposed shots.

    Look for simplicity in your backgrounds, in your people shots, in your
    architectural elements, in every aspect—the simpler the surroundings,
    the more powerful the impact.... Look for the absence of distraction.
    Look for the absence of clutter and noise, watch for distracting
    elements that sneak into the top and sides of your frame, and create
    some photos that have great impact—not because of what they have,
    but because of what they don’t have—lots of junk.

                                                — Scott Kelby

On the next four pages, photographer Scott Kelby offers valuable tips for taking
better photos.

                                                 Chapter 4 Using Images to Tell Stories   119
Scott Kelby
Photographer and editor-in-chief of both Photoshop User and Layers magazines,
and president of the National Association of Photoshop Professionals (NAPP)
www.scottkelby.com
Scott Kelby is the world’s No. 1 best-selling author of computer and technology books,
and is the author of the all-time best-selling book on digital photography: The Digital
Photography Book, Volume 1 (Peachpit Press, 2006). Here Scott gives simple tips for
taking better photos.
10 tricks for getting better-looking photos
A lot of people have been going through a very In the example you see below, on the left our
frustrating experience with their digital cameras. subject is standing in direct sunlight. On the
They started with a small 3 or 4 megapixel right, I had her move under a tree about 30 feet
point-and-shoot compact camera, and they were away. That’s the only thing that I did differently,
disappointed with the images they were getting. and look at the results.
So they went out and bought a newer point-and-
shoot, or a more expensive Digital SLR camera
(with interchangeable lenses) that’s 10 or 12
megapixels and now they’re disappointed with
their larger-size images. The problem is, it’s not
about the camera. They both take pictures of
whatever you aim them at.
However, the fact that it’s “not about the
camera” is good news for all of us, because
that means that no matter which camera you
own, you can learn to take better-looking photos
now, today—and here. I’ve included some of
my favorite tips for doing just that. 2. Where to put your subject in the photo
When we first started taking photos of people,
1. Getting better portraits outside at some point somebody told us to make sure
Direct sunlight creates really harsh shadows— that our subject is in the center of the photo.
it’s about the most unflattering light you can That’s how your average person takes a “people
shoot someone in (only photograph people you photo,” which is one reason why these photos
don’t like in direct sunlight). So, how do you look so average. If you look at photos taken by
get around this? Have your subject step into the professional photographers, you’ll notice they
shade. Under a tree, under an overhang, or any usually place the person on the left or right
place where they’re in complete shade (with no side of the photo, rather than in the center.
dapples of light coming through the branches This adds interest and energy to the photo,
of the tree). The difference is pretty staggering. and focuses your attention right on the subject
120 Presentation Zen Design(try this next time you’re shooting a portrait— 5. Better shots with your pop-up flash
you’ll be amazed at what a difference this one That flash on top of your camera is really harsh.
little thing makes). In fact, it may be the only light more harsh than
direct sunlight, but there is something you can
3. The secret to shooting in low light do to make it much more flattering. A company
If you’re shooting in a church, or at night, or called LumiQuest (www.lumiquest.com) makes
even at dawn or dusk, you’re going to get blurry a small diffuser called a Soft Screen that fits
photos. That’s because the shutter needs over your camera’s pop-up flash to soften
to stay open longer to let more light in, and and diffuse the light. The results you get are
even the tiniest little movement on your part dramatically better—and your pictures are
guarantees a blurry photo. The way around much more flattering to the subjects.
this is to put your camera on a tripod, which
simply holds your camera steady. You don’t 6. Don’t make this mistake when
have to buy an expensive one; my most famous shooting portraits
photo was taken with a $14 tripod I bought at One of the biggest mistakes people make when
Walmart when I forget my regular tripod while taking portraits is that they leave too much
on vacation. room above the subject’s head. Ideally, your
subject’s eyes would be in the top third of the
4. The trick to getting great color photo, and your
If you look at your photos, and they all look subject would pretty
too blue, or too green, or too yellow, you’re much fill the frame.
not alone. It’s a common problem with digital Also, it’s OK to crop
cameras, but it’s so easy to fix. All you have off the top of your
to do is change your camera’s White Balance subject’s head a bit
setting for the light (just look at the ads
you’re shooting in any magazine),
in. For example, but never chop off his or her chin. Also, the
if you’re shooting most important thing to have in focus is your
in the shade, subject’s eyes, so make sure your focus point is
everything’s going on the eyes (this goes for shooting wildlife, too).
to have a blue tint
to it. But if you 7. Golden rule of landscape
change the White Balance setting to Shade it photography
changes the color so it looks great. If you’re If you want much better landscape photos, the
shooting indoors, change it to the Indoor setting trick is to shoot your landscape in beautiful
(usually an icon of a light bulb). Shooting in an light, and that light happens twice a day:
office? To keep everybody from looking green, around sunrise and sunset. These are the only
change the White Balance to Fluorescent. If two times professional landscape photographers
you’re outside, you can just leave it set to Auto. will even take landscape photos—that’s how
Make setting the White Balance a part of your big a difference it makes (and that’s why the
shooting routine, and your color will finally look pros call these two times of day “The Golden
great, no matter where you’re shooting. Hours”). Also, these are two times of day when
Chapter 4 Using Images to Tell Stories 121the light will be lower, so you’ll also need to line either at the top third of your photo or the
shoot these shots on a tripod to keep from bottom third. How do you know which one to
having blurry photos. Do these two things, use? If the sky is interesting with lots of clouds,
and you’ll be amazed at the difference in your put the horizon line at the bottom, so you see
photos (and so will your friends). more sky. If you’ve got a boring, cloudless sky,
put the horizon line at the top third, so you see
8. Use your camera’s presets more foreground instead. It’s as simple as that.
If you want average-looking photos, leave your Just remember; there’s a reason they call it
camera set to what your average camera owner “dead” center.
does: Auto mode. But, if you want to take the
quality of your images up a big notch, just turn 10. Change your vantage point
the dial on the top of your camera to match One thing that makes photos look average is
that we all pretty much take our photos from the
same view—standing. If we walk up on a flower,
we shoot down at it from a standing position.
If we’re shooting a photo of our children, we
stand there and shoot down on them. That’s
how we regularly see them, so the photos look
regular. A great trick to make your photos more
interesting is to simply change your angle to
one that isn’t so average. Get down on one knee
to shoot your children at their eye view. Shoot
flowers down low—at their level, so you show a
view most folks don’t see. Shoot down from a
stairway on a street scene. This simple change
what you’re shooting. When you do this, it of perspective gives a fresh, more professional
changes your camera to the optimum settings look to your images.
for what you’re shooting. If you’re shooting
people, switch that dial on top to the little
icon of a person. Simple. If you’re shooting
a landscape, switch it to landscape (the icon
usually looks like mountains). For shooting
something really close up (like a flower), switch
it to the flower icon. You’ll be surprised at what
a difference this makes, yet most people never
spend the two seconds it takes to make this
simple change.
9. Where to put the horizon line
When shooting a landscape, your average
person puts the horizon line right in the center
of the photo, right? Right. But if you don’t want
an average-looking photo, put your horizon
122 Presentation Zen DesignTo create a more interesting composition, put your horizon line either at the top third of your photo
or the bottom third.
Chapter 4 Using Images to Tell Stories 123BEFORE
Here is another example of taking one busy slide with
small, hard-to-see images and breaking it up into
several slides. The examples below serve as a dynamic
backdrop for the presenter as he discusses the great
shift of people in and out of Tokyo. In this case, the
presenter uses four slides, which he advances smoothly
with his narrative, to create a more dynamic and even
cinematic effect.
After
(Images in slides from iStockphoto.com.)
124 Presentation Zen DesignIn Sum • Avoid using imagery only as ornamentation. When we hear a story amplified by compelling photography, the issue becomes less of an abstraction and more concrete. It is emotional and it is memorable. Try to illuminate the general by focusing on the particular in your choice of imagery. • Use full-bleed (full-screen) images for greater impact and try cropping images to create more compelling photographs. • Don’t be afraid to take your own photographs and use them in your presentations. Keep in mind that one of the keys to taking great shots is to “keep it simple,” a lesson you can apply to many aspects of design. • Try taking one busy slide and breaking the information up over several slides to match your narrative flow.
Index
Numbers                                   Brochures, designs of, 263–265             monochromatic schemes, 73
3D effects, charts/graphs, 151, 162       Brown, emotional associations, 80          saturation, 70–71
5 x 4 (five-column/four-row) grids, 227   Built-in textures, charts/graphs, 151      simplicity of type and, 34
10-minute rule, 133                       Busy slides, 124                           simplifying to unify, 222
                                                                                     themes, 86–90
A                                         C                                          using images to pick, 84–85
Achromatic (+1) color themes, 75          Cameras, 119–124                           values, 68–69
Aesthetic principles, 231–233             Case, upper vs. lower, 32–33               warmth or coolness of, 81
Analog scrapbooks, 268                    Caslon typeface, 39–41                     when taking photos, 121
Analogous color relationships, 74         Change                                     of wind, 72
Animated graphics, 173–174                    adding motion for, 216–218          Color vision deficiency (CVD), 78
Apostrophes, use of, 56–57                    art of storytelling, 204–205        Color wheel, 66–67
Art classes, 269                              inspiring, 10                       ColorSchemer Web site, 86
Aspect ratio, 105, 140–143                Charts. see data presentation           COLOURlovers Web site, 86
Asymmetry, 189–190, 209                   Chroma. see saturation                  Column charts, 163
Awareness, personal kaizen, 259           Clarity, of type, 30                    Complementary colors, 74
                                          Cliché, avoiding image, 117             Compression, 108
B                                         Clip-art, avoiding off-the-shelf,       Constraints, embracing, 12
Background                                 116–117                                Context, setting, 52–53
    avoiding tile fixture, 116            Clips, short video, 144                 Continuous improvement
    consistent themes in, 223             Clutter                                    inspiration on street, 266–267
    creating perspective with, 205            art of focal point vs., 208–209        it is up to you, 270
    low salience in, 212                      avoiding in type design, 34            learning from billboards, 260
    simplicity of, 117, 222                   simplicity of wabi sabi vs., 149       lessons around you, 259
    use of color in, 81–83                    simplifying to unify, 222              long-term, 258, 268–270
    video as, 139                             taking better photos, 119              morning commute and, 260
Bar graphs, types of, 162–164             CMYK, printed images in, 109               overview of, 256–257
Baskerville typeface, 39–41               Color                                      package design, 261–262
Beginner, designing as, 14                    achromatic themes, 75                  printed materials, 263–265
Bento, 229                                    analogous relationships, 74         Contrast
Bilingual slides, 51                          blindness, 78                          art of focal point, 208–209
Billboards                                    communicating with, 63                 color, 76–77
    good slide design and, 210, 260           complementary, 74                      establishing dominance, 211
    presentation display and, 31              emotional connection via, 79–83        in nature, 205
    sans serif typeface for, 40               for emphasis, 60, 153                  in storytelling, 204–205
Black, emotional associations, 80             expressing essence with less, 65       for variety and depth, 206
Bleeding images, 100–104                      functional, 76–78                   Cool colors, 81
Blue, emotional associations, 79              GIFs reducing image, 109            CopySpace™, iStockphoto, 113
Bodoni typeface, 39–41                        harmony with, 66–71                 Cropping images, 106–107
Bold, emphasizing text, 60                    hues, 66–67                         Curly quotation marks, 58
Books, reading design, 270                    lessons from sumi-e, 64             CVD (color vision deficiency), 78

                                                                                                   Index   273
guiding eyes, 214–215 Flickr, 105
D
Dark low background salience, 212 Focal point, 208–209, 216–218
gradients from light to, 205 overview of, 210 Fonts. see type
lessons from sumi-e, 64–65 preference for people, 213 Foreground, 81, 207, 212
vs. light background, 82–83 Dichromats, 78 Form and freedom, 19
seeing value, 68–69 Differences, 204–209 Formula, freedom from, 232
Data presentation Digital scrapbooks, 268 Franklin Gothic typeface, 39–41
charts/graphs, 162–165 Distortion, image, 116 Freedom, 19, 232
documents vs. slides, 154–155 Divided bar graphs, 164 Frutiger typeface, 39–41
future of, 172–174 Documents, 154–155 Fukinsei, 231. see also asymmetry
Graph Design IQ Test, 169–171 Dominance, 211 Full-bleed images, 100–104
principles of, 152–153 Dumb apostrophes, 56–57 Functional color, 76–78
signal-to-noise ratio, 150–151 Dumb quotation marks, 58 Futura typeface, 39–41
simplifying, 146–148 Future, of data presentation,
slidedocs, 149, 156–161 E 172–174
Datsuzoku, principle of, 232 Em dash, 59
Delivery, presentation, 54 Emotion G
Demonstrations, video, 134 created by typeface, 38, 44 Gapminder software, 173
Depth, creating, 207 creating with color, 79–83 Garamond typeface, 39–41
Design as design component, 14 Gestalt theory, 193–197, 225
adopting beginner’s mind, 14 power of photos, 98–99, 110 GIF (Graphics Interchange Format)
becoming master storyteller, 15 power of video, 129–132 files, 109
breaking rules of, 17 text placement for, 45 Gill Sans typeface, 39–41
clarifying intention, 16 Empathy, 14 Graph Design IQ Test, 169–171
communication, 15 Emphasis Graphs. see data presentation
definition of, 11 with color, 60 Gray, emotional associations, 80
embracing constraints, 12 in data presentation, 153 Green, emotional associations, 79
empathy, 14 with motion, 216–218 Grids, slidedoc design, 161,
empty space, 17 Empty space, 17, 208–209. see 226–229
focusing on experience, 14 also white space Gulf of Mexico slide samples,
multimedia literacy and, 9 En dash, 59 244–245
obsessing about ideas, 16 EPS (Encapsulated PostScript)
overview of, 12 files, 109 H
practicing restraint, 13 Essence, expressing, 65 Habit, freedom from, 232
presentations and, 10 Examples Handouts, presentation, 54, 155
principles of washoku and, 5–7 of slides. see slide samples “Hanging the punctuation,” 58–59
simplicity, 17 video showing real-life, 134 Hard drives, inserting video,
this book and, 8, 18–21, 22 Experience, focus of design on, 14 135–136
vision and curiosity, 16 Harmony
visual communication and, 9 F checklist, 234
when to stop, 13 Families, font, 42 with color, 65–71
Design priority File formats, image, 108–110 color themes, 86–90
adding motion, 216–218 Filesformat, 108 connecting elements, 225
dominance and structure, 211 Five-column/four-row (5x4) grids, 227 noticing similarities, 223
274 Presentation Zen Designoverview of, 220–221 iStockphoto, CopySpace™, 113 Luminance. see value
principles of, 231–233 Italics, emphasizing text, 60 LumiQuest, 121
simplifying to unify, 222
typefaces for, 42–44 J M
using grid, 226–229 Japanese Ma, principle of, 233
with visual cues, 224 aesthetic principles, 231–233 Monochromatic color schemes, 73
Helvetica, 39–41, 46–47 meal presentation, 5–7, 229 Mood
Hiroshige, 207 umbrella design, 18–21 changing in Kuler, 86
Horizon line, landscape JPEG (Joint Photographic Experts creating with typeface, 38, 44
photography, 122–123 Group) files, 108 text placement and, 45
Horizontal bar charts, 163 Morning commute, 260
How Bacteria Talk, slide samples, K Motion, 216–218
252–253 Kaizen, 258. see also continuous Multimedia literacy, 9
Hue improvement Music, 268
achromatic color schemes, 75 Kanso, 231. see also simplicity
contrast in, 76–77, 206 Kelby, Scott, 119–124 N
identifying, 66–67 Kerning, for readability, 35–36 Naturalness, principle of, 232
with Kuler, 90 Keyboard shortcuts, 56 Nature, 205, 269
monochromatic schemes, 73 Keynote, 135–138 Noise, visual, 150–152
Hyphens, 59 Kuler themes, 87–90 Notan, 64
I L O
Ideas, designing for, 16, 112, 161 Labels, color as, 76–77 Opening of presentation, 52
Identity, color as, 76 Landscape photography, 121–123 Orange, emotional associations, 79
Images Lateral thinking, 231 Orientation, contrast in, 206
color themes from, 86–90 Legends, avoiding pie chart, 162
common mistakes, 98, 114–117 Less is more (yohaku-no-bi), 233 P
complementing with text, 48–50 Letters, spacing type, 35–36 Package design, 261–262, 269
cropping, 106–107 Light People, images of, 213
evolution of going visual, 95–96 adding contrast, 76–77, 205 Perspective, 122, 205
file types, 108–109 dark background vs., 82–83 Photographs
full-bleed, 100–104 seeing value, 68–69 making own images, 119
one thought at a time, 112 sumi-e and, 64–65 picturing your presentation, 110
people, 213 taking better photos, 121–122 power of, 98–99
picking color using, 84–85 Lighting, presentation room, 82 tips for taking better, 120–124
picturing presentation, 110 Line art, formats for, 109 Picture graphs, 166–167
power of photographic, 98–99 Line charts, 151 Pie charts, 162, 164
resolution for projection, 105 Line graphs, 165 Pink, emotional associations, 79
taking better photos, 119–124 Lines, spacing type, 36–37 Pitching presentation, 52
telling stories, 93–94 Literacy, multimedia, 9 Pixelated images, 115–116
we are visual beings, 97 Lossless compression, 108 Placement, image, 115, 120–121
you are the show, 111 Lossy compression, 108 PNG (Portable Network Graphics)
Intention, clarifying, 16 Lowercase, typesetting in, 32–33 files, 30–31
Interviews, video, 134
Index 275Pop-up flash, 121 Rotated type, 45 of sumi-e, 65
Portraits, shooting, 120–121 Rules taking better photos, 119
Position, contrast in, 206 10-minute rule, 133 unity through, 222
PowerPoint freedom of design, 19 of wagasa, 18–21
banning use of, 10 for hyphens/dashes, 59 Size
document waste in, 154 knowing/breaking design, 17 avoiding small images, 114
inserting video, 135–138 rule of thirds, 228–229 contrast in, 206
sketching/planning analog, creating perspective with, 205
248–251 S emphasizing text, 60
Presentation flow, 52 Salience, low background, 212 quotation mark, 58–59
Presentation Zen, 8, 18–21, 23 Sans serif typefaces, 40–41 video onscreen, 140–143
Presets, camera, 122 Saturation, 70–71, 73–74, Sketching/planning analog,
Previewing/prompting, 76–77, 90 248–251
presentations, 54 Scaling, vector images, 109 Skits, video, 134
Prezi, inserting video in, 135–138 Scatter plots, 164 Slide samples
Printed materials, 109, 263–265 Searchable images, 105, 113 Gulf of Mexico, 244–245
Projection, resolution for image, 105 Seijaku (tranquility), 232 How Bacteria Talk, 252–253
Purple, emotional associations, 80 Self-restraint, 13 overview of, 241
Purpose and focus Sequence, slide/topic, 53 sketching/planning analog,
adding motion, 216–218 Serif typefaces, 40–41 248–251
art of focal point, 208–209 Shade Smoke:, 246–247
art of storytelling, 204–205 adding black to adjust, 68 Takehime Pudding, 242–243
context/meaning, 204–207 for better portraits outside, 120 Thirst, 254
creating, 203 complementary colors and, 74 Slidedocs, 157–161
strong design priority, 210–215 for great color, 121 Slideuments, 154–155
variety and depth, 206–207 in monochromatic schemes, 73 Smart quotes, 58–60
on white background, 69 Smoke: The Convenient Truth, slide
Q Shape, contrast in, 206 samples, 246–247
Quotation marks, 58–59 Shibui/shibumi, 232. see also SNR (signal-to-noise ratio),
simplicity 150–151
R Shizen (naturalness), 232 Soft Screen, pop-up flash, 121
Red, emotional associations, 79 Signal-to-noise ratio (SNR), Space. see white space
Reduction, data presentation, 153 150–151 Stacked bar graphs, 163
Resolution Similarities, in harmony, 223 Still images, power of, 98–99
avoiding pixelated images, 115 Simplicity Stone, Maureen C., 76–78
cropping images and, 106–107 avoiding clutter in type, 34 Storytelling
ideal image projection, 105 clarity in, 149 contrast/simplicity in, 204–205
JPEGs and, 108 color for harmony, 66–71 designing as master, 15
resizing video onscreen, for communication, 15 going visual for, 95–96
140–143 data presentation, 152–153 images for. see images
Restraint, 13, 152 form and freedom, 19 Straight quotation marks, 58
Right brain stimulation, 268 overview of, 17 Structure, 211, 226–229
Rockwell typeface, 39–41 in storytelling, 204–205 Sumi-e (Japanese brush painting),
64–66
276 Presentation Zen DesignYou can also read