Individuals with dyslexia use a different visual sampling strategy to read text - Nature
←
→
Page content transcription
If your browser does not render page correctly, please read the page content below
www.nature.com/scientificreports
OPEN Individuals with dyslexia use
a different visual sampling strategy
to read text
Léon Franzen1,2*, Zoey Stark1 & Aaron P. Johnson1,3,4
Individuals with dyslexia present with reading-related deficits including inaccurate and/or less fluent
word recognition and poor decoding abilities. Slow reading speed and worse text comprehension
can occur as secondary consequences of these deficits. Reports of visual symptoms such as atypical
eye movements during reading gave rise to a search for these deficits’ underlying mechanisms. This
study sought to replicate established behavioral deficits in reading and cognitive processing speed
while investigating their underlying mechanisms in more detail by developing a comprehensive
profile of eye movements specific to reading in adult dyslexia. Using a validated standardized reading
assessment, our findings confirm a reading speed deficit among adults with dyslexia. We observed
different eye movements in readers with dyslexia across numerous eye movement metrics including
the duration of a stop (i.e., fixation), the length of jumps (i.e., saccades), and the number of times
a reader’s eyes expressed a jump atypical for reading. We conclude that individuals with dyslexia
visually sample written information in a laborious and more effortful manner that is fundamentally
different from those without dyslexia. Our findings suggest a mix of aberrant cognitive linguistic and
oculomotor processes being present in adults with dyslexia.
Within today’s society, quick and accurate reading skills are essential to participate in societal activities (e.g.,
education, using social media, communication) and to achieve professional success. Reading is a complex task
requiring the eyes, specifically the fovea of the retina, to stop on the written text to successfully encode the
sequence of letters that make up each word, and will eventually be assigned meaning (i.e., semantics) during
decoding and matching with one’s mental lexicon. The stops in eye movements, termed fixations, are an essential
part of r eading1,2 and a prerequisite for adequate decoding of a text’s content including successful word selection
from the mental l exicon3. Each fixation is complemented by a brief jump in eye position, termed a saccade, which
relocates the fovea to the next part of the text to be processed. Saccades are typically 7–9 characters w ide1 and
take 20–30 ms during r eading4. The time available for completing a fixation and its associated linguistic tasks,
and planning the next eye movement (a saccade) is approximately 225–250 ms per s top1,4,5. This duration may
be even shorter due to the preview benefit of text appearing outside of the fovea6,7. These findings underline the
importance of an automatized, rapid interplay of low-level eye movements with higher-level cognitive processing
during reading such as lexical, phonological, and semantic p rocessing1,8,9.
One group that is well-known to struggle with developing proficient and fast reading skills are individuals
with dyslexia. Dyslexia is a language-based, neurobiological specific learning disorder affecting reading, writing,
and spelling10,11, which persists into a dulthood10,12–14. Specifically, struggles with accurate and/or fluent word
recognition and decoding abilities that typically result from deficits in phonological awareness characterize this
disorder10,11. Slow reading and a deficit in reading comprehension can be resulting secondary c onsequences10,11,15.
An estimated 5 to 20% of the population are affected11,12,15,16. Dyslexia’s aetiology remains the subject of a heated
debate with proponents attributing the main underlying cause to deficits in a variety of systems associated with
reading (i.e., phonological awareness, visuo-spatial a ttention17, magnocellular and cerebellar f unction18–21, or a
lack of reading e xperience22,23). While deficits in phonological awareness are considered e stablished24–28, other
deficits in low-level sensory p rocessing29–33 and visual attention remain under scrutiny (e.g.,34).
Frequently, researchers who investigate the reading skills and strategies of children and a dolescents35–37 or
adults38–40 with dyslexia during sentence reading have focused on reading speed as a measure of performance.
These studies report that readers with dyslexia read at a slower rate (i.e., fewer words per minute) compared to
1
Department of Psychology, Concordia University, Montréal, Canada. 2Institute of Neuroscience and Psychology,
University of Glasgow, Glasgow, UK. 3CRIR/Lethbridge-Layton-Mackay Centre de Réadaptation du CIUSSS du
Centre-Ouest-de-l’Île-de-Montréal, Montréal, Canada. 4Réseau de Recherche en Santé de La Vision, Montréal,
Canada. *email: leon.franzen@mail.com
Scientific Reports | (2021) 11:6449 | https://doi.org/10.1038/s41598-021-84945-9 1
Vol.:(0123456789)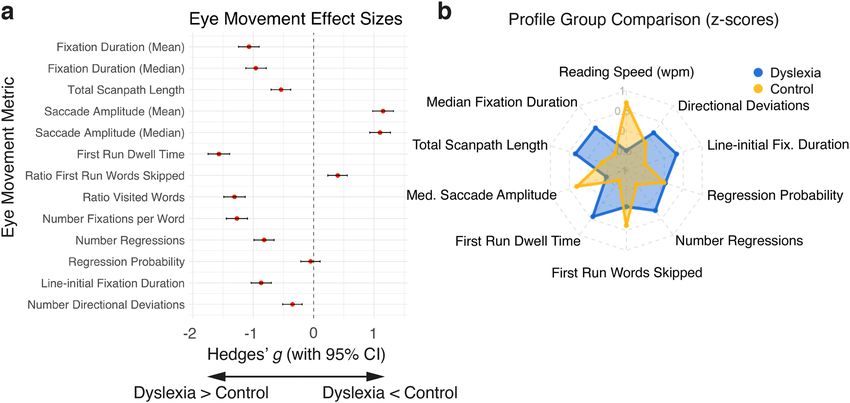
www.nature.com/scientificreports/
readers without dyslexia35,37–40. The difference in reading rates between affected and non-affected adults with
dyslexia can equate to the difference observed in early r eaders39–41. However, reading speed rates neither pro-
vide insight into the cognitive mechanisms nor the visual sampling strategy by which readers with dyslexia may
decode written text differently.
Recent evidence stresses that at least one subtype of dyslexia is affected by differences in visual processing42,
which can be detected within eye movement r ecordings43,44. For example, Nilsson Benfatto and c olleagues43
were able to reliably distinguish between 9–10 year-old children at high- and low-risk of dyslexia using a clas-
sification algorithm operating on one-minute eye movement recordings. Specifically, the duration of fixations,
and the number of fixations, saccades and regressions were found to be the most predictive eye movements for
differentiating between children at high and low risk of persistent reading difficulties. This finding is in line with
previous research showing that readers with dyslexia exhibit longer fixation d urations45–47, an increased number
of fixations47, shorter s accades1,46–48, and fewer skipped w ords3,49,50. Conversely, the probability of revisiting a
previous part of a text (i.e., expressing a regressive saccade also termed regression) has not proven to be reliably
different in d yslexia3,46. It remains unknown, however, if a similar pattern classification is possible for adults with
dyslexia across a range of different texts that are presented in different fonts.
Many advances in dyslexia eye movement research have been made in recent decades. Most of our current
knowledge about differences in eye movements in dyslexia is provided by researchers investigating either a limited
number of eye movement metrics in relation to specific linguistic aspects most often embodied by a target word
(e.g.,51–53), or is limited by the use of a large variety of often controlled but non-standardized linguistic stimuli in
several languages with varying orthographic depth ranging from one character up to one or two s entences54–57.
Hence, a comprehensive profile of the eye movements of adults with dyslexia during naturalistic reading of
standardized texts of multiple sentences remains surprisingly unknown. The development of a comprehensive
profile would allow to uncover and quantify potential inefficiencies in visual sampling of text that have not come
to light using the aforementioned focused, local approach. Therefore, we aim to devise a comprehensive eye
movement account of adult dyslexia by investigating how eye movement patterns of individuals with dyslexia
differ from those without dyslexia on global (text-based) and local (word-based) reading measures during an
ecologically valid silent paragraph reading task in English (Fig. 1a).
Linguistic parameters such as the difficulty of a t ext58,59, its s yntax60,61, word length and word f requency62 can
impact eye movements, highlighting the importance of using standardized and validated stimuli. To this end, we
employed the International Reading Speed Texts ( IReST63). The IReST were developed for standardized reading
speed assessment, and consist of ten independent texts, each of about 150 words using novel content. The texts
have been equated on a global level for their number of words, syntax, sentence complexity and text difficulty,
and were designed to be used in repeated measures within-participant paradigms. Each text was accompanied by
one brief multiple-choice question that intended to keep readers attentive and read for comprehension (Fig. 1c,d).
The IReST and their accompanying questions were recently validated in a Canadian sample of adult readers
attending university64. This validation sample was similar in age and education compared to the present study’s
sample, though, it was exclusively comprised of adults without reading disability. Perceptual parameters such as
the properties of fonts (e.g., spacing) are another aspect that has been shown to affect reading performance52,65–68.
In an attempt to alleviate the reading struggles of dyslexic readers, designers have developed dyslexia-friendly
fonts such as OpenDyslexic69 and Dyslexie70. These fonts omit serifs, increase inter- and intra-word spacing,
and have unique letter strokes. Interestingly, these manipulations have not been found to increase reading
speed36,71,72. To avoid obtaining an eye movement profile biased by font type, we presented half of the texts in
OpenDyslexic (Fig. 1b,c).
Based on previous research (e.g.,13,73), we hypothesize that individuals with dyslexia, compared to an age- and
education-matched control group without dyslexia, will take longer to read each text and show slower visual
processing speed that is in turn linked to one’s reading duration. Reading texts in the dyslexia-friendly font
OpenDyslexic is not expected to result in increased reading speed. In terms of eye movements, we hypothesize
that readers with dyslexia will express more eye movements (i.e., fixations, saccades, and regressions), longer
fixations and shorter saccades. Scanpaths of readers affected by dyslexia are hypothesized to be longer and to
differ in their sequence and duration of eye movement events as a result of increases in reading duration.
Results
In this study, we focused on group-level differences in behavior and eye movements between adults with and
without dyslexia. Behavioral analysis included an investigation of the dependent variables reading duration,
attention to the text and non-linguistic cognitive processing speed as a function of the two experimental groups
(i.e., Dyslexia and Control). Eye movement analyses examined global (i.e., paragraph/trial-based) and local (i.e.,
word/interest area-based) metrics of eye movement events during reading.
Behavioral results. We constructed a generalized linear mixed-effects model (GLMM) for analyzing read-
ing duration as a function of the predictors: group (Dyslexia and Control) and font (Times New Roman and
OpenDyslexic), and their font-by-group interaction on a single-trial level. The predictor font was also included
as a random effect, which was allowed to vary by participant. In addition, the predictors group and font and their
interaction were included as random effects, which were allowed to vary by text. This model was based on 601
experimental trials (i.e., one value for median reading duration per trial) collected from all 67 participants. Text
number five had to be excluded across all participants due to a stimulus presentation issue (67 trials; 10%). Two
further trials from the dyslexia group had to be excluded due to recording issues, which resulted in 601 trials
being included in all analyses (for details, see “Methods”).
Scientific Reports | (2021) 11:6449 | https://doi.org/10.1038/s41598-021-84945-9 2
Vol:.(1234567890)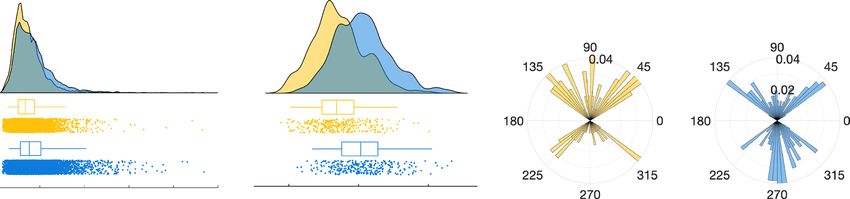
www.nature.com/scientificreports/
Figure 1. Experimental paradigm and example of stimuli. (a) Pictorial depiction of the sequence of events of
one trial. The entire paradigm was participant controlled by pressing the space bar. A drift correction circle (the
circle was smaller than depicted) directed the participant’s eyes to the starting location of the text. While fixating
at it, participants pressed the space bar to get a text to appear that was then read silently once. Immediately after
participants finished reading, they were asked to answer a short multiple-choice attention question relating to
the content of the preceding text without time pressure. This process was repeated ten times. (b) Example of
one text and its corresponding attention question (panel d) displayed in Times New Roman font. Note that this
text was not presented and just constitutes an example comparable to the texts from the commercial reading
assessment (IReST63). The original texts are protected. (c) Example of the same text and its multiple-choice
question displayed in OpenDyslexic font. (d) Example of the multiple-choice attention question accompanying
the texts shown in panels b and c. Attention questions were always presented in the same font than their
preceding text.
Parameter Estimate CI 2.5% CI 97.5% SE t p
Font 1.097 − 0.6593 2.8531 0.896 1.224 0.221
Group − 21.696 − 32.3832 − 11.0091 5.453 − 3.979 < 0.0001
Font * Group − 1.207 − 4.7307 2.3167 1.798 − 0.671 0.502
Table 1. Generalized linear mixed-effects model fixed effect parameter estimates. Model predicting reading
duration. Effects with significant predictive power after post-hoc likelihood-ratio (X2) model comparisons in
bold.
This GLMM demonstrates significant predictive power of the main effect of group on median reading dura-
tion with individuals with dyslexia taking longer to read each text (X2 = 13.431, df = 1, p < 0.001; Fig. 2a,b; see
Table 1 for detailed model statistics). This speed difference is underlined by a lower words per minute reading
rate among readers with dyslexia (MedianDyslexia = 178.09, MedianControl = 248.18; two-sided independent sample
t-test: t(65) = 20.51, p < 0.0001; g = 1.67, 95% CIg = [1.486, 1.858]; Fig. 2a). However, this model yields neither a
significant improvement in reading duration with font (X2 = 1.41, df = 1, p = 0.235) nor a significant font-by-group
interaction (X2 = 0.446, df = 1, p = 0.504).
Secondly, the multiple-choice questions presented immediately after reading each text served as an incentive
for participants to read each text for comprehension—hence, constituting an indicator of attention. Both groups
demonstrate attention to the texts clearly above chance level (control: t(31) = 17.67, p < 0.0001; BF10 = 5.1457 × 10¹⁴;
Scientific Reports | (2021) 11:6449 | https://doi.org/10.1038/s41598-021-84945-9 3
Vol.:(0123456789)
www.nature.com/scientificreports/
Mean (SD) Median (Variance)
Measure Control Dyslexia Control Dyslexia
Age 22.38 (2.7) 23.54 (6.22) 22 (7.27) 21 (38.67)
Diagnosis age NA 12.69 (6.43) NA 10 (41.28)
Adult Dyslexia Checklist 31.31 (3.33) 52.14 (10.55) 31 (11.06) 51 (111.36)
Reading speed (wpm) 254.76 (47.93) 171.32 (38.37) 252.85 (2296.8) 180.91 (1472.1)
Symbol search 10.16 (2.02) 9.91 (2.83) 10 (4.07) 9 (8.02)
Coding 12.84 (2.53) 9.40 (2.27) 12 (6.39) 9 (5.13)
Table 2. Descriptive statistics of group characteristics. Control group (n = 32), dyslexia group (n = 35). Visual
cognitive processing speed measured in standardized scores based on age as assessed by the Symbol Search and
Coding subtests of the WAIS-IV74. A score of 10 equates to the population average on these tests.
Figure 2. Behavioral results. (a) Caterpillar plot of median reading speed (words per minute) per participant
sorted in ascending order. Blue dots represent participants of the dyslexia group whereas yellow dots represent
participants of the control group. (b) Single-trial reading duration in seconds by group. Groups are color-
coded as in (a). (c) Attention to the texts as a measure of reading comprehension. Color notation as in (a). (d)
Cognitive processing speed from the WAIS-IV s cale74 by group. Higher scores illustrate faster processing speed.
The left-hand side (i.e., yellow/light color) of each violin plot depicts scores of the control group; the right-hand
side (i.e., blue/dark color) depicts scores of the dyslexia group. Red crosses denote group means, black squares
group medians. (e) Correlation between reading duration (seconds) and standardized coding processing speed
scores across all participants. The shown correlation coefficient (r) and p-value resulted from a robust bend
correlation analysis (n = 67). Colors indicate down-weighted data points: red for data in X, green for data in Y
and black for data in X and Y dimensions. In each dimension, 20% of the data points were down-weighted. This
figure is best viewed in color.
Min = 66.67%; dyslexia: t(34) = 15.96, p < 0.0001; BF10 = 2.2968 × 10¹⁴; Min = 55.56%; all two-sided paired t-tests;
Fig. 2c). That is, two participants in the dyslexia group scoring at 55.6% and 57.1%, nine participants across both
groups showing performance at 66.7%, and the remaining 56 (out of 67) participants answered more than 75%
of the attention questions correctly, with 31.3% of all participants answering all questions correctly. Crucially,
our data show no significant evidence for a difference between both groups (two-sided independent samples
t-test: t(65) = − 0.34, p = 0.7349; BF10 = 0.2635; Fig. 2c). Altogether, this analysis demonstrates that both groups
paid attention to the reading material, as their performance is better than chance across all trials.
Thirdly, we examined if there were any non-linguistic cognitive processing speed differences between our two
groups using two subcomponents from the Wechsler Adult Intelligence Scale (Coding and Symbol Search74).
This analysis was motivated by previous reports of links between reading speed and slower cognitive process-
ing speed in individuals with dyslexia75. We find that individuals with dyslexia exhibit slower processing speed
on the Coding test (two-sided independent samples t-test: t(65) = 5.88, p < 0.0001; g = 1.422, 95% CIg = [0.895,
1.973]; Table 2; Fig. 2d), but not on the Symbol Search test (independent samples t-test: t(65) = 0.399, p = 0.69;
g = − 0.1, 95% CIg = [− 0.382, 0.577]; Table 2; Fig. 2d). Our data further show a negative correlation between
Scientific Reports | (2021) 11:6449 | https://doi.org/10.1038/s41598-021-84945-9 4
Vol:.(1234567890)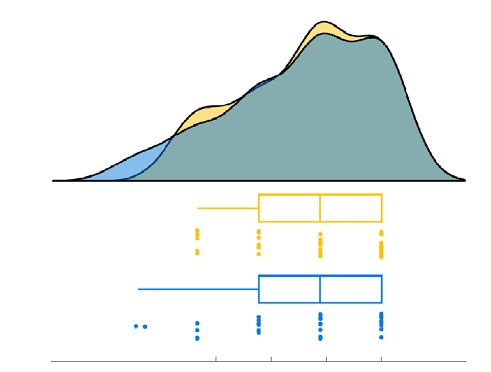
www.nature.com/scientificreports/
coding speed and reading duration across all participants (r65 = − 0.51, p < 0.0001, 95% CIr = [− 0.680, − 0.315];
Fig. 2e) suggesting that, in the present study, participants with better coding ability (i.e., faster number related
cognitive processing speed) exhibit shorter reading duration. Symbol search speed did not correlate with reading
speed across participants (r65 = 0.12, p = 0.33, 95% CIr = [− 0.106, 0.35]). Although these single measures both
probe visual processing speed, their separate interpretation warrants caution, since they may not provide a full
representation of one’s processing capabilities as outlined in their u se76.
These results appear to be the consequence of the control group showing coding speed above the general
population average while the dyslexia group shows performance slightly below the general population average
(Mpopulation = 10, MControl = 12.84, MDyslexia = 9.40; Table 2; Fig. 2d). One reason for these results might be that the
coding task encompasses working memory performance to some degree77. Memorizing digit-symbol pairs only
shown at the top of the page more quickly may constitute a strategy for achieving a higher score on this test.
Hence, although not explicitly testing working memory performance, these results may be indicative of work-
ing memory deficits in adults with dyslexia when compared to a similarly educated non-dyslexia group—in line
with previous reports78–82—and their role in achieving age- and education-appropriate reading speed. However,
we find no general visual processing speed deficit in dyslexia as both the Coding and Symbol Search test need
to be considered in u nison76.
In short, our behavioral results show a sustained level of attention to the stimulus material throughout the
majority of this study by most participants. Though, readers with dyslexia exhibit generally slower reading speed
in line with previous reports. One potential explanation of the observed reading speed deficit might be a differ-
ence in the skills probed by the non-linguistic Coding processing speed test but not a general visual processing
speed difference.
Eye movement profile. This study aims to devise a comprehensive characterization of the eye movement
profile of individuals with dyslexia during natural paragraph reading. This profile comprises eye movement
metrics traditionally examined in the field (Fig. 3), and other more recent metrics such as line-initial fixation
duration, scanpath similarity, and specific saccades atypical for reading (Fig. 4). The reading-related metrics
covered in this study include global (i.e., trial-/text-based) and local (single-word based) metrics. To establish
the significance of a group difference in the frequentist sense, we use unbiased effect sizes83 (i.e., the 95% confi-
dence interval of Hedges’ g not including zero; denoted as g in the text; Fig. 5a). A negative effect size indicates
a longer duration or larger number exhibited by the dyslexia group and vice versa. High collinearity between
some metrics included in our analyses did not allow for the use of a meaningful linear regression approach. In
general, where applicable, we report group means alongside group medians to complement this robust measure
of central tendency and ensure comparability to previous literature.
Traditionally, average fixation duration and saccade length have been investigated on a global trial-level as
indices of cognitive processing effort. In an effort to replicate previous findings, we computed the same metrics
showing that readers with dyslexia stop longer as illustrated by longer mean and median fixation duration
(gMean = − 1.07, 95% CIg = [− 1.244, − 0.902]; gMedian = − 0.96, 95% CIg = [− 1.124, − 0.786]; 83% of readers with
dyslexia show this effect; Figs. 3a and 5a,b), and scan more area of the text as indicated by a longer total scanpath
(g = − 0.54, 95% CIg = [− 0.706, − 0.380]; Figs. 3b and 5a,b). While scanning the text, the dyslexia group exhibits
shorter average saccade amplitude (i.e., eye movement “jumps” between fixations; gMean = 1.15, 95% CIg = [0.978,
1.323]; gMedian = 1.10, 95% CIg = [0.930, 1.273]; 100% of readers with dyslexia show this effect; Figs. 3c and 5a,b),
and increased variance (i.e., standard deviation) in these saccade amplitudes (g = 0.70, 95% CIg = [0.495, 0.823]).
This pattern of results suggests that adults with dyslexia employ a more laborious visual sampling strategy on a
global text-level. Longer fixation durations and shorter saccade amplitudes indicate that this group spends more
time on information uptake and analysis per stop (i.e., fixation), while also potentially taking up less informa-
tion per unit of time. A similar pattern of eye movements has previously been associated with individuals who
are learning to r ead2, and those who are considered poor r eaders56. The observed longer total scanpaths among
readers with dyslexia are a logical consequence of this group’s substantial increase in reading duration.
Global metrics, however, do not provide more detailed information on specific elements of the visual sampling
strategy in relation to single words such as how many of these words get actively fixated and how often. To address
these questions, we complemented the reported global metrics with metrics based on the definition of interest
areas around single words. We find that individuals with dyslexia spent more time (g = − 1.57, 95% CIg = [− 1.75,
− 1.39]; Fig. 3d and First Run Dwell Time in Fig. 5a,b), and skip fewer words (g = 0.40, 95% CIg = [0.235, 0.557];
Fig. 3e and Ratio First Run Words Skipped in Fig. 5a,b) during first pass reading (i.e., the sum of all first fixations
on a word in reading direction excluding any revisits or skipped words). In line, readers with dyslexia fixate on
more words in a given trial when all fixations are examined (g = − 1.312, 95% CIg = [− 1.488, − 1.135]; Ratio Visited
Words in Fig. 5a), and stop more frequently per word on average (g = − 1.27, 95% CIg = [− 1.445, − 1.095]; Number
Fixations per Word in Fig. 5a). Further, revisits of earlier parts of a text (i.e., leftward saccades to a preceding
word formally called regressions) are a substantial and frequent part of natural reading. We observe that read-
ers with dyslexia express more regressions per text (g = − 0.82, 95% CIg = [− 0.989, − 0.656]; Figs. 3f and 5a,b).
However, given the increase in the number of saccades as a result of longer reading durations, this increase in
the number of regressions yields no significant difference in the probability of making a regression across an
entire text (g = − 0.05, 95% CIg = [− 0.213, 0.107]; Fig. 5a,b).
Furthermore, since the control group shows coding processing speed above the population average, we exam-
ined this group’s link between fast coding speed and the traditional eye movement metrics reported above. This
analysis shows no correlation between coding speed and any of the reported eye movement metrics (absolute
range r30 = 0.016–0.32, all ps > 0.05), which suggests that faster coding speed does not systematically affect the eye
Scientific Reports | (2021) 11:6449 | https://doi.org/10.1038/s41598-021-84945-9 5
Vol.:(0123456789)www.nature.com/scientificreports/
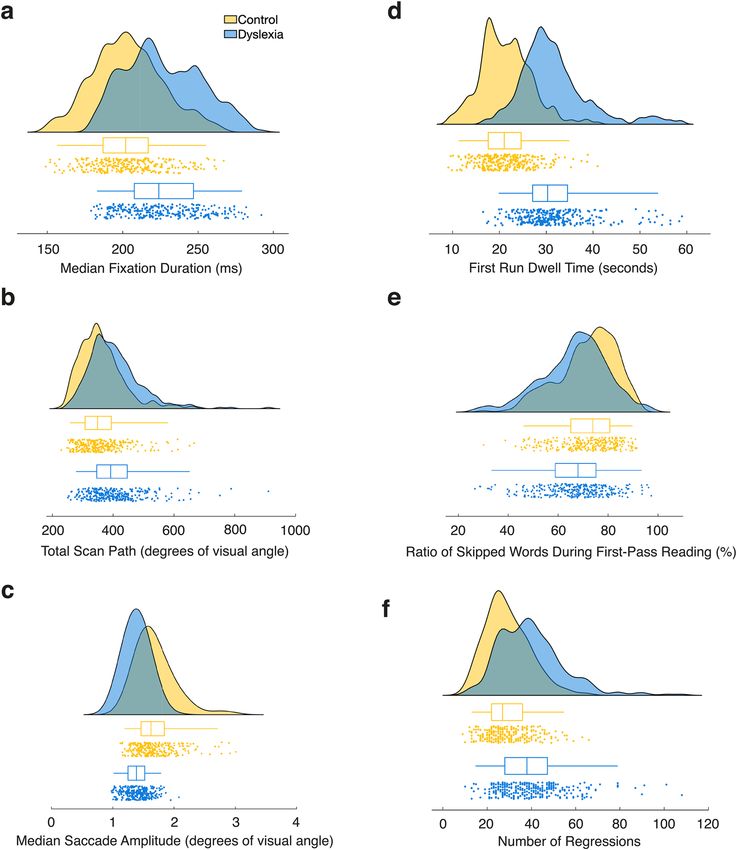
Figure 3. Group comparison of selected traditional eye movement metrics. Plots display trial-based
eye movement metrics that showed significant differences between groups. Each panel depicts the group
comparison collapsed across fonts as a raincloud plot for the respective metric. Kernel density plots depict
the frequency of occurrence of a value while scatterplots display the underlying values as in one average value
per trial. Boxplots indicate the median, upper and lower quartile, and whiskers the 95% CI. Blue (dark) color
represents data of the dyslexia group whereas yellow (bright) color depicts data of the control group. (a) Median
fixation duration in milliseconds. (b) Total scan path in degrees of visual angle. (c) Median saccade amplitude
in degrees of visual angle. (d) First run dwell time in seconds. That is, the sum of all fixation durations during
a first visit to a word if it has not been visited or skipped before. (e) Ratio of words that were skipped during
first-pass reading. This excludes all fixations on a word that occurred after a regression to a previous word was
completed. (f) Number of regressions. That is, leftward saccades to preceding words that have already been
visited or skipped.
movements of readers without dyslexia. We also observe no correlation for the dyslexia group (absolute range
r33 = 0.019–0.14, all ps > 0.05).
Taken together, our results on traditional eye movement metrics corroborate previous findings from investi-
gations with readers affected by dyslexia. They demonstrate that these readers examine a given text more slowly
and in smaller steps, even without accounting for any revisits of previous words (Fig. 5b). Since efficient reading
was found to be characterized by skipping over many words (up to 90%3) during the first rightward scanning
of a text in reading direction (termed, first-pass reading), the observed pattern strongly suggests that inefficien-
cies are introduced by processing less content simultaneously as well as slower information uptake and longer
cognitive processing times of text. Crucially, these findings are based on data obtained from natural reading of
standardized texts consisting of multiple lines.
Scientific Reports | (2021) 11:6449 | https://doi.org/10.1038/s41598-021-84945-9 6
Vol:.(1234567890)www.nature.com/scientificreports/
Figure 4. Contemporary eye movements typical and atypical for reading. (a) Duration of all identified line-
initial fixations by group. That is, the very first “valid” fixation on the first two words of a line not followed by a
leftwards corrective saccade. Boxplots indicate the median, upper and lower quartile, and whiskers the 95% CI.
Blue (dark) color represents data of the dyslexia group whereas yellow (bright) color depicts data of the control
group. (b) Median line-initial fixation duration per trial by group. Color scheme and box plot properties as in
(a). (c) Group comparison of the frequency of directional deviations by angle across all trials depicted as polar
histograms. Saccade angle and frequency are depicted in bins of 2.75° width. Only saccade angles between ± 35°
and ± 145° (displayed as 35/145° and 215/325°) qualified as directional deviations. 0° equals horizontal rightward
direction of reading. All other saccades were excluded from this analysis. d) Example of two scanpaths after
reading the same text (IReST #10) displayed in Times New Roman font. Scanpaths are depicted over time
(y-axis) and word-based interest areas (x-axis). Top scanpath depicts trial by a control participant, whereas the
bottom scanpath depicts a trial expressed by a reader with dyslexia. (e) Pairwise, trial-based similarity matrix
illustrating differences in spatial and temporal fixation patterns upon normalization by reading duration. Higher
scores (darker color) denote higher dissimilarity. Pink square indicates the Scasim dissimilarity score for the
two trials shown in (d). (f) Map of clusters of trials in the spatial domain (using the Euclidean distance metric)
after multidimensional scaling. Red and black colored circles denote trials allocated to separate clusters. Grey
diamonds indicate the centers of these clusters. Trials framed in yellow and blue represent the spatial equivalent
of the same trials whose scanpaths are depicted in panel d. Colors mark groups.
Further contemporary metrics of ocular movements during reading. Recently, additional metrics
have been proposed to differentiate between oculomotor deficiencies and cognitive, linguistic factors underlying
longer fixation times84. Line-initial fixations are one such metric. They constitute the first fixation on one of the
first words of a line that is not followed by a leftwards correction within the same line. Uniquely, line-initial fixa-
tions do not allow the reader early access to a word’s coarse visual orthographic percept due to absent parafoveal
preview. Hence, they have been proposed as an unconfounded indicator of linguistic processing time84,85. By
contrasting groups on the duration of line-initial fixations, we find these to be longer in the dyslexia group on a
single-fixation (g = − 0.33, 95% CIg = [− 0.383, − 0.276]; MedianDyslexia = 231 ms, MedianControl = 202 ms; Fig. 4a),
and single-trial level (g = − 0.81, 95% CIg = [− 0.972, − 0.64]; MedianDyslexia = 256 ms, MedianControl = 216 ms; 89%
of readers with dyslexia show this effect; Figs. 4b and 5b). Parker and colleagues84 reported an effect in the same
direction when comparing accurate line-initial fixation durations between children and adults without dyslexia,
with children showing longer fixation durations. This finding adds to the evidence indicating that readers with
dyslexia take longer to process the visual and linguistic information sampled during a fixation. It further sup-
ports the notion that the visual sampling strategy of readers with dyslexia resembles the strategy of early readers
without dyslexia.
To ensure that we selected line-initial fixations accurately, we compared their duration to the overall median
fixation duration of a trial. Previous research shows that fixation duration decreases as readers move their eyes
Scientific Reports | (2021) 11:6449 | https://doi.org/10.1038/s41598-021-84945-9 7
Vol.:(0123456789)www.nature.com/scientificreports/
Figure 5. Summary of effects and visual sampling strategy group profiles. (a) Effect sizes and their 95%
confidence intervals (CIs) of the effect of group on eye movement metrics. Positive effect sizes (i.e., Hedges’ g)
illustrate a higher number of events, longer duration or distance or a larger ratio among control participants. A
negative effect size illustrates the opposite effect. Red dots denote the effect size and black bars the 95% CI for
each effect size. CIs computed using the exact analytical method as implemented in the measures of effect size
toolbox83. Effect sizes were considered significant if the 95% CI did not include zero. (b) Radar plot depicting
overall group differences in the eye movement and reading profile given selected metrics. Plots depict group
averages after all trials of each measure were normalized (i.e., z-scored) for comparability. Counter-clockwise
direction follows presentation order as in (a). If two variants of the same metric were present in panel a, only
one of them is displayed on the radar plot for simplicity.
towards the end of a line84,86. As expected, the identified line-initial fixations are of longer duration than all fixa-
tions considered together (gDyslexia = 0.87, 95% CIg = [0.673, 1.071]; line-initialDyslexia = 256 ms; AllDyslexia = 224 ms;
gControl = 0.57, 95% CIg = [0.361, 0.768]; line-initialControl = 216 ms, AllControl = 202 ms). We find this increase in
line-initial fixation duration to be larger in the dyslexia group (gGroups = − 0.37, 95% CIg = [− 0.526, − 0.204]; 32
vs 14 ms). The same pattern of eye movement results reported above holds true when analyzing only trials whose
attention questions were answered correctly.
Specific divergence from a regular visual sampling strategy. Besides the presented group differ-
ences on global and local eye movement metrics, we noticed a clear divergence from a regular left-to-right
visual sampling strategy among readers with dyslexia. To quantify these divergences of eye movements that we
consider atypical for reading, we examined saccades with angles that would not be expected during the natural
reading flow (henceforth, directional deviations).
During left-to-right reading of text most saccades will either be expressed in a horizontal rightward direction
in line with the expected reading direction or in mostly horizontal leftward direction as revisits of preceding text
or in an occasional return-sweep saccade to the beginning of the next line. Yet, not all observed saccades would
satisfy any of these typical categories of eye movements, since their expressed angle deviates substantially from
the ones expected as part of the usual reading flow. We examined the number of saccades with an angle that
considerably deviates from the expected pattern of saccade angles during typical reading (i.e., angles between
35° and 145° upwards and − 35° and − 145° downwards from the horizontal reading plane). To avoid that falsely
programmed return-sweeps were mistaken for directional deviations, we excluded a number of saccades that
could be attributed to other eye movements typically involved in reading such as blinks, accurate and inaccu-
rate return-sweeps (for details, see “Methods”). These corrections resulted in 522 saccades being identified as
directional deviations.
Readers with dyslexia express directional deviations more than twice as often per trial on average (g = − 0.48,
95% CIg = [0.316, 0.641]; MeanDyslexia = 1.003, MeanControl = 0.441, varDyslexia = 2.08, varControl = 0.61; 69% of read-
ers with dyslexia show more directional deviations per trial than the control group’s average; Figs. 4c and 5b),
which signals a more frequent loss of place at unexpected points during the reading process. Remarkably, in
the dyslexia group most of the identified directional deviations were directed straight downwards, whereas this
pattern was virtually reversed in readers without dyslexia (Fig. 4c). Since even a brief scanning of the area of
text just below the current fixation seems rather unintuitive from a cognitive perspective, this finding raises the
question whether these directional deviations are the result of occasional issues with oculomotor control previ-
ously reported in dyslexia29,31–33,87–93.
Scientific Reports | (2021) 11:6449 | https://doi.org/10.1038/s41598-021-84945-9 8
Vol:.(1234567890)www.nature.com/scientificreports/
The aforementioned differences in eye movements are part of the overall visual sampling strategy of text dur-
ing reading, termed a scanpath. To investigate whether readers with and without dyslexia differ only on some
eye movement metrics or rather use a divergent overall visual sampling strategy, we complemented the previous
analyses with a computational similarity analysis of the overall scanpath of each trial. To this end, we quantified
the temporal and spatial similarity of the fixations of all scanpaths employing a version of the Scasim analysis94.
The aim of this trial-based analysis was to identify clusters of trials with similar scanpath patterns, while achiev-
ing independence of the observed group differences in reading time. To identify whether trials of readers with
dyslexia were more (dis)similar to those of other readers with dyslexia, we compared the number of trials associ-
ated with each group within a given cluster. Similarity scores and clusters were computed separately for each text
of the IReST battery and font type, as this coordinate-based analysis is highly sensitive to differences in spacing
such as those introduced by text displayed in differently spaced font types (Fig. 1b,c). In this study, trials were
equally split between Times New Roman and OpenDyslexic font types. Additionally, all trials were normalized
by their reading duration to avoid the introduction of trivial differences between scanpaths of different lengths.
Pairwise scanpath similarity scores showed that trials of participants with dyslexia differed from those of
participants without, even though participants read identical texts (Fig. 4d–f). Upon normalizing, trial-by-trial
similarity scores indicated that dyslexic participants spend a substantial amount of the time (between ~ 34 and
83%) looking at different places on the identical paragraph and/or for different durations compared to their non-
dyslexic counterparts (Fig. 4e). These similarity scores were subsequently transferred to the spatial domain (for
details, see “Methods”), where we find that the optimal number of group-independent clusters ranges between
two and five clusters per text-font pair. Trials of each group were predominantly allocated to separate clusters,
and demonstrate a significant difference of association for about 75% of text-font pairs (p < 0.05; for detailed
statistics, see Table S3 in the supplementary material). Thus, we find that readers with dyslexia sample identical
texts using a different sequence of fixations (i.e., fixating different locations on the text and/or for different dura-
tions) than non-dyslexics—even when differences in reading time are accounted for.
To summarize, our findings demonstrate that readers with dyslexia use a generally more laborious and inef-
ficient visual sampling strategy during natural reading. The virtually opposite pattern of directional deviations
between groups points towards the existence of occasional deficiencies in oculomotor control that result in
dyslexic readers losing their place more often. Replicating previous findings, their laborious strategy is character-
ized by longer average and line-initial fixation duration, prolonged first run dwell time as well as shorter saccade
amplitude and fewer skipped words. Contrarily, the probability of revisiting preceding words was comparable
between groups. This pattern of eye movements suggests that prolonged time for cognitive, linguistic processes
such as word decoding, lexical access, and/or phonological decoding underlies the behavioral difficulties associ-
ated with dyslexia such as substantially slower reading speed; but not an increased need for resolving semantic
or syntactic ambiguities through reanalysis of prior text. Altogether, these results indicate that an interplay of
linguistic and oculomotor factors underlies the reading struggles in adults with dyslexia.
Discussion
In this study, we used eye-tracking to devise a comprehensive eye movement profile of the visual sampling
strategy of adult readers with dyslexia during naturalistic reading of standardized multi-sentence texts in Eng-
lish (IReST63). Here, combining traditional and contemporary eye movement metrics, we show fundamental
differences between readers with and without dyslexia on all but one of the examined metrics. These results, in
combination with substantial decreases in reading speed, illustrate a laborious and more effortful reading strategy
in adulthood, resembling a pattern observed in b eginning2 and poorer r eaders56.
The idea that eye movements differ between readers with and without dyslexia is not new. R ayner1,48 was
among the first to report different eye movements during reading based on anecdotal case studies with only three
dyslexics. His investigations were followed by numerous cross-sectional studies using separate samples of readers
with dyslexia, and largely varying stimuli in languages with different orthographic depth (for reviews, s ee2,95).
This variety of stimuli, typically consisting of hand-picked single words or short sentences that impose artificial
task demands on the reader rather than allowing for an ecologically valid natural reading scenario, constitutes
an issue in the field96. The use of standardized and validated multi-sentence texts remains scarce in the literature.
In this work, we were particularly interested in reconciling many previously separate accounts of differential
eye movements using the same sample of individuals with dyslexia while also examining specific indicators
of oculomotor deficiencies during natural reading. Our results replicate previous findings of differential eye
movements in children and adults with dyslexia such as longer fixation durations, fewer skipped words during
first-pass reading and repeated fixations on the same w ord1,3,43–50,97. Oculomotor control has commonly been
investigated using a variety of non-linguistic saccade tracking and fixation stability t asks29,33,87,88,90,91,93. Here, we
show that specific saccades atypical for reading can be detected during natural reading. A twofold likelihood of
expressing such a saccade, termed directional deviation, indicates signs of occasional oculomotor deficiencies
in dyslexia—in line with previous r eports29,31–33,87–93.
Given that the eye movement profile of children with dyslexia during paragraph reading has previously been
exploited for dyslexia s creening43,44, it is worth asking whether the inclusion of metrics on separate levels of
granularity (i.e., the local single-word and global paragraph level) in adults improve our understanding of eye
movements in dyslexia? Our approach differs crucially from these two screening studies on several points. Firstly,
both studies were conducted with children around the age of 10 using recordings obtained from reading only
one non-validated text with short lines. Secondly, these studies aimed to identify the most parsimonious model
that classified recordings accurately as stemming from a child with or without dyslexia. This focus on reduc-
ing complexity in the data precluded devising a comprehensive profile, and may have resulted in overlooking
smaller but informative differences such as directional deviations. Thirdly, this model-focused approach did not
Scientific Reports | (2021) 11:6449 | https://doi.org/10.1038/s41598-021-84945-9 9
Vol.:(0123456789)www.nature.com/scientificreports/
allow for addressing specific hypothesis-driven questions using targeted measures such as line-initial fixations.
Hence, these child studies and our adult study complement each other by establishing an eye movement profile
of dyslexia at different ages that consists of a diverse set of metrics.
To answer the central question about the source of the reading struggles of individuals with dyslexia, all
differences across the entire profile need to be considered. These differences can be explained in the context of
established eye movement models that are able to simulate a wide range of reading related patterns including
fixation duration, multiple fixations on a word, parafoveal preview benefit, regressions, and spill-over effects—
E-Z Reader62,98–100, SWIFT101, OB1-Reader6. While these models were devised to explain the reading process
of typical readers, they can also provide insight into the processes of b eginning100,102 and dyslexic r eaders3,99.
Particularly, the extensive research on the E-Z Reader model, and its prior application to data obtained from
readers with dyslexia, makes it an interesting model for our study. It is a serial processing model which posits
that processing of the fixated word occurs in four separate stages, beginning as soon as the preceding word (N)
is fixated on and attention is allocated. First, information about the upcoming word (N + 1) is extracted from
the parafovea during pre-attentive visual processing. Second, a familiarity check is performed upon fixation.
The length of this familiarity check is dependent on the word’s frequency and length. Once a word is processed
for lexical familiarity, it signals the initiation of an eye movement. Third, completion of full lexical access leads
to a shift in attention to the next word (N + 1) in the form of a saccade. Fourth, an integration of the identified
word in the syntactic context is carried out simultaneously and may trigger a regressive saccade, if a syntactic
or semantic conflict is detected62,98,99.
In the case of individuals with dyslexia who present with longer fixation durations, as seen in the current
study, this model posits that these individuals experience slower lexical access, associated with increased lexical
processing demands. Where skilled readers require less time to perform the usually fast familiarity check (i.e.,
finding a match for the letter string making up a word), individuals with dyslexia do not seem to be able to carry
out this process equally fast. The dyslexia group also expressed shorter saccades and skipped fewer words during
first-pass reading—in line with previous fi ndings1,3,48. These findings, in combination with a higher frequency
of fixating on the same word repeatedly, corroborate the notion of needing to process each word or even its sub-
components individually, and for longer, when reading for comprehension. Prolonged line-initial fixations of
individuals with dyslexia in our study provide more evidence for delays in lexical access (stages two and three).
These first fixations on a line do not benefit from any parafoveal preview benefit (stage one) resulting in the sole
reliance of information sampled during this fixation for word identification purposes.
While a deficit in lexical processing can explain longer fixation durations for individuals with dyslexia, a
deficit in parafoveal processing could likewise explain increased fixation durations, shorter saccade amplitudes
and fewer skipped words. The preview benefit takes advantage of orthographic information from parafoveal
vision such as word length and word familiarity. It is linked with a reader’s perceptual span, which is defined as
the number of distinct characters from which useful information can be acquired in parallel across the fovea and
parafovea52,103,104. Should individuals with dyslexia present with such a deficit, removing or having a reduction
in this preview benefit could also result in the need for longer processing (i.e., fixation durations) when the next
word is being fixated on simply due to reduced pre-processing of its orthographic p ercept105. Such a smaller
106,107
perceptual span has previously been associated with reading s peed , and reported in d yslexia2,108. This deficit
can occur independently of a phonological deficit109, however, previous evidence is inconclusive110,111. In the
present study, line-initial fixation duration can serve as an indicator of parafoveal processing when compared
to all other fixation durations across a sentence. The former are usually longer due to absent parafoveal preview
while the duration of all other fixations decreases towards the end of a l ine84–86. These line-initial fixations were
longer for all readers compared to the median fixation duration across a trial. This difference was larger for read-
ers with dyslexia, which suggests that these readers need even more processing time when no preview benefit is
available. In other words, readers with dyslexia do not appear to be disadvantaged when the preview benefit for
words to the right of a fixation is available. This result demonstrates that a reduction in the perceptual span is
unlikely the explanation of the general increases in fixation duration, as seen in this study’s sample with dyslexia.
Another conceivable reason for explaining dyslexics’ reading struggles is that readers with dyslexia encoun-
ter increased semantic and syntactic processing difficulties. These difficulties would lead to revisits of previous
words, as illustrated by the frequently observed increase in the number of regressive s accades1,45,48,58,89. In the E-Z
Reader model, regressions are conceptualized as difficulty with integrating the identified word within the greater
sentence context—occurring during a fourth post-lexical integration stage. In line with previous literature, we
observed a greater number of regressions per trial in individuals with dyslexia. Vagge and c olleagues89, similar to
our work, reported this result for a study that also found slower reading speed. However, the higher number of
regressions in both studies may simply be a result of longer reading durations, since we did not find a difference
in the probability of making a regressive saccade in relation to the overall number of saccades of a trial. This
absent regression probability difference replicated an earlier report with dyslexic a dults3. With the E-Z Reader
model in mind, our findings speak against a deficit in the post-lexical integration stage of reading leading to the
reading struggles observed in the present s tudy99.
Although the traditional eye movement metrics reported in this work suggest that prolonged lexical process-
ing time underlies the slower reading speed and visual profile in dyslexia, the role of oculomotor deficiencies
is far from being established in the literature19,34,95,112. Their role has been at the center of the on-going dyslexia
debate. To investigate potential oculomotor deficiencies during natural reading, as opposed to saccadic track-
ing and fixation stability tasks, we examined saccades that are unexpected or atypical in the reading flow of a
skilled reader. We should consider horizontal rightward, leftward and diagonal return-sweep saccades reading
related. One may even include saccades pointing upwards in this list, since they might constitute a sudden
double-checking of previously read content. However, readers with dyslexia jumped away from some fixations
in directions atypical for reading such as straight downwards more often than their counterparts. We found the
Scientific Reports | (2021) 11:6449 | https://doi.org/10.1038/s41598-021-84945-9 10
Vol:.(1234567890)www.nature.com/scientificreports/
directional pattern of these atypical eye movements to be virtually reversed between groups. This indicates that
common eye movements such as blinks were not falsely identified as directional deviations in either group, as
they should have resulted in a similar pattern of directional deviations (for details, see “Methods”). The nature
and frequency (i.e., ~ 1 per trial) in the dyslexia group suggest that these directional deviations may be a residual
of oculomotor deficiencies that persist, but only occur occasionally, in adults with dyslexia attending higher
education. Thus, differences in oculomotor control appear unlikely to be the origin of their reading struggles—at
least in the present sample of individuals with dyslexia.
One conceivable concern of the present study’s design is that the observed eye movement profile could be
simply a result of texts that were too difficult for readers with dyslexia, since increases in text difficulty were
reported to lead to more eye movements in dyslexic children58, and a pattern similar to the one observed in this
study in readers with1 and without dyslexia2. However, given that the IReST are designed at a grade six reading
level and all of the participants in the present sample had previously attended or were attending higher education
at the time of participation, unsuitable text difficulty is very unlikely to be the reason for the observed differences.
A second concern is that we did not observe a ceiling effect in the responses to our multiple-choice ques-
tions—with two participants performing just above chance and 31.3% of all participants answering all questions
correctly. Although there are multiple reasons as to why not all participants answered all questions correctly, one
is the very specific nature of some questions, which makes those somewhat more challenging for some readers.
Importantly, we found no evidence for a difference between the two groups. Such a difference could have raised
concerns about it exerting effects on the eye movement contrasts in this study.
Third, we aimed to provide a comprehensive descriptive profile that can be paired with predictions from
established models of eye movement control. However, this profile itself may not be used to confirm causality
of the deficits underlying the general struggles of individuals with dyslexia. Particularly, given that the present
study tested adults and administered only a hypothesis-driven assessment of selected cognitive skills such as
visual processing speed, more information could prove useful in future studies to pinpoint the exact origins of
the reading struggles and their causal links. It is further conceivable that differences on reading tasks in adults
originate from less or reduced reading experience as opposed to neurobiological consequences of dyslexia per
se23. Therefore, the presented eye movement profile may serve as a basis for more targeted investigations in the
future probing the specific nature of the presumed deficit in lexical access and its direct causal link to the cogni-
tive mechanisms of the reading difficulties. In this respect, the extensive debate on the aetiology of dyslexia is
in dire need of more longitudinal investigations starting in kindergarteners to increase the likelihood of being
able to establish such causal links reliably through observing the pre-reading state and its change over time.
In summary, the presented eye movement profile of adults with dyslexia demonstrates a laborious and effortful
visual sampling strategy when reading multiline paragraphs of text. Specifically, the combination of prolonged
fixation duration, shorter saccade amplitude and fewer skipped words suggests deficits in the linguistic process-
ing components of reading such as fast and efficient access to the mental lexicon. Longer line-initial fixation
durations were particularly indicative of prolonged lexical analysis. On the contrary, we did not find convincing
evidence for a perceptual span deficit or increased difficulties in the semantic or syntactic post-lexical processing
stage of reading. An increased number of eye movements atypical for reading shows that the eyes of readers with
dyslexia occasionally move to seemingly random places on a page. Hence, occasional oculomotor deficiencies
should not be categorically dismissed in dyslexia.
Methods
Participants. We tested 73 participants: 35 adults with an official diagnosis of dyslexia, and 38 without
symptoms of dyslexia. Six individuals from the control group were excluded from all analyses due to large inac-
curacies during the calibration procedure (best eye with average error > 0.5° and max error > 1.3°). Hence, the
final data analysis was conducted on 67 participants: 35 with dyslexia (female = 23, Meanage = 23.54, SDage = 6.22)
and 32 without (female = 32, Meanage = 22.38, SDage = 2.7).
To delineate between control participants who experience dyslexia symptoms but have not been given an offi-
cial diagnosis, and to get a measure of severity of dyslexia symptoms at the time of participation, all participants
completed the Adult Dyslexia C hecklist113. This checklist assesses aspects of literacy, language, word finding,
and organization skills on a scale of 1–4 (i.e., rarely / occasionally / often / most of the time). As specified by the
original authors, a score of 45 or more points indicates mild to severe dyslexia symptoms113. We used a score
of ≤ 40 points as a conservative cut-off for our control group, with all formally diagnosed dyslexics allocated to
the dyslexia group.
Participants were matched on age and level of education. They were either current or former college or uni-
versity students at anglophone institutions in Canada. Since participants were recruited in Montréal, a bilingual
English-French city, our sample comprises both bilingual and monolingual English speakers (bilingualDyslexia = 18,
monolingualDyslexia = 17; bilingualControl = 9, monolingualControl = 23). To avoid introducing a language effect, we
compared bilingual to monolingual participants and found no evidence for a difference in reading duration in the
dyslexia group (t(33) = 1.829, p = 0.0765; g = 0.6, 95% CIDyslexia = [− 0.064, 1.264]; BF10 = 1.16) nor the control group
(t(30) = − 0.5, p = 0.6212; g = − 0.19, 95% CIControl = [− 0.94, 0.56]; BF10 = 0.4). We neither observed a language effect
regarding attention to the text in the dyslexia group (t(33) = 1.375, p = 0.1784; g = 0.45, 95% CIDyslexia = [− 0.206,
1.108]; BF10 = 0.67), and insufficient evidence in the control group (t(30) = − 2.241, p = 0.0326; g = − 0.86,
95% CIControl = [− 1.634, − 0.071]; BF10 = 2.16). Based on these findings, groups were collapsed across language
for all analyses. Written informed consent was obtained from all participants. Participants could choose between
receiving $10 or course credit as compensation. This study adhered to the Canadian Tri-council Policy on ethical
conduct for research involving h umans114, and obtained approval by the Concordia University Human Ethics
Research Committee (certificate: 30003975).
Scientific Reports | (2021) 11:6449 | https://doi.org/10.1038/s41598-021-84945-9 11
Vol.:(0123456789)You can also read