Developing a High Grade Neodymium & Praseodymium Mine - Investor Presentation
←
→
Page content transcription
If your browser does not render page correctly, please read the page content below
Developing a High Grade
                            Neodymium & Praseodymium Mine

HASTINGS                                                    Investor Presentation
Technology Metals Limited                                         July 2018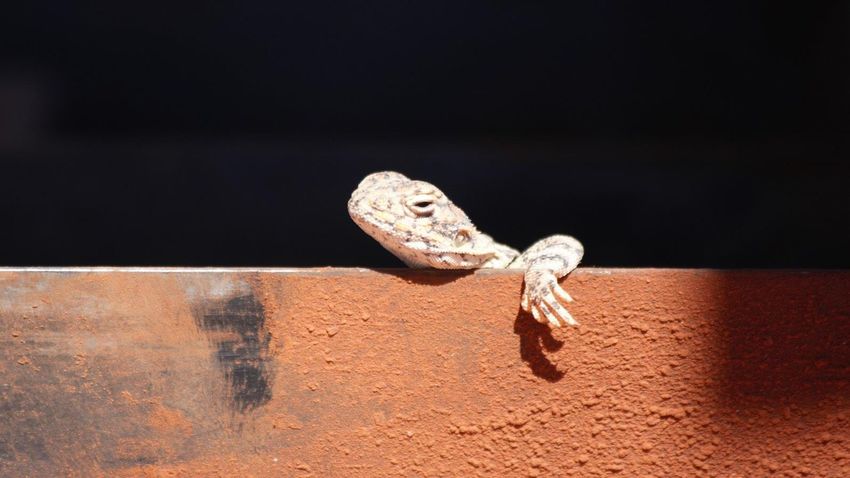
All currency amounts are in A$ unless stated otherwise.
Disclaimer
This presentation has been prepared by Hastings Technology Metals Limited (“Company”). It does not purport to contain all the information that a prospective investor may require in connection with any potential investment in the Company.
You should not treat the contents of this presentation, or any information provided in connection with it, as financial advice, financial product advice or advice relating to legal, taxation or investment matters.
This presentation is provided expressly on the basis that you will carry out your own independent inquiries into the matters contained in the presentation and make your own independent decisions about the affairs, financial position or
prospects of the Company. The Company reserves the right to update, amend or supplement the information at any time in its absolute discretion (without incurring any obligation to do so).
Neither the Company, nor its related bodies corporate, officers, their advisers, agents and employees accept any responsibility or liability to any person or entity as to the accuracy, completeness or reasonableness of the information,
statements, opinions or matters (express or implied) arising out of, contained in or derived from this presentation or provided in connection with it, or any omission from this presentation, nor as to the attainability of any estimates, forecasts
or projections set out in this presentation. Pursuant to the general law (whether for negligence, under statute or otherwise), or any Australian legislation or any other jurisdiction. Any such responsibility or liability is, to the maximum extent
permitted by law, expressly disclaimed and excluded. Nothing in this material should be construed as either an offer to sell or a solicitation of an offer to buy or sell securities. It does not include all available information and should not be
used in isolation as a basis to invest in the Company.
Forward Looking Statements
This presentation contains reference to certain intentions, expectations, future plans, strategy and prospects of the Company. Those intentions, expectations, future plans, strategy and prospects may or may not be achieved. They are
based on certain assumptions, which may not be met or on which views may differ and may be affected by known and unknown risks. The performance and operations of the Company may be influenced by a number of factors, many of
which are outside the control of the Company. No representation or warranty, express or implied, is made by the Company, or any of its directors, officers, employees, advisers or agents that any intentions, expectations or plans will be
achieved either totally or partially or that any particular rate of return will be achieved.
Given the risks and uncertainties that may cause the Company’s actual future results, performance or achievements to be materially different from those expected, planned or intended, recipients should not place undue reliance on these
intentions, expectations, future plans, strategy and prospects. The Company does not warrant or represent that the actual results, performance or achievements will be as expected, planned or intended.
Exploration Targets
The terms “Target” or “Exploration Target” where used in this presentation should not be misunderstood or misconstrued as an estimate of a Mineral Resource as defined in this context. Exploration Targets are conceptual in nature, there
has been insufficient exploration to define a Mineral Resource and it is uncertain further exploration will result in the determination of a Mineral Resource.
Competent Persons’ Statement
The information in this presentation that relates to Resources is based on information compiled by Lynn Widenbar. Mr Widenbar is a consultant to the Company and a member of the Australasian Institute of Mining and Metallurgy. The
information in this presentation that relates to Exploration Results is based on information compiled by Andy Border, an employee of the Company and a member of the Australasian Institute of Mining and Metallurgy.
Each has sufficient experience relevant to the styles of mineralisation and types of deposits which are covered in this announcement and DFS and to the activity which they are undertaking to qualify as a Competent Person as defined in
the 2012 edition of the ‘Australasian Code for Reporting of Exploration Results, Mineral Resources and Ore Reserves’ (“JORC Code”). Each consent to the inclusion in this announcement and DFS of the matters based on his information
in the form and context in which it appears.
The information in this presentation that relates to the Fraser’s and Bald Hill Ore Reserve is based on information reviewed or work undertaken by Mr Frank Blanchfield, FAusIMM, and an employee of Snowden Mining Industry
Consultants. Mr Blanchfield has sufficient experience relevant to the style of mineralisation and type of deposit under consideration and to the preparation of mining studies to qualify as a Competent Person as defined by the JORC Code
2012. Mr Blanchfield consents to the inclusion in this announcement and DFS of the matters based on his information in the form and context in which it appears.
The scientific and technical information in this presentation that relates to process metallurgy is based on information reviewed by Mr Dale Harrison MAusIMM, who is a metallurgical consultant and employee of Wave International. Mr
Harrison has sufficient experience that is relevant to the style of mineralisation and type of deposit under consideration and to the activity being undertaken to qualify as a Competent Person as defined by the JORC Code 2012. Mr Harrison
consents to the inclusion in this announcement and DFS of the matters based on his information in the form and context in which it appears.
US disclosure
This document does not constitute any part of any offer to sell, or the solicitation of an offer to buy, any securities in the United States or to, or for the account or benefit of any “US person” as defined in Regulation S under the US Securities
Act of 1993 (“Securities Act”). The Company’s shares have not been, and will not be, registered under the Securities Act or the securities laws of any state or other jurisdiction of the United States, and may not be offered or sold in the
United States or to any US person without being so registered or pursuant to an exemption from registration including an exemption for qualified institutional buyers.
Some End Uses for Magnets’ Rare Earth

                                        3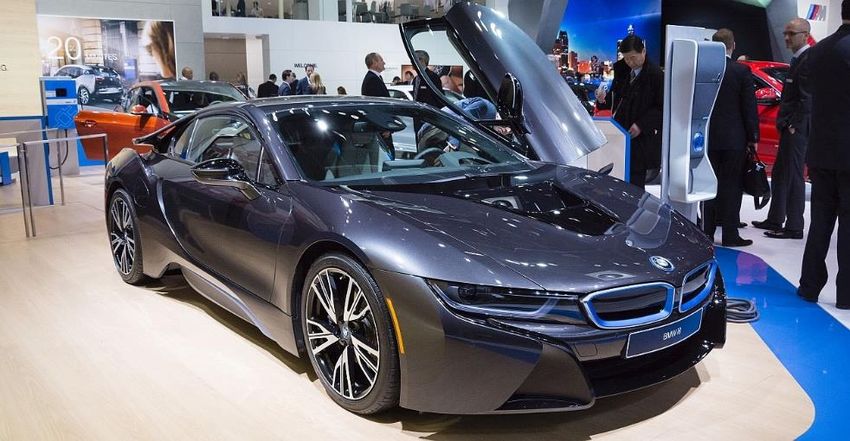
Hastings Equity Statistics
Steady growth in market cap since May 2017

•   Market Cap ~ A$ 180m

•   ~ 1200 Shareholders
    +55% in 2017

•   Top 10 shareholders owns
    ~ 70%

•   A$59m raised since 2014

•   Cash: A$25m as reported on
    31st March 2018

•   No Debt

• Included in the ASX All
  Ordinaries Index

                                             4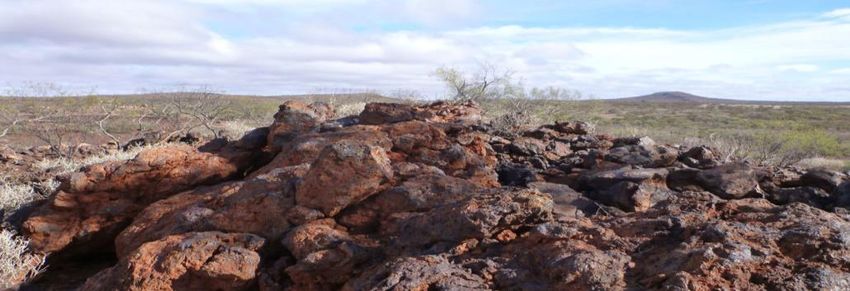
Yangibana Development History
 PROJECT MILESTONES

                                                                                                                     Nov 17
                                                                                                                  DFS completed            Jul 18
                                                                   May 16
                                                                PFS completed                                 Nov 17                     LLTE orders
                                      Mar 14
                              Exploration land holding                                    May 17             Native Title        Jun 18
                              increased at Yangibana                                  Metallurgical Pilot    agreement      Submission of PER
                                                                                      Plant completed          signed          document

                               2014                2015                  2016                      2017                       2018
RESERVE & RESOURCE UPGRADES

                                                                                                                                              July 18
                                       Sep 14                 Nov 15                    Jan 17                        Nov 17            Planned increase of
                               6.8 MT JORC Resource       12.4 MT JORC          13.4 MT JORC Resource         5.2 MT JORC Reserves         ~2.5MT JORC
                                                            Resource                                                                          Reserve
                                                                                                           Oct 17
                                                                                                  20.7 Mt JORC Resource
                                 Yangibana Project Site                                     Typical Ironstone Outcrop

                                                                                                                                                          5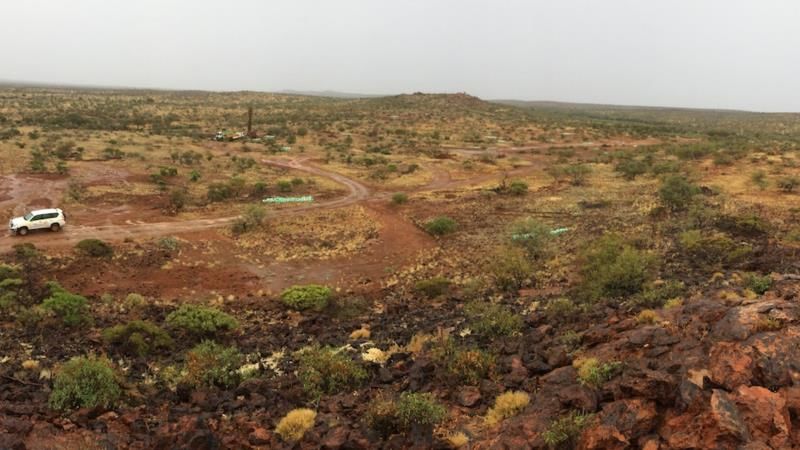
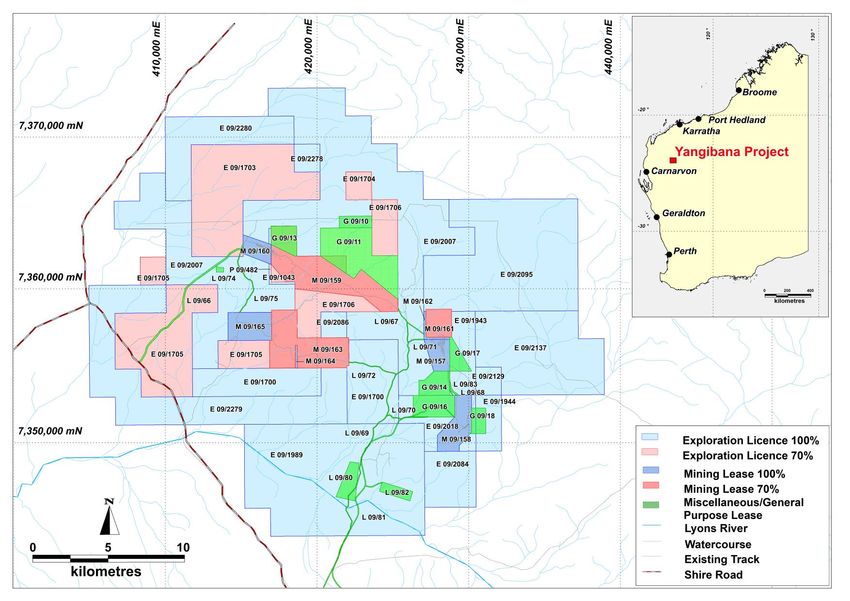
Yangibana – Western Australia
Established Mining Region, Flat Terrain, Open Pit

                                                    • Yangibana area ~ 650 km2

                                                    • 21 years Mining Leases
                                                      granted since March 2016
                                                      covering only 50 sqkm

                                                    • JORC Resource – 21m tonnes
                                                      from 50 sqkm

                                                    • Native Title Agreement signed
                                                      Nov 2017 for 650sqkm

                                                    • Miscellaneous and General
                                                      Purpose Leases granted for
                                                      supporting infrastructure

                                                    • Permits to granted to
                                                      commence mine
                                                      infrastructure construction
                                                                                    6
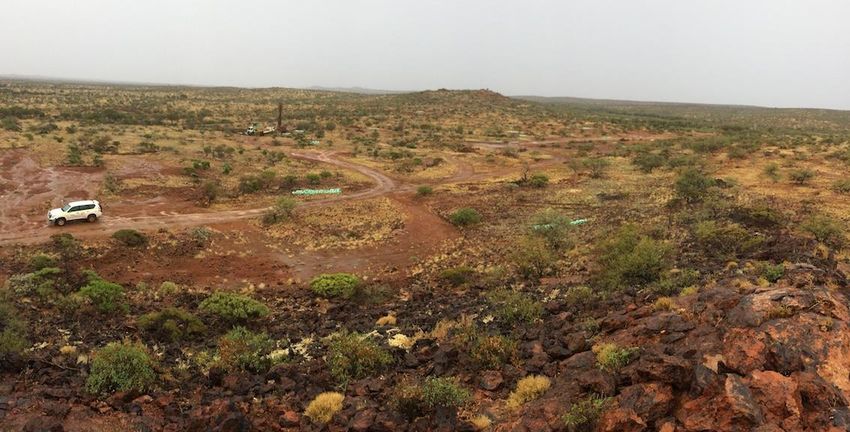
Favourable Terrain
Mineralised out crops, shallow open pit mining
                                                                       Selective Mining – Bald Hill

                                                 Selective Mining – Fraser’s

                                                                                                      7
JORC Resources and Reserves
High Neodymium and Praseodymium content
                                                   Total Yangibana JORC Resources (rounded)

 • Total Measured, Indicated and Inferred          Category     Tonnes    Nd2O3+Pr6O11    TREO    Nd2O3   Pr6O11
                                                                               %            %      ppm     ppm
   Resources now at 21MT*                          Measured     3,900,000     0.42         1.19   3,372    851
                                                   Indicated    8,600,000     0.42         1.25   3,368    858
                                                   Inferred     8,400,000     0.36         1.09   2,829    740
 • Total Probable Ore Reserve at 5.15MT            TOTAL       21,000,000     0.40         1.17   3,152    809
   Additional Production Target of ~ 2.5MT to be
   added mid 2018                                  Hastings 100% owned ground
                                                   Category     Tonnes    Nd2O3+Pr6O11    TREO    Nd2O3   Pr6O11
                                                                               %            %      ppm     ppm
 • Target Total Reserves of 10MT by early 2019     Measured     3,000,000     0.42         1.06   3,404    809
   on 100% owned ground                            Indicated    6,600,000     0.41         1.09   3,324    794
                                                   Inferred     5,800,000     0.35         0.93   2.840    684
                                                   TOTAL       15,400,000     0.39         1.03   3,158    756
 • DFS only on 100% owned ground; Additonal
   Reserves from JV tenements in future            Hastings 70% owned JV ground
                                                   Category     Tonnes     Nd2O3+Pr6O11   TREO    Nd2O3   Pr6O11
 • In-ground ratio of Nd-Pr as % of TREO ranges                                 %           %      ppm     ppm
                                                   Measured     900,000        0.43        1.64   3,258    997
   from 34% (0.40%/1.18%) to as high as 57%        Indicated   2,100,000       0.46        1.76   3,507   1,061
   locally at Simon’s Find deposit                 Inferred    2,700,000       0.37        1.42   2,806    860
                                                   TOTAL       5,600,000       0.41        1.58   3,134    955
 * Hastings ASX release 22 Nov 2017;
                                                                                                                   8
Native Title Agreement signed
Agreement reached with Thiin-Mah Warriyangka, Tharrkari and Jiwarli
    • Signed 9th November 2017 covering all 650 sqkm

    • < 1% royalty based on sales for the LoM

    • Applicable to all rare earth and niobium mined

    • Provision of jobs and training for the community

                                                                      9
Definitive Feasibility Study (DFS) – Yangibana
Independent Study by Wave International and Snowden
  • JORC Resource of 21MT supports an initial 8 years mine life on 100% held ground

  • Maiden JORC Probable Ore Reserves of 5.15MT on 100% owned ground

  • Highest known Neodymium & Praseodymium (Nd-Pr) content at 41% of TREO

  • Mining 1m tonnes pa to produce up to 15,000 tpa of Mixed Rare Earths Carbonate

  • Nd-Pr metallurgical recovery 75.6% achieved in pilot test plant

  • Financial Highlights:
     • NPV (after tax) = A$466m at 8% discount rate
     • IRR = 78%
     • EBITDA payback of 2.3 years from average equity drawdown period
     • Pre-production CAPEX – A$335m ; OPEX - A$17.06/kg TREO (US$12.8/kg)

  • Additional Production Target will increase Reserves to 8MT on 100% owned ground
  * The underlying assumptions and production targets have not changed from the date of release of the DFS on 28 November 2017 (see also
                                                                                                                                           10
  page 26)
Four off-take MOUs signed
70% of Yangibana production under Offtake MOUs to German and Chinese customers
➢ Thyssenkrupp Raw Materials Gmbh – 5,000 tonnes per annum of Yangibana MREC for 10 years;
for the German and European automotive and other industries (28 Feb 2018)
➢ Baotou Sky Rock Rare Earth New Material Co. Ltd – 2,500 tonnes per annum (1 Aug 2017)
Sky Rock produces high tolerance NdFeB permanent magnets. Main products include
• Sintered Neodymium Magnets
• Sintered Samarium Cobalt Magnets
➢ China Rare Earth Holdings Ltd – 2,000 tonnes per annum (1 Sept 2017)
• CREH started business in 1987 and listed on HKEX in 1999
• Established manufacturer of rare earth derived and refractory products
➢ Qiandong Rare Earth Group (GQD) – 1,500 tonnes per annum (13 Sept 2017)
• GQD founded in 1988
• Through 11 subsidiary companies involved in all parts of the rare earth product supply chain
✓ Offtake Price will be set at average of 3 months market prices prior to shipment, FOB Freemantle
✓ Potential for additional off-take with Japanese customers
11Yangibana Advantage – Highest Nd-Pr ratio
Comparison of REO Distribution & Basket Value • Nd-Pr /TREO
Between Hastings and Major Light RE Producers composition is validated
China Outside of China by customers in the
RE Oxide/TREO Unit Hastings
Baotou Sichuan Mt Weld Mountain Pass MREC
Lanthanum % 9.99 25.94 36.50 25.16 33.22
Cerium % 39.59 50.69 47.90 46.36 49.10 • Economic Value Factor
Praseodymium % 8.01 5.15 4.10 5.38 4.30 calculated on individual
Neodymium % 33.80 15.90 10.00 18.79 12.00 % of REE in the ore
Samarium % 3.88 1.21 0.70 2.27 0.80 body x REO prices
Europium % 0.84 0.22 0.08 0.47 0.12
• Yangibana: high Nd-Pr
Gadolinium % 1.80 0.39 0.23 0.85 0.17
content of 41%
Terbium % 0.15 0.05 0.04 0.06 0.04
Dysprosium % 0.50 0.11 0.06 0.16 0.07
• Yangibana basket
Yttrium % 1.14 0.25 0.31 0.45 0.10 price @ USD30.50/kg
Other % 0.29 0.10 0.08 0.05 0.09 (Oct 2017) used in
DFS
Economic Value Factor 1.90 1.00 0.72 1.14 0.81
• 9th May 2018 basket
Basket Price USD/kg 29.20 15.35 11.15 17.45 12.40 price is $29.20
12Spot Prices of Rare Earth Oxides (May 2018)
China F.o.B. Export prices 09-Mar-2018 (USD/kg) & YTD change
Lanthanum oxide La2O3 $ 2.37 1%
Cerium oxide CeO2 $ 2.30 0%
Praseodymium oxide Pr6O11 $ 70.50 +11 %
Neodymium oxide Nd2O3 $ 58 +22 %
Dysprosium oxide Dy2O3 $ 190.50 +9 %
Terbium oxide Tb4O7 $ 517.50 +22 %
Samarium oxide Sm2O3 $ 2.25 -2 %
Europium oxide Eu2O3 $ 59.50 -9%
Erbium oxide Er2O3 $ 26 +2 %
Holmium oxide Ho2O3 $ 64.35 +3 %
Lutetium oxide Lu2O3 $ 671.10 +3 %
Yttrium oxide Y2O3 $ 3.35 0%
Source: ASIAN METAL May 2018
13Peer Comparison
REO Composition and Basket Price
Peak Basket
Hastings Lynas Alkane Greenland Molycorp
Resources Prices
Mountain
Project Yangibana Mount Weld Ngualla Dubbo Kvanefjeld
Pass US$/kg
Current Stage Construction Production Development Development Development Ceased Op
Lanthanum % 10.0% 25.2% 27.6% 19.5% 27.7% 33.2% 2.4
Cerium % 39.6% 46.4% 48.2% 36.7% 36.1% 49.1% 2.4
Praseodymium % 8.0% 5.4% 4.7% 4.0% 4.5% 4.3% 69.2
Neodymium % 33.8% 18.8% 16.6% 14.1% 13.7% 12.0% 58.4
Sub-Total NdPr % 41.82% 24.17% 21.33% 18.10% 18.19% 16.30% -
Samarium % 3.9% 2.3% 1.6% 2.2% 3.0% 0.8% 2.5
Europium % 0.8% 0.5% 0.3% 0.1% 0.2% 0.1% 66.0
Gadolinium % 1.8% 0.9% 0.6% 2.2% 1.8% 0.2% 16.9
Terbium % 0.1% 0.1% 0.1% 0.3% 0.3% 0.0% 478.0
Dysprosium % 0.5% 0.2% 0.1% 2.1% 1.4% 0.1% 181.5
Yttrium % 1.1% 0.5% 0.2% 15.8% 10.1% 0.1% 3.6
Others % 0.3% 0.1% 0.0% 0.0% 1.3% 0.1% -
Basket Value US$/kg 29.24 17.51 15.51 18.63 18.15 12.41 -
Source: Asian Metal as at 18 May 2018, Company announcements.
14Market Comparison (non-China)
Key Statistics
NdPr Enrichment (NdPr % of TREO) Basket Value (US$/kg of TREO)
45% 40
41.8% 1
30
30% 29.2
20
24.2%
15% 21.3% 18.6 18.2 17.5
18.2% 18.1% 10 15.5
- -
Hastings Lynas Peak Greenland Alkane Hastings Alkane Greenland Lynas Peak
Resources Minerals Minerals Resources
Operating Margin (US$/kg of TREO produced) Capital Intensity (US$/kg NdPr p.a.)
20 900
19.7 867.6
15
10 600
5
5.7 5.3 4.6 3.1 300
-
Hastings Peak Alkane Lynas Greenland 163.7 63.7
129.9 128.8
Resources Resources Minerals -
Notes:
1. Life of mine basket price. Alkane Greenland Peak Lynas Hastings
Source: Asian Metal as at 18 May 2018, Company announcements. Resources Minerals Resources
15The Yangibana Process and Product
From Mining to Mixed Rare Earth Carbonate (MREC)
Successful Beneficiation and Hydrometallurgy pilot plan test-work proves simple and effective production
process flow sheet.
1m t.p.a. mined 30 - 40k t.p.a. Beneficiated ~15,000 t.p.a. MREC
Concentrate = ~8,500 t.p.a. REO
MINING BENEFICIATION HYDROMETALLURGY MREC
• Open pit contract mining @ • Upgrade TREO more than • Acid bake, water leach, • Up to 43% Nd-Pr
rate of 1m t.p.a. 20x from ore to impurity removal & RE portion of TREO in
Beneficiated concentrate carbonate precipitation MREC
• Total JORC Resource ~
21m tonnes • Pilot Plant achieved 23% • TREO recovery rates in final • Removed impurities to
TREO concentrate MREC =/> lab results acceptable product
• In-ground Total Rare Earth specifications
Oxides (TREO) Grade ~ • Post-pilot optimisation - • Produced Samples for offtake
1.17% 27% TREO at 85% customers testing • Sale of MREC
recovery
* ASX release: 22-Nov-2017 * ASX release: 20-Mar-2017 * ASX release: 22-May-2017 * ASX release: 22-May-2017
* See Company ASX releases for additional information on all processes. 16Yangibana Flowsheet
Pilot test work at ALS and ANSTO confirms production process
Flotation Pilot Plant Operation at ALS, Perth
• Beneficiation – more than 20x upgrade with
85% Nd-Pr recovery at optimum conditions
• Hydrometallurgy – 41% Nd-Pr content in the Final flotation
concentrate from
Yangibana MREC
beneficiation pilot
Neutralisation & Precipitation
Circuit – Hydromet - ANSTO
*ASX releases 20-Mar-2017 & 22-May-2017. 17Downstream Toll Treatment by Customers
Estimated Tolling cost USD 2.50/kg (based on 15,000 tons MREC)
Mixed Rare Earths
Carbonate(MREC) Global Separation Capacity
15%
Dewatering of Precipitated Solids
MREC Dissolving
85%
Separation with
Solvent Extraction
Calcination of Precipitated Solids
China Outside of China
Excess Separation capacity exist outside of
Separated RE Oxides to
China includes the separators in Malaysia,
Separated REE RE Metal/Magnet Maker India, Vietnam, Kazakhstan/eastern EU,
Precipitation etc.
18Global Nd-Pr Oxide Supply Demand 2017 - 2025
Possible shortage - crossover point in 2020
Imports to rise due to higher
domestic demand from “Made
in China 2025” policy
Exports fall as Japan sources
more from Lynas and ROW
Source: Adamas Intelligence 14th International Rare Earth Conference, Nov 2017
19Made in China 2025 Policy – Implications
Do they have enough NdPr to meet ROW demand?
• EV technology and production – China wants to be world leader
✓750K EVs in 2017 to ~8M by 2025
• Supply Constraints due to eliminating illegal production
✓Export Quotas and Taxes/Royalties (to fund environment clean up)
✓Environmental legislation – strong commitment to enforcement
✓Industry consolidation & vertical integration by 6 SOE producers
✓Establish a rare earths certification system – part of ISO commitment
• RE mining quota increased : 2018 1H 73.5K (FY 147K) vs 2017FY 105K
tonnes
• China leads in global renewable energy investment with USD126bn
20Global Demand Growth for Permanent Magnets
CAGR 2017 – 2022 is ~ 9%
Application 2016 2017 2022 CAGR%
USDm USDm USDm 2017–2022
Global Market for Permanent Magnets -
Consumer electronics 1,933.9 2,090.8 3,078.0 8.0
by Industry 2022 (USD m)
Electric motors 1,888.9 2,074.6 3,287.3 9.6
Sonic equipment, magnetic sensors, actuators 1,131.8 1,228.5 1,846.8 8.5
and transducers Automotive
2,318
Medical devices
Considering weight, material costs and 951.9 1,025.1 the1,514.4
overall strength, NdFeB 8.1
Industrial
magnet offers the best value for money
Generators 914.5 984.4 1,514.4 9.0
2,666
Others 674.7 732.2 1,071.0 7.9 8,532
Home
TOTAL 7,495.7 8,135.6 12,311.9 8.6 appliances
4,057
Medical
NdFeB magnets offer the best power to cost ratio
Materials Average Price Average Max. $/MGOe Others 5,611
($/lb.) Energy Product
(MGOe)
Hard Ferrite 2.0 3.5 N/A
NdFeB 75.0 30.0 2.3
Samarium-Cobalt 162.0 22.0 7.4
AlNiCo 27.0 8.0 3.4
Source: BCC Research: Magnets and Magnet Materials: Global Markets Oct 2017. 21Early Works Programme
Commenced Q2 2018
Bulk earthworks 240 room Civil engineering Establised an Order Critical Path
contracts scope Accomodation design being Owners Team Long lead time items
developed and work village - finalised for: ie. Rotary Kiln,
to start in April fabricaton •Access roads FEED + EPCM Sulphuric Acid Plant,
started in May, •Village areas for project SAG mill
completion by •Laydown pad for construction to
year end core and Sample completion
prep yard
22Overall Mine Layout
Optimising logistics between deposits
• Mining by conventional drill and
blast
• Pit optimisations were completed to
determine the economic mining
limits for each deposit
• Waste dumps located to minimise
haulage distances
• Mining schedule based on value
creation and waste reduction
• Water supply – sourced from bore-
field near to process plant
23DFS Capital Cost A$335m
An improvement of 20% from PFS
A$
Cost Centre A$ Million Cost Centre
Million
Process Plant $130.2 Non Process Infrastructure $105.1
Mining Crushing and Screening 3.6 Mine Infrastructure 3.9
Contingency 1%
13% Grinding 14.1 TSF 1,2 and 3 19.5
Flotation 27.0 Evaporation Pond 0.3
Beneficiation 4.1 Accommodation Village 14.6
Indirect Process Hydrometallurgy 50.9 Roads 22.3
Costs Plant
15% 39% Hydrometallurgy Reagents 8.1 Air strip 1.6
Reagents Plants 19.7 Plant / Mining Buildings 9.8
Pipe Racks 2.7 Water Supply 9.2
Other Costs Power Supply 17.0
2%
ICT 0.9
Services Cost Centre A$ Million Other Services 6.2
10%
Indirect Costs $56.3
Infrastructure
Tailings Spares & First Fills 5.9 Contingency 43.7
Facility
14% EPCM Costs 37.6
6%
Owners Costs / Pre Production 7.9
Vendor Support / Commissioning 3.6
Total Pre-Production
Project Insurances 1.2 $335.3
CAPEX
24DFS Operating Cost A$17.06/kg (US$13.00/kg) of TREO
An improvement of 30% from PFS
• May 2018 MREC Basket Price
USD29.20/kg vs DFS of USD 30.50/kg¹
• Post-DFS Opex Costs estimate
increase to USD15.00/kg vs DFS Opex
of USD13.00/kg¹
• Expect rise in Opex due to pick up in
activity in resource sector
• Financing costs, etc. ~USD3.00/kg
• Separation costs: USD2.50 – 3.00/kg
• Estimated profit margin USD8/kg ~
25% profit margin
¹Other than small changes noted there have been no changes in underlying assumptions or production targets since the DFS was released on 28 November 2017. 25Development plan 2H2018 onwards
Further in-fill drilling, FEED, early infrastructure work and financing negotiations
targeted to secure financial close in 1Q 2019
Timetable Funding Options
Key Activities
Q2-3 Q4 Q1 Q2 Q3 • Project Finance Funding:
CY18 CY18 CY19 CY19 CY19
Completed and ✓ Debt 65% : 35% Equity
Published DFS ✓
• Senior & subordinated debt funding,
OPERATIONAL
Early Works program including:
✓ Commercial banks
Finalise environmental approvals
✓ Export Credit Agencies e.g. Euler
Commence construction work Hermes
Approached banks and project ✓ Government (OECD) loan guarantee
financiers schemes e.g. UfK
Select and appoint lead debt
✓ Australian Government funded loan
FINANCING
arranger, due diligence,
documentation, etc. agencies e.g. NAIF, CEFC
Equity raising work streams • Working capital financing and trade lines
Finalise debt funding and • Cash as @ 31 March 2018 ~A$24.5m
financial close 26Timetable to Production
Milestones to production by Q1/Q2 2020
Critical Path
27Board of Directors
Experienced Directors and Management Team
Guy Robertson Charles Lew Jean Claude Steinmetz
Finance Director & Executive Chairman Non-Exec. Director / Commercial
Company Secretary Director
• Corporate Finance Director HG Asia • Previously Chief Operating
• 30+ years CFO experience Securities 1990 - 1997 Officer for Lynas Corporation
• CFO for various ASX listed • MD of ABN Amro Investment Bank • 25+ years Involved in the
junior mining companies Singapore 1997 - 2000 chemical industry with Rhodia
• Independent Director of RHB Banking and General Electric
• Senior finance executive in Group 2004 - 2016 • Chairman of the Auto Plastic and
Jardine Matheson Group in • 30+ years experience in investment Innovative Materials Committee
Hong Kong and Australia banking in London (HSBC & Robert of Sino-EU Chemical
including Jardine Lloyd Fleming) and in Singapore Manufacturers Association
Thompson, Colliers Jardine,
and Franklins Limited • Private investor and entrepreneur in
F&B, real estate, financial services, etc
28Management Team
In depth experience and specialised skills
Andy Border Stefan Wolmarans Hannes Zandberg Robin Zhang
General Manager Exploration Chief Operating Officer Project Director Process Engineering Manager
• 40+ years experience as a • 20 years experience in planning & • 30 years experience in mining, • 20+ years experience in R&D,
geologist management of mining projects metallurgy, chemical refinery, project engineering, plant
including non-process mine infrastructure, power commissioning & operations
• Rare earths, copper, gold and
infrastructure, municipal, generation and advanced
industrial minerals • 8 years at Lynas Corporation -
commercial and industrial projects control systems; 10 years in
• Recent roles include Senior Technical Services &
in Australia and Africa. operations and 20 years in
Exploration Manager, COO and Project Development Manager
• Study Leader responsible for projects
MD of a number of ASX-listed • 11 years with Gansu Rare Earth
delivering the Yangibana Project • Area Manager – SNC-Lavalin
companies with projects in Group, China - Deputy Director of
DFS (on secondment from Wave) Project Services, Project
Australia and elsewhere Technical Centre
• Chartered professional engineer Director - Dundee Precious
(CPEng:Civil) Australia; Registered Metals, Engineering Manager
Professional Engineer (RPEQ) in – Moly Mines
Queensland 29Summary
▪ Experienced management ▪ MREC with 41% NdPr content ▪ Market Cap A$200m
team with rare earth
production experience ▪ Basket price (May 2018): ▪ NPV A$466m
USD29.20/kg
▪ Definitive Feasibility Study ▪ IRR 78%
(DFS) completed Nov 2017 ▪ Mine construction 1Q 2019
Production Q2 2020 ▪ EBITDA payback 2.3yrs
▪ Off-take MOUs signed with
Thyssenkrupp, Germany and ▪ Probable Ore Reserves 5.15m ▪ Cash at A$25m; No debt
3 Chinese RE producers tonnes + ~ 2.5m tonnes 3Q’18
▪ Pre-tax profits margin (est)
▪ Native Title Agreement signed ▪ Target Total Reserves: 10MT by USD8/kg
1Q 2019
▪ Mining Lease granted for 21 ▪ IIR Research May 2018 -
yrs since March 2016 ▪ JORC Resource Estimate Target Share Price 60c
currently @ 21.0m tonnes 30Thank you. Q&A
You can also read