Development of a Water Management Model for the Metropolitan Water District (NW Tucson)
←
→
Page content transcription
If your browser does not render page correctly, please read the page content below
Development of a Water Management Model for the Metropolitan
Water District (NW Tucson)
Amy Lynn
Advisor: Kevin Lansey, Ph.D.
Department of Civil Engineering and Engineering Mechanics
College of Engineering
Acknowledgement: University of Arizona, Technology and Research Initiative Fund
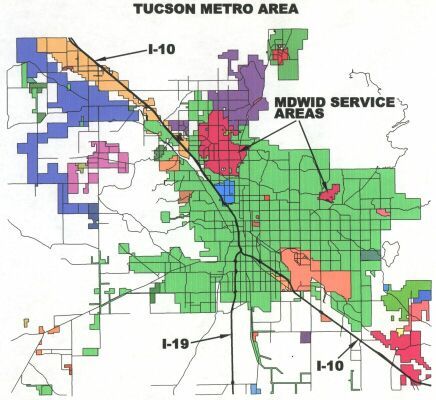
2007/2008, Water Sustainability Undergraduate Student Fellowship ProgramImportance and Potential Benefits As Tucson continues to grow, current water practices have proven unsustainable. Water providers need reliable and effective data as a basis for making informed policy decisions that meet today’s water needs without jeopardizing the water supply for the future. The goal of this research has been to develop a water model for the Metropolitan Water District, using the computer program Powersim. This model provides Metro Water with one more tool to aid in immediate and long-term decision making and planning. The model can further be used for educational purposes to explain Metro Water’s decisions to the public. This comprehensive model can also serve as a framework for other utilities wishing to model their service areas. Methods The Metropolitan Water District is comprised of a main service area and a hub service area (please see the attached figure); therefore, two models have been designed. The actual model framework is the same for both models, but the parameters have been tailored to each individual service area. Research methods can be divided into two main parts—data collection and adjusting or adding to the existing Powersim model. As more data was collected for both the main service area and the hub region, the existing model of the Metropolitan Water Hub Service Area was expanded to include a more comprehensive understanding of the hub region and a framework for the main service area. This methods section will describe how each model was designed in Powersim and how the input data for the parameters was determined. Both models have been designed to comprise indoor and outdoor water usage for both single-family housing units and multi-family housing units; which include apartments, condominiums, townhouses and mobile home parks. In addition to the amount of water used, the cost of the water use has been included in the model. Indoor water usage includes: toilets, showers, faucets, bathtubs, washing machines and dishwashers. Outdoor water usage includes: turf and drip irrigation, pools, fountains, evaporative coolers, rainwater collection and water reuse. The choices the model users are offered are limited compared to the actual number of parameters in the model. The parameters that impact the water use the most and that people would actually change are deemed conservation parameters. While the majority of parameters are kept constant, the conservation parameters are the options provided to the model users. After the model has been run, the final results include: monthly and yearly water use for the entire service area, average water use and cost per housing unit, and yearly cost for the entire service area. The models also contain a default setting that was determined from the data collected. A comparison of the default settings to the conservation parameter changes instructed by the model user is also included. Data collection was completed using aerial photos and real-estate information. The aerial photos were used to determine the average area for turf irrigation, drip irrigation and pools for randomly chosen housing units throughout the service area. The percentage of housing units with these characteristics was also determined using aerial photos. Drip
irrigation proved to be the most difficult to measure because the amount of water needed
by trees and shrubs depends heavily on both the type and diameter. While the percentage
of homes with trees and bushes was easily estimated with the aerial photographs, the type
of vegetation is impossible to determine and measuring the diameter proved to be
pointless because water use changes depending on the size of the tree or shrub. The water
use in gallons per day for the drip irrigation in each model was estimated from data from
the University of Arizona, College of Agriculture website. The water use for an average
diameter of fourteen feet was selected from the website and inputted into the model. The
square footage for trees and shrubs was then measured from the aerial photographs and
divided into fourteen foot diameter parcels. This method was tested when estimating the
drip irrigation values for the hub service area, but the results were very poor. Applying
the water use data for one diameter so broadly introduced a lot of error into the model.
Therefore, all the data was collected or estimated for the other parameters first and then
the drip was increased until the total water use equaled the expected value given by
Metro Water. This method was used for both the hub and main service area models. In
fact, when collecting data for drip irrigation for the main service area, only the percentage
of homes with trees and bushes was noted and the average area was not measured at all.

The real-estate information helped to determine the water use for toilets, showers,
faucets, evaporative coolers and rainwater collection. To do this, housing units were
chosen at random and the number of three-quarter baths, half baths and full baths; the age
of the housing unit; the square footage of the housing unit and the type of cooling unit
were noted. From the information on the different sizes of baths, the percentages of
toilets, showers and faucets were determined. Additional faucets were added to include
those in the kitchen. The year the housing unit was built was also recorded to determine
the percentage of units grouped into the following three areas: pre-1980, 1980-1994 and
after 1994. These percentages are then used to determine the number of pre-1980, 1980-
1994 and low flow appliances, namely toilets and faucets, present in the service area. The
two models assume that all housing units have the same appliances that were installed the
year they were built. The average square footage plus additional footage for the garage
was used when determining the water saved by rainwater collection.

The remaining parameter values, most notably, the percentage of housing units with
fountains, water reuse systems and rainwater collection, are not based on any collected
data due to the scarcity of information. The current values for these parameters in the
models are based on the estimations suggested by current literature, but are not specific to
the service areas.

Key Findings

The Metropolitan Water District has been modeled in its entirety by developing two
models, one tailored to the hub region and one to the main service area. The models
currently include the indoor and outdoor water uses for single-family and multi-family
housing, as well as, the cost of this water use. In addition to providing the user with
current information on the water usage of the service areas, experimentation with chosen
conservation parameters is also an integral part of the models. This information not only
includes total water use, but divides the results into individual water demands.

References

Goggle Earth
Schedule F-1 Parts 1 and 2 (provided by Metro Water)
Wright, Glenn C. Irrigating Citrus Trees. College of Agriculture, The University of
   Arizona: Feb. 2000. < http://cals.arizona.edu/pubs/crops/az1151.pdf>
Water Resources Research Center, College of Agriculture, The University of Arizona.
   Chapter Five: The Many Uses of Water. Water in the Tucson Area: Seeking
   Sustainability. http://www.ag.arizona.edu/AZWATER/publications/sustainability/
Zillow.com
Metro Water Service Areas

Tucson Metro Area. Not to Scale. “Metropolitan Domestic Water Improvement District -
Tucson, Arizona USA”. 2003. Metro Water District.
 ( 10 April 2008).
You can also read