Diabolic dilemmas of COVID-19: An empirical study into Dutch society's trade-offs between health impacts and other effects of the lockdown
←
→
Page content transcription
If your browser does not render page correctly, please read the page content below
Munich Personal RePEc Archive

Diabolic dilemmas of COVID-19: An
empirical study into Dutch society’s
trade-offs between health impacts and
other effects of the lockdown

Chorus, Caspar and Sandorf, Erlend Dancke and Mouter,
Niek

Delft University of Technology, Stirling University, Delft University
of Technology

20 May 2020

Online at https://mpra.ub.uni-muenchen.de/100575/
MPRA Paper No. 100575, posted 27 May 2020 06:24 UTC
Diabolic dilemmas of COVID-19: An empirical study into Dutch
society’s trade-offs between health impacts and other effects of the
lockdown

 Caspar G. Chorusa*, Erlend Dancke Sandorfb, Niek Moutera
a
 Department of Engineering Systems and Services, Faculty of Technology, Policy and Management,
Delft University of Technology
b
 Economics Division, Stirling Management School, University of Stirling

*
 Corresponding author: c.g.chorus@tudelft.nl

 Working paper, version 20 May 2020.

 Paper has been submitted for peer review.

 Please contact corresponding author before citing.

Abstract

We report and interpret preferences of a representative sample of the Dutch adult population for
different strategies to end the so-called ‘intelligent lockdown’ which their government had put in
place in response to the COVID-19 pandemic. Using a discrete choice experiment, we invited
participants to make a series of choices between policy scenarios aimed at relaxing the lockdown,
which were specified not in terms of their nature (e.g. whether or not to allow schools to re-open)
but in terms of their effects along seven dimensions. These included health-related aspects, but also
impacts on the economy, education, and personal income. From the observed choices, we were able
to infer the implicit trade-offs made by the Dutch between these policy effects. For example, we find
that the average citizen, in order to avoid one fatality directly or indirectly related to COVID-19, is
willing to accept a lasting lag in the educational performance of 18 children, or a lasting (>3 years)
and substantial (>15%) reduction in net income of 77 households. We explore heterogeneity across
individuals in terms of these trade-offs by means of latent class analysis. Our results suggest that
most citizens are willing to trade-off health-related and other effects of the lockdown, implying a
consequentialist ethical perspective. We find that the elderly, known to be at relatively high risk of
being affected by the virus, are relatively reluctant to sacrifice economic pain and educational
disadvantages for the younger generation, to avoid fatalities. We also identify a so-called taboo
trade-off aversion amongst a substantial share of our sample, being an aversion to accept morally
problematic policies that simultaneously imply higher fatality numbers and lower taxes. We explain
various ways in which our results can be of value to policy makers in the context of the COVID-19 and
future pandemics.

Keywords: Covid-19, Coronavirus, choice experiment, consequentialism, taboo trade-offs
1. Introduction

The outbreak of COVID-19 in the Netherlands, as in many other countries, was followed by an
unprecedented package of measures, summarized by the Dutch government under the name
"intelligent lockdown". As of mid-March, schools closed, as did bars and restaurants and countless
other service providers (the so-called 'contact professions' such as barbers). Working from home
became the norm, large scale events such as professional football matches were banned, and a
variety of other commandments and urgent stipulations were issued (RIVM, 2020).

In this first, acute phase of the crisis, there was a sense of unanimity and focus in Dutch society: the
goals (i.e., delaying and limiting the spread of COVID-19, protecting the vulnerable, preventing the
collapse of the healthcare system) justified the means (i.e., a lockdown that in effect crippled large
parts of society). In this acute and early phase of the crisis, deontological ethics were dominant in the
public debate: most agreed that everything had to be done to keep the healthcare sector afloat and
to keep the loss of human lives at an absolute minimum.

About a month and a half after the lockdown was put in place, pressure on the healthcare system
started to gradually decrease, accompanied by a downward trend in the number of COVID-19 related
fatalities. This signaled a gradual transition into the chronic phase of the crisis, with public attention
shifting to the question of how the country should deal with the lurking threat of a virus that can
always re-emerge until a vaccine or medicine is found, while at the same time keeping society
functioning at a reasonable level.

In public debate it is becoming clear that this chronic phase also entails a different - consequentialist
- ethical perspective in which all possible effects of government policy are taken into account. In
addition to health related effects, this includes, for example, the impacts of the lockdown on the
economy at large and one’s personal income, as well as possible educational disadvantages due to
distance learning. During this transition to the chronic phase of the crisis, the call for further opening
up society has been getting louder and louder. The Dutch government -like many other ones- as a
result found itself in a position where diabolic dilemmas had to be faced; these were the words
uttered by Prime Minister Mark Rutte, during an April 21 press conference watched by almost half of
the Dutch population (Rijksoverheid, 2020).

The morning after this press conference, our survey including a choice experiment went live. Our aim
was to explore the preferences of the Dutch population in terms of the weights they assigned to
various effects of policies aimed at relaxing the lockdown. Specifically, we wanted to know if the
Dutch were willing to trade health effects (such as avoiding fatalities) against other effects (e.g. on
the economy), and if so, what would be their willingness to sacrifice economy- and education-related
suffering for a reduction in fatalities and in pressure on the national healthcare system be. Their
choices in the experiment would also allow us to learn to what extent the transition from a
deontological ethics perspective (requesting a full focus on saving human lives) was indeed gradually
being replaced by a consequentialist one which puts weight on all foreseeable consequences of
government policy.

This paper reports the outcomes of this choice experiment. To be sure, the main contribution of this
paper is not a methodological one: the use of choice experiments to study citizens’ preferences and
trade-offs involving fatalities and injuries has a long tradition in health economics (Skedgel et al.,
2015), traffic safety analysis (Hensher et al., 2009) and environmental and climate change economics
(Travisi and Nijkamp, 2008). What makes our study unique is that it is the first one, to the best of our
knowledge, that applies this tool to survey and investigate a society’s willingness to make the highly
salient and morally troubling trade-offs associated with policies aimed at relaxing a lockdown that
was imposed in the wake of the COVID-19 crisis.
Our study is confined to the Dutch society in particular. But, although we acknowledge that countries
across the world differ widely in terms of their culture and as well in terms of the actions taken by
their governments, we nonetheless observe that in many other countries, debates are raging that are
similar to as the one being held in the Netherlands; take for example the heated exchange in the
United States of America (e.g., as reported by CNN on 24 March 2020) between governor Cuomo of
New York who emphasizes that avoiding fatalities takes priority and that one cannot weigh a human
live against the economic impact of the lockdown, versus president Trump who is keen to re-open
the economy and professes that the cure cannot be worse than the disease. Given the similarities
between various countries in terms of the societal tension between health- and economy-related
effects of lockdowns, we expect our results to hold lessons well beyond the Dutch context - and that
is why we submitted this paper to a journal with an international audience.

The remainder of this paper is organized as follows: section 2 presents the data collection effort,
followed by section 3 which discusses the econometric methodology used to analyses the data. In
section 4 we present and interpret our results, followed by a section discussing the main conclusions
and policy recommendations that can be drawn from our study. We wish to note that our choice of
wording and focus points in this paper is driven by a wish to provide relevant, actionable information
to policy-makers, practitioners and scholars alike.

2. Data
The data were gathered on 22 April, the day following a widely watched press conference by Prime
Minister Mark Rutte (21 April) during which he emphasized that most of the lockdown-policies and
regulations would remain in place until further notice, while some others were slightly relaxed. In
hindsight, the days surrounding this press conference can be considered the height of the public
debate in the Netherlands about how to weigh the health-related effects of the lockdown with other
societal impacts such as economic standstill, educational problems and mental health crises, among
others. Note that early May, after our data were collected, another press conference was held in
which the government - quite unexpectedly in the eyes of many - announced a series of lockdown
relaxations to take place in the months of May through September (also in this, the Netherlands was
not alone, as various other countries were contemplating and deciding for relaxations of lockdowns
in this same time period).

Respondents were sampled from the online Kantar Public panel, with a view to be representative
with respect to the Dutch population in terms of age, gender and education level. Sampled
respondents were informed about the purpose of the study, the methods employed and the specific
policy impacts that were part of the choice experiment. Our data collection effort was approved by
the Ethics Board of the Delft University of Technology. We received 1,009 completed and usable
responses1.

Before presenting the specifics of our so-called discrete choice experiment (DCE), we briefly discuss
this data collection tool. The method of using DCEs to elicit latent preferences and trade-offs of
citizens regarding the effects of government policies has a long pedigree in domains as diverse as
transport (e.g. Mouter and Chorus, 2016), environment and climate adaptation (Hausman et al.,
1995; Hoyos, 2010) and health care (Bekker-Grob et al., 2012; Lancsar and Louviere, 2008) . Also
when it comes to morally challenging trade-offs involving human lives, DCEs have been widely used
in these contexts (e.g. de Blaeij et al., 2003; Mouter et al., 2017). The core idea behind using DCEs is
that choices made by respondents between policy scenarios specified in terms of their outcomes on

1
 We excluded two respondents who stated ‘other’ gender because parameters associated with this socio-
demographic variable could not be identified empirically due to insufficient variation in the data. All models are
run with these respondents excluded for comparability.
various dimensions, can be used to identify the weights that respondents assign to each of these
dimensions. These weights may then be used to: i) learn about the relative importance attached by
society to various policy-impact dimensions, ii) predict levels of support for and opposition against
specific policies, and iii) convert various policy dimensions into monetary terms in order to allow for a
cost-benefit assessment. In this paper, the emphasis is on the first of these potential uses of DCEs.

Compared to other approaches to identify citizens’ preferences and trade-offs, such as directly asking
respondents to assign a weight to various policy-impact dimensions, the DCE methodology has
important advantages. For example, it is well known that people find it very difficult to make explicit
their preferences and decision making processes (Nisbett & Wilson, 1977), especially in the context
of morally sensitive topics such as the one we study (Haidt, 2001). That is, people have great
difficulty in reliably answering questions such as “how many cases of lasting mental health effects are
you willing to tolerate, to avoid one COVID-19 related fatality?”. The DCE approach circumvents such
difficulties, by asking respondents to choose between policy scenarios specified in terms of these and
other impacts; based on choices made, the implied relative weights attached to different dimensions
can then be inferred by the analyst. In contrast to standard opinion polls which typically ask
questions that are too generic to be of much policy relevance (“should lockdown policies be focused
more on reducing health effects or economic effects?”), the DCE approach presents very specific
policy scenarios (e.g. in terms of numerically expressed policy effects), allowing for the assessment of
particular policies based on the estimated weights.

It is important to note however, that despite its advantages and the resulting widespread use of
DCEs, there is a continuing debate about their reliability (Arrow et al., 1993; McFadden and Train,
2017). Important insights from this debate can be put as follows: i) if available, the analysis of choices
observed in real life (e.g. during referenda) is to be preferred over the analysis of choices made in
hypothetical conditions such as a DCE; ii) if a DCE is used, care must be exercised to ensure
‘consequentiality’, i.e. respondents must feel that their choices will have consequences in real
life (Carson et al., 2014); iii) the choice situations presented in the DCE must be realistic and must
align with experiences and considerations held by respondents (see e.g. Carson and Groves, 2007;
Johnston et al., 2017). A recent study in the context of immigration policies in Switzerland, which
compared the outcomes of a DCE with those obtained by an actual referendum, shows that a
properly designed DCE is likely to generate reliable insights into the weights assigned by the
population to various policy dimensions, also in morally salient contexts (Hainmueller et al., 2015).

Translating these generic lessons to our specific DCE, we are confident that the policy scenarios
presented to respondents were well aligned with the current public debate in the Netherlands; in
fact, the dimensions covered in our study were widely discussed in the media during the weeks
preceding the data collection. Furthermore, we made a substantial effort to ensure consequentiality,
by (truthfully) informing respondents that the outcomes of this study would be shared with high-
ranking policy makers at relevant Ministries and the Netherlands Institute of Public Health (RIVM).
Qualitative statements provided by respondents after having completed our survey (not reported
here) strengthen our belief that most took the experiment very seriously. In the absence of an actual
referendum on the topic, we believe that given these precautions our DCE provides a useful and
reliable alternative to collect choice data.

In our DCE, we vary policy scenarios along seven dimensions, covering those impacts of the lockdown
that received the most attention in the public debate during the weeks preceding the data collection
effort. Table 1 shows the different policy dimensions (‘attributes’) and the ranges of their scores
(‘attribute levels’). Note that these attributes and their levels were selected in an iterative process of
pilot testing and discussions with colleagues at other Dutch universities as well as analysts at relevant
Ministries and the Netherlands Institute of Public Health (RIVM). For instance, we decided in
consultation with analysts from the Dutch government to select the three health dimensions
(‘increase in the number of deaths caused by the coronavirus’, ‘increase in the number of lasting
physical injuries caused by the coronavirus’, ‘increase in the number of lasting mental injuries caused
by the coronavirus’) instead of using the concept of Quality Adjusted Life Years (QALY) which is
popular in health economics studies (Lancsar et al., 2020; van de Wetering et al., 2015). The reason
being that the public debate in the Netherlands focused on these three dimensions and not on
QALYs. Moreover, in a draft version of the DCE we made a distinction between increases in the
number of deaths in different age groups (younger than 50 years, 50 - 75 years, older than 75 years);
however, policy makers and analysts from the RIVM argued that this was not a relevant variable for
the trade-offs they faced in their decision-making. Hence, we decided not to distinguish between
different age-groups in our final experiment.

We chose to execute a so-called unlabeled DCE, which did not specify policies in terms of their
nature (e.g. reopening schools, or sport clubs) but rather focused on the impact of policies on a range
of dimensions. The advantage of such an unlabeled approach is that it allows policy makers to use
our results for the assessment of (combinations of policies), including those that are currently not on
the table but might be considered in later phases of the crisis.

The experiment was designed using statistical techniques which ensure that every choice task
contains a maximum amount of information on the weights assigned by respondents to different
policy impacts (Hensher et al., 2005). More specifically, respondents were asked to choose between
two policy packages described by seven attributes. The attributes and their levels (note that each
attribute had three possible levels) were combined into 18 choice tasks using a d-efficient design
with priors obtained from a pilot study (Scarpa and Rose, 2008). The 18 choice tasks were blocked
into two blocks of 9 choice tasks and respondents were randomly allocated to a block when entering
the survey. We show a sample choice task and the text shown to respondents in Figure 1.

 Figure 1: A choice task as presented to respondents
Table 1: An overview of the attributes and their levels

 Attribute Level 0 Level 1 Level 2 Level 3

 Increase in number of 8 000 11 500 15 000 18 500
 deaths caused by the
 corona crisis directly or
 indirectly (e.g. due to
 postponed operations)†

 Increase in number of 30 000 80 000 130 000 180 000
 people with lasting
 physical injuries caused by
 the corona crisis directly or
 indirectly (e.g. due to
 postponed operations)†

 Increase in number of 20 000 80 000 140 000 200 000
 people with lasting mental
 injuries caused by the
 corona crisis†

 Increase in number of 10 000 90 000 170 000 250 000
 children with lasting
 educational disadvantages
 caused by the corona
 crisis†

 Increase in number of 400 000 700 000 1 000 000 1 300 000
 households with net
 income loss of more than
 15% for a period of more
 than 3 years caused by the
 corona crisis

 One-off corona tax per €1 000 €2 500 €4 000 €5 500
 household in 2023

 Work pressure in the Same work Work pressure lies Work Work
 health sector during the pressure as between the pressure is pressure is
 period May 1st 2020 - before the current situation the same as higher than
 January 1st 2021 coronavirus and the situation in the in the
 crisis before the current current
 coronavirus crisis situation situation
†
 Respondents were informed that while these changes occur during the period May 1st 2020 -
January 1st 2021, their effects are lasting.

3. Econometric approach

Our econometric approach involves three model types. First, we estimate a classical linear in
parameters binary logit model, where each attribute is assigned a corresponding parameter (its
weight) in a process of maximum likelihood estimation; see Ben-Akiva and Lerman (1985) for details
of this model and how it is estimated. Second, we estimate a latent class model where we identify
different classes in the population with people assigned to the same class have the same weight-
parameter, i.e., have the same preferences (Greene and Hensher, 2003; Train, 2009). Third,
acknowledging the moral salience of the choice context, we estimate a so-called taboo trade- off
aversion model (Chorus et al., 2018). This model estimates a penalty parameter for each policy
scenario that involves higher numbers of fatalities and lower taxes. Such a policy may be considered
taboo by some respondents, as it in effect assigns a monetary value to a human life. The taboo trade-
off aversion effect has a rich tradition in moral psychology (see e.g. Fiske and Tetlock, 1997), and in
the context of a DCE analysis it can be captured by means of an interaction effect, which indicates a
potential dislike for a combination of particular attribute values beyond the separate direct effects of
those attributes. Following Chorus et al. (2018) we implement the taboo trade off by constructing a
dummy variable which equals 1 if a policy scenario presented in a choice task featured lower taxes
and more fatalities than the other scenario that was presented in the same choice task. The
accompanying parameter estimate represents the level of taboo trade off aversion (we estimate such
a parameter for each latent class, to explore heterogeneity in terms of taboo trade off aversion).

To introduce notation, let respondent ’s utility from choosing alternative in choice situation be
described by the linear-in-the-parameters random utility function in Equation 1.

 = + (1)

Here, is a row-vector of parameters to be estimated, column vector contains the levels of the
attributes of the alternative and represents an Extreme Value Type I distributed error term.
Under these standard assumptions, the probability that respondent chooses alternative in choice
situation can be expressed by the multinomial logit model (McFadden, 1974).

 ( )
Pr( | )= (2)
 ∑

The multinomial logit model (MNL) is the workhorse in discrete choice analysis, but is limited by its
inability to describe unobserved preference heterogeneity and its inability to accommodate for the
fact that each respondent made a series of choices (panel effect). A latent class model allows for
capturing such unobserved preference heterogeneity and panel effects. Let be the probability
that respondent ’s preferences can be described by the th vector (class).

 = (3)
 ∑

Here, is a class specific constant, a vector of parameters to be estimated, and a vector of
respondent specific variables. We set the th constant and parameter vector to zero for
identification. Every class has a unique vector of attribute weights which describes the
behavioral preferences of respondents assigned to the specific class. This enables us to take the
panel structure of the data into account by allowing parameter weights to vary across classes while
at the same time ensuring that they are constant across choices made by the same individual. Now,
we can express the probability that respondent chooses alternative in a particular choice task
as:

Pr( | , ) = ∑ ∙ (4)
 ∑

Likewise, for example, we can express the choice probability that respondent chooses alternative
in every choice task as:
Pr( … … | … … , ) = ∑ ∙∏ (4) ∑ Given our linear treatment of attributes, society’s willingness-to-sacrifice a particular attribute (e.g. a certain number of households facing an enduring and substantial reduction in net income) in order to avoid one fatality which is directly or indirectly related to COVID-19 can be calculated straightforwardly: it is given by the ratio between the fatality parameter and the parameter associated with the other policy effect (e.g. the parameter associated with the number of households facing income reductions). In the context of the latent class models, the sample level willingness to sacrifice is the weighted sum of the willingness to sacrifice per latent class, where the weights are the unconditional class probabilities. 4. Results Table 2 shows the estimation results of our final model specifications. The binary logit model is our point of departure; note that the outcomes of this base model have been published in a Dutch- language Economics journal (Chorus and Mouter, 2020). Also note that in order to ensure that all obtained parameters were within the same order of magnitude (which helps guaranteeing parameter stability in latent class models), we rescaled our attributes; see Table 2 for the resulting units. Signs are as expected: people dislike increases in: the number of fatalities related (directly or indirectly) to COVID-19; the number of people with lasting physical and mental injuries; the number of children left with an educational disadvantage; the number of households with persistent income loss; personal income taxes; and work pressure in the health care sector. All parameters are highly significant. The implied average (in the Dutch society) willingness to sacrifice in order to avoid one fatality directly or indirectly related to COVID-19 equals (rounded to the nearest integer): 10 cases of lasting physical injuries; 15 cases of lasting mental health problems; 18 children with lasting educational disadvantage; 77 households with long term decline in net income. In terms of the relative importance of working pressure in the health care system, we find that a one- step increase in the working pressure corresponds (in terms of disutility to Dutch society) to 3,636 additional fatalities, underscoring the dominant role this variable has been playing in the public debate. In terms of the willingness to accept a higher (one-off) tax to help avoid fatalities, we find that the average Dutch citizen weighs an additional 10,000 fatalities as heavily as a one-off tax increase per household of 2,912 Euro. This implies that Dutch society as a whole (which consists of approximately eight million households) is willing to sacrifice a total additional one-off tax burden of approximately 2.32 million euros. This ‘value of life’ estimate allows us to indirectly validate our DCE: the Dutch Road Authority (Rijkswaterstaat, 2020) employs a value of life metric of 2.61 million Euro in the context of road safety analysis, which is in line with our results. Note that the average life lost in road accidents is likely to be that of a younger person than the average life lost due to COVID-19 directly or indirectly, e.g. due to postponed treatment – this may partially explain that our estimate is lower than the official number used by Dutch authorities. A meta-study done by the OECD (2012) reports a median (across studies) value of life of 2.8 million Euros, which also is of the same order of magnitude as our result. As a final indirect validation of our estimates, it is worth pointing out that the factor ten which we obtain between the weight of a fatality versus the weight of a lasting physical injury is about the same as the factor used for Dutch road safety analysis (Rijkswaterstaat, 2020).
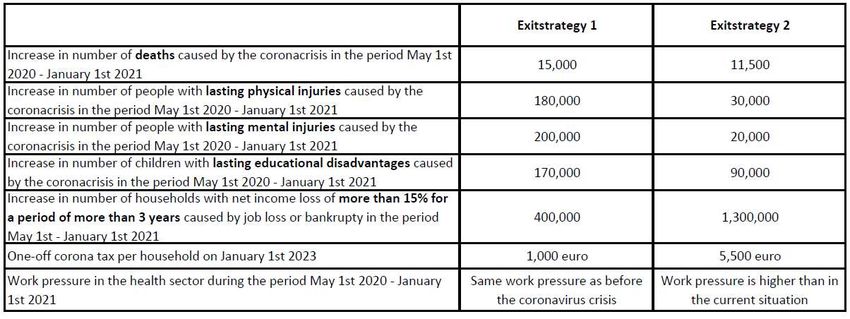
Before moving to the more sophisticated latent class model, we briefly illustrate how the basic binary
logit model can be used to forecast support for policy scenarios. Take the choice between the two
policy scenarios depicted in Figure 1. Based on the parameter estimates (and applying equations 1
and 2 given in the previous section), the model predicts that 54% of Dutch society would prefer Exit
strategy 1, while the remaining 46% would prefer Exit strategy 2. If the government would be able to
reduce the impact of strategy 1 on mental health problems (e.g. by means of aggressively increasing
funding in mental health care programs), in effect reducing the number of effected individuals from
200 thousand to 20 thousand (i.e., the same number as in strategy 2), the model predicts that
support would rise to 70%. Of course, such a mental health program would come with a cost. If the
government decides to increase the one-off corona tax in strategy 1 from 1,000 euro to 1,250 euro
(which would generate approximately 2 billion euro in taxes) to achieve these mental health
benefits, our model predicts that that would still imply a 69% preference level for strategy 1 over
strategy 2.

The latent class (LC) model with three classes fits the data significantly better than the binary logit
model, even when adjusting for additional parameters2; this is to be expected, given that opinions
expressed in the public debate on this topic vary widely. It should be noted, however, that the
improvement in fit cannot be entirely attributed to the model describing unobserved heterogeneity,
since the LC model also takes the panel structure of the data into account whereas the binary logit
model does not. We see that all parameters in all classes are of the expected sign and significant at
the 1% level, except for the increase in the number of deaths in Class 1, which is insignificant, and
income loss (number of households facing a loss in income) in Class 1, which is only significant at the
5% level.

Looking at the weights obtained per class, the classes can be interpreted as follows: class 1, in which
older people are over-represented, is not sensitive to changes in the number of fatalities, but it does
care about the other policy-impacts and in particular puts a very high negative weight on tax
increases. This finding is interesting in light of the fact that individuals in this class are known to be
much more likely to die when contracting the virus, compared to younger people. This class contains
about 20% of the sample. Class 2, in which higher educated people are over-represented, is highly
sensitive to each policy-impact, except for the tax increase (to which they are equally sensitive as the
average respondent). This class contains about 29% of our sample. Class 3 (containing about 51% of
our sample) is as sensitive as the average respondent to fatality numbers and working pressure in the
healthcare sector, while being considerably less sensitive to the other policy effects. In terms of
ethical perspectives, class 2 can be described as a typical consequentialist class, weighing every single
impact of the exit strategies. Class 1 weighs most impacts, but not the one which moral psychologists
call the sacred attribute (human life), while Class 3 can be considered to combine the
consequentialist and deontological perspectives as it weighs all effects, but puts less (compared to
the average respondent) weight on effects other than the increase in fatalities and the working
pressure in the healthcare system.

2
 The latent class model with four classes did fit the data even better, but we are of the opinion that reasonable
class sizes and interpretability are important factors to consider in model selection when the purpose is to
generate behavioral insights for policy analysis. We tested a wide range of alternative models and
specifications; these are available from the corresponding author upon request.
Table 2: Results from the estimation of the Binary Logit and three-class latent class model

 Binary Logit Class 1 Class 2 Class 3

Attribute Est S.e. Est S.e. Est S.e. Est S.e.
Deaths
(per 10,000) -0.572 *** 0.034 -0.291 0.220 -1.026 *** 0.137 -0.568 *** 0.059
Physical injuries
(per 100,000 cases) -0.588 *** 0.023 -1.160 *** 0.158 -1.254 *** 0.111 -0.313 *** 0.051
Mental injuries
(per 100,000 cases) -0.382 *** 0.019 -0.280 *** 0.097 -1.098 *** 0.109 -0.194 *** 0.041
Educational disadvantage
(per 100,000 children) -0.308 *** 0.014 -0.526 *** 0.072 -0.883 *** 0.096 -0.093 *** 0.031
Income loss (per
1,000,000 households) -0.729 *** 0.039 -1.005 ** 0.429 -1.899 *** 0.204 -0.381 *** 0.075
Tax increase
(per 1,000 Euro) -0.196 *** 0.008 -0.981 *** 0.079 -0.234 *** 0.030 -0.059 *** 0.017
Increase in working
pressure (health sector) -0.206 *** 0.012 -0.446 *** 0.119 -0.269 *** 0.039 -0.189 *** 0.020

Class membership functions

Constant -2.900 *** 0.853 -1.838 *** 0.506 0 (fixed)

Male 0.000 (fixed) 0.000 (fixed) 0 (fixed)

Female -0.291 0.210 0.435 * 0.225 0 (fixed)

Education low 0.000 (fixed) 0.000 (fixed) 0 (fixed)

Education med -0.154 0.285 0.119 0.347 0 (fixed)

Education high -0.020 0.296 1.048 *** 0.341 0 (fixed)

Age 18 - 25 0.000 (fixed) 0.000 (fixed) 0 (fixed)

Age 26 - 35 2.130 ** 0.830 -0.116 0.418 0 (fixed)

Age 36 - 45 1.762 ** 0.843 0.337 0.397 0 (fixed)

Age 46 - 55 2.508 *** 0.823 0.396 0.403 0 (fixed)

Age 56 - 65 2.584 *** 0.829 0.841 ** 0.401 0 (fixed)

Age 66 - 74 2.465 *** 0.847 1.246 *** 0.453 0 (fixed)

Age 75 + 1.868 ** 0.889 0.677 0.540 0 (fixed)

Average class probability 0.1945 0.2924 0.5131

LL -5709.358 -5350.995

Number of observations 9081 9081

K 7 41

Adj. Rho Sq. 0.0918 0.1434

BIC 11482.51 11075.66
* significant at 10%, ** significant at 5%, *** significant at 1%.

In Table 3, we show the sample level willingness-to-sacrifice estimates for each sub-group (segment)
of respondents implied by our class probability functions, as well as the associated 95% confidence
intervals3. In terms of willingness to accept an increase in the number of people with lasting physical
injuries to avoid one fatality directly or indirectly related to COVID-19, we find several differences
between subgroups of respondents. For example, highly educated women between 66 and 74 years
old are only willing to accept an increase of 10 people with lasting physical injuries for each avoided
fatality, whereas men between 18 and 25 with low education are willing to accept an increase of
more than 16 people. Looking at the other attributes, we see the same general trend: older people in
general, and women in particular, are willing to sacrifice (per fatality avoided) fewer people with
mental injuries, fewer children at an educational disadvantage and fewer households with an income
loss, compared to younger people, and younger men in particular. In many cases the differences in
willingness to sacrifice between segments of the population are large and significant judging by the
non-overlapping confidence intervals.

 [INSERT TABLE 3 ABOUT HERE]

Our results for taboo trade-off aversion can be summarized as follows (for succinctness and
readability, we report the estimation results in Appendix B): in a three class model where we allowed
all parameters, including the taboo trade off aversion parameter, to vary between classes, we find
two classes with a significant and negative ‘utility’ associated with policies that involve
(simultaneously) a lower tax and a higher number of fatalities than the alternative policy. For one of
these classes, containing 21% of our sample, the taboo penalty is large (-1.44) whereas in the other
class, containing 54% of our sample, the taboo penalty is of moderate size (-0.42). A third class
(containing a minority of 25% of our sample), surprisingly features a large and positive taboo
parameter (2.35), implying that individuals in this class actually prefer the combination of lower taxes
and higher fatality rates beyond their separate effects4.

5. Conclusions

In the face of the COVID-19 crisis, policy makers worldwide need to make choices with far-reaching
consequences, based on a wide variety of considerations and limited by a high degree of uncertainty.
The results of our research are no more than a small piece of this immense puzzle. However, we

3
 Standard errors were calculated using the Delta method (Daly et al., 2012).

4
 Some caution is in place though, when interpreting these taboo aversion-related outcomes: correlations
between the taboo penalty-parameters on the one hand, and the tax- and fatality-related parameters on the
other hand, were quite high (>0.80). This indicates, that the model struggles to disentangle the direct effects of
the tax- and fatality-variables on the one hand, and their joint indirect effect through the taboo-dummy
variable on the other hand. This is not surprising, given that the experiment was not designed specifically to
pick up these two separate but subtly related effects in an econometrically efficient way. We performed
additional analysis to verify our results, including a three class model where the taboo parameter was allowed
to vary across classes while the attribute weights were constrained to be the same across classes, as well as a
three class model where the taboo parameter was allowed to vary across classes while the attribute weights
were fixed to their binary logit sample-level estimates. Estimation results for these models (which can be
obtained from the corresponding author) showed that, as expected, they had a much lower model fit than the
original taboo trade off aversion model which allowed the taboo parameter and the attribute weights to vary
across classes, but they avoid high correlations between parameters. These models identified a taboo aversion
for only about 10% of the sample. This indicates that more research is needed to draw definite conclusions
about the role of taboo trade off aversion in the context of lockdown relaxation policies.
believe that our results can be useful in four ways in developing policies with regard to a possible
(further) relaxation of the intelligent lockdown in the Netherlands as well as in other countries.

First, upon inspection of our estimation results, including the Latent Class models, we find that most
of our respondents appear to have an eye for both the direct health-related effects of relaxation
policies and their indirect impacts on mental health, the economy, education and their personal
financial situation. Although health impacts are of great importance to our respondents, most seem
to employ a consequentialist ethical perspective by balancing various dimensions of policies. This
suggests that an open view of policy makers, taking into account the broad range of effects of
policies, would be appreciated by citizens. Nonetheless, our result that about three quarters of our
sample have a moderate to high aversion against making ‘taboo tradeoffs’, suggest that governments
need to be careful in their decision-making and in how policies and their effects are communicated
to the public.

Secondly, our results enable policy makers to determine whether the net valuation in society is
positive or negative for particular combinations of policy effects. Take, for example, the situation in
which a certain policy measure leads to an expected reduction in deaths, but also to an increase in
the number of people who will suffer from lasting mental health problems such as depression. Our
results indicate that, if the number of people who experience such problems as a result of the policy
is fewer than about fifteen per avoided death, the policy is assessed positively by the average Dutch
person. However, if the number is higher, the net valuation is negative.

Thirdly, our results enable policy makers to identify levels of support and opposition among Dutch
citizens for different policy packages. For example, the binary logit model, fed by the estimated
parameters, can be used to determine the percentage of Dutch people who support a certain policy
package over another one, as was illustrated in Section 4. For this, the effects of the policy package
must of course be within the scope of those presented in Table 1.

And fourthly, our model can be used to determine whether the average adult citizen prefers a
proposed policy package over a particular reference case. This reference case can be “a continuation
of current policy” or “no restrictive measures”. For this, it is important that the reference case can be
specified in terms of the impacts on (a selection of) the attributes included in our experiment.

In terms of avenues for further research, we believe that assessing the spatial and temporal
transferability of our results is important, before conclusions for other countries, and for future
situations, can be derived. Regarding geography, given the considerable differences across countries
in terms of culture, COVID-19 policies and the effects of the virus on society, we expect that weights
for various policy effects will differ across countries. Moreover, some effects included in our
experiment might be less relevant in other countries, while factors excluded in our study may be
highly relevant in different geographical contexts. Regarding timing, we expect that as the situation
changes in terms of the threat of the virus and the visibility of e.g. economic effects, societal
preferences and trade-offs will change, too. We plan to test for this, by repeating our experiment in
due time. Nonetheless, we feel that having these timely estimates available helps policy makers in
the short term. In general, we hope that future study efforts aimed at measuring citizens’ tradeoffs
and preferences concerning the policy impacts of lockdowns in different countries (triggered by
COVID-19 or another pandemic) can use our study as a stepping stone.

Acknowledgements
Caspar Chorus acknowledges funding from the European Union’s Horizon 2020 research and
innovation program under the European Research Council Consolidator grant BEHAVE-724431.
Erlend Dancke Sandorf acknowledges funding from the European Union’s Horizon 2020 research and
innovation program under the Marie Sklodowska-Curie grant agreement No 793163 (INSPiRE). The
TU Delft Covid-19 Response fund sponsored our data collection effort (we are grateful to Kantar
Public for charging us less than their usual rate per obtained respondent). We received valuable input
from the following individuals during the development and implementation of the experiment:
Marion Collewet, Shannon Spruit, Anatol Itten, Ardine de Wit, Adrienne Rotteveel, Mattijs Lambooij,
Anita Suijkerbuijk, Paul van Gils, Toep van Dijk, Suzanne Pietersma, Denny Borsboom, Tessa Blanken
Job van Exel, Sake de Vlas, Hans Heesterbeek, and Rob Kooij.

References

Arrow, K., Solow, R., Portney, P.R., Leamer, E.E., Radner, R., Schuman, H., 1993. Report of the NOAA
Panel on Contingent Valuation 67.

Bekker-Grob, E.W. de, Ryan, M., Gerard, K., 2012. Discrete choice experiments in health economics: a
review of the literature. Health Econ. 21, 145–172. https://doi.org/10.1002/hec.1697

Ben-Akiva, M.E., Lerman, S.R., 1985. Discrete Choice Analysis: Theory and Application to Travel
Demand. MIT Press.

Carson, R.T., Groves, T., 2007. Incentive and informational properties of preference questions.
Environ. Resour. Econ. 37, 181–210. https://doi.org/10.1007/s10640-007-9124-5

Chorus, C.G., Mouter, N., 2020. Nederlanders maken een brede afweging bij afbouw
coronamaatregelen [WWW Document]. ESB.nu. URL https://esb.nu/esb/20059795/nederlanders-
maken-een-brede-afweging-bij-afbouw-coronamaatregelen (accessed 5.18.20).

Chorus, C.G., Pudāne, B., Mouter, N., Campbell, D., 2018. Taboo trade-off aversion: A discrete choice
model and empirical analysis. J. Choice Model. 27, 37–49.
https://doi.org/10.1016/j.jocm.2017.09.002

CNN, 2020. March 24 coronavirus news https://edition.cnn.com/world/live-news/coronavirus-
outbreak-03-24-20-intl-hnk/h_44013c5762fb661bf7c1cd2329fd5ebc (accessed 20 May 2020)

Daly, A., Hess, S., de Jong, G., 2012. Calculating errors for measures derived from choice modelling
estimates. Transp. Res. Part B Methodol., Emerging and Innovative Directions in Choice Modeling 46,
333–341. https://doi.org/10.1016/j.trb.2011.10.008

de Blaeij, A., Florax, R.J.G.M., Rietveld, P., Verhoef, E., 2003. The value of statistical life in road safety:
a meta-analysis. Accid. Anal. Prev. 35, 973–986. https://doi.org/10.1016/S0001-4575(02)00105-7

Fiske, A.P., Tetlock, P.E., 1997. Taboo Trade-offs: Reactions to Transactions That Transgress the
Spheres of Justice. Polit. Psychol. 18, 255–297. https://doi.org/10.1111/0162-895X.00058

Greene, W.H., Hensher, D.A., 2003. A latent class model for discrete choice analysis: contrasts with
mixed logit. Transp. Res. Part B Methodol. 37, 681–698. https://doi.org/10.1016/S0191-
2615(02)00046-2

Hausman, J.A., Leonard, G.K., McFadden, D., 1995. A utility-consistent, combined discrete choice and
count data model Assessing recreational use losses due to natural resource damage. J. Public Econ.
56, 1–30. https://doi.org/10.1016/0047-2727(93)01415-7
Hensher, D.A., Rose, J.M., Ortúzar, J. de D., Rizzi, L.I., 2009. Estimating the willingness to pay and
value of risk reduction for car occupants in the road environment. Transp. Res. Part Policy Pract. 43,
692–707. https://doi.org/10.1016/j.tra.2009.06.001

Hoyos, D., 2010. The state of the art of environmental valuation with discrete choice experiments.
Ecol. Econ. 69, 1595–1603. https://doi.org/10.1016/j.ecolecon.2010.04.011

Johnston, R.J., Boyle, K.J., Adamowicz, W. (Vic), Bennett, J., Brouwer, R., Cameron, T.A., Hanemann,
W.M., Hanley, N., Ryan, M., Scarpa, R., Tourangeau, R., Vossler, C.A., 2017. Contemporary Guidance
for Stated Preference Studies. J. Assoc. Environ. Resour. Econ. 4, 319–405.
https://doi.org/10.1086/691697

Lancsar, E., Gu, Y., Gyrd-Hansen, D., Butler, J., Ratcliffe, J., Bulfone, L., Donaldson, C., 2020. The
relative value of different QALY types. J. Health Econ. 70, 102303.
https://doi.org/10.1016/j.jhealeco.2020.102303

Lancsar, E., Louviere, J., 2008. Conducting Discrete Choice Experiments to Inform Healthcare Decision
Making. PharmacoEconomics 26, 661–677. https://doi.org/10.2165/00019053-200826080-00004

McFadden, D., 1974. Conditional logit analysis of qualitative choice behavior, in: Frontiers in
Econometrics. Academic Press, New York, pp. 105–152.

McFadden, D., Train, K., 2017. Contingent Valuation of Environmental Goods: A Comprehensive
Critique. Edward Elgar Publishing.

Mouter, N., van Cranenburgh, S., van Wee, B., 2017. Do individuals have different preferences as
consumer and citizen? The trade-off between travel time and safety. Transp. Res. Part Policy Pract.
106, 333–349. https://doi.org/10.1016/j.tra.2017.10.003

OECD, 2012. Mortality Risk Valuation in Environment, Health and Transport Policies - OECD.

Rijksoverheid, 2020. Video's persconferenties coronavirus
https://www.rijksoverheid.nl/onderwerpen/coronavirus-covid-19/coronavirus-beeld-en-
video/videos-persconferenties (accessed 20 May 202)

Rijkswaterstaat, 2020. Steunpunt Economishe Expertise [WWW Document]. URL
https://www.rwseconomie.nl (accessed 5.17.20).

RIVM, 2020 – Rijksinstituut voor Volksgezondheid en Milieu: Achtergrondinformatie bij het nieuwe
coronavirus https://www.rivm.nl/coronavirus-covid-19/achtergrond (accessed 20 May 2020)

Scarpa, R., Rose, J.M., 2008. Design efficiency for non-market valuation with choice modelling: how
to measure it, what to report and why*. Aust. J. Agric. Resour. Econ. 52, 253–282.
https://doi.org/10.1111/j.1467-8489.2007.00436.x

Skedgel, C., Wailoo, A., Akehurst, R., 2015. Societal Preferences for Distributive Justice in the
Allocation of Health Care Resources: A Latent Class Discrete Choice Experiment. Med. Decis. Making
35, 94–105. https://doi.org/10.1177/0272989X14547915

Train, K.E., 2009. Discrete Choice Methods with Simulation, 2nd ed. Cambridge University Press.
Travisi, C.M., Nijkamp, P., 2008. Valuing environmental and health risk in agriculture: A choice
experiment approach to pesticides in Italy. Ecol. Econ. 67, 598–607.
https://doi.org/10.1016/j.ecolecon.2008.01.011

van de Wetering, L., van Exel, J., Bobinac, A., Brouwer, W.B.F., 2015. Valuing QALYs in Relation to
Equity Considerations Using a Discrete Choice Experiment. PharmacoEconomics 33, 1289–1300.
https://doi.org/10.1007/s40273-015-0311-x
Appendix A: Description of the attributes
Below we present the full explanation of the seven attributes as presented to the participants of our
discrete choice experiments.

Increase in the number of deaths
Due to the outbreak of the coronavirus the number of Dutch people who die will be higher in the
period 1 May 2020 - 1 January 2021 than in a state of affairs without an outbreak of the coronavirus
in the Netherlands. The number of deaths increases due to the coronavirus, or because treatments
for a condition other than corona should be postponed. We assume that the actual number of deaths
caused by the coronavirus will be higher than the number of deaths reported by the Dutch National
Institute for the Public Health. The increase in the number of deaths will depend on the exit strategy
selected by the government.

Number of people with lasting physical health problems
Due to the outbreak of the coronavirus the number of Dutch people who suffer from lasting physical
injuries will be higher in the period 1 May 2020 - 1 January 2021 than in a state of affairs without an
outbreak of the coronavirus in the Netherlands. For example, infection with the coronavirus can lead
to lasting damage to the lungs and other organs. The number of people with lasting physical
problems may also increase because treatments for conditions other than corona have to be
postponed. This research is only about the increase of permanent physical complaints and not about
temporary physical complaints. The increase in lasting physical injuries will depend on the exit
strategy selected by the government.

Number of people with lasting mental health problems
Due to the outbreak of the coronavirus the number of Dutch people who suffer from lasting mental
injuries will be higher in the period 1 May 2020 - 1 January 2021 than in a state of affairs without an
outbreak of the coronavirus in the Netherlands. Relatives of people who die from corona can face
lasting mental injuries (because they have to say goodbye in a different way), but lasting mental
injuries can also arise as a result of loneliness, depression, burnout complaints or domestic violence.
This research is only about the increase in lasting mental injuries and not about the temporary
psychological complaints. The increase in lasting mental injuries will depend on the exit strategy
selected by the government.

Additional number of children who experience lasting educational disadvantage when leaving
secondary school
Due to the outbreak of the coronavirus the number of children who are left with a permanent
educational disadvantage will be higher in the period 1 May 2020 - 1 January 2021 than in a state of
affairs without an outbreak of the coronavirus in the Netherlands. With a lasting educational
disadvantage we mean that a child leaves secondary school later than in a situation without the
corona crisis or that a child obtains a lower diploma. Hence, we exclude the children who face a
short-term educational disadvantage, but who will catch up before leaving secondary school. For
many preschoolers, for example, it will apply that they can catch up in a few years. To be clear, we
consider the number of children who no longer make up for the educational disadvantage after the
corona crisis. The increase in the number of children who face lasting educational disadvantage will
depend on the exit strategy selected by the government.

Number of households that suffer a long-term decline in net income of at least 15%
The Dutch government supports the economy with a large financial support package. Yet, as a result
of the corona crisis, people will lose their jobs in the period May 1, 2020 - January 1, 2021 and
companies will make less profit or even go bankrupt. The increase
in the number of households that will suffer a decline in net income of at least 15% for a long time
(at least three years long) will depend on the exit strategy selected by the government.

One-off increase in taxes
The support packages cost a lot of money. Imagine that in the future part of these costs will be
covered through taxation. In this study, we look at a one-off tax on January 1st 2023. The one-off tax
that we will present is an average. Households with a high income will have to pay a higher amount
than households with a lower income. The one-off corona tax may differ between the exit strategies.

Work pressure in the healthcare sector
The exit strategies differ in the workload for people who work in the health care sector (think of
nurses and doctors, but also cleaners and laboratory employees). In this study, four options are
possible: 1) The workload in the healthcare sector in the period 1 May 2020 - 1 January 2021 remains
the same as in the current situation; 2) The workload is considerably higher than in the current
situation; 3) The workload drops considerably to a level that lies between the current situation and
the period before the corona crisis (early February 2020); 4) The workload even drops back to the
level before the corona crisis (February 2020).
Appendix B: Taboo trade off aversion estimation results (latent class model with three classes)

 Class 1 Class 2 Class 3
Utility function Est S.e. Est S.e. Est S.e.
Deaths (x1,000) 0.3606 0.4069 -2.3775 *** 0.7079 -0.3617 *** 0.1169
Physical injuries (x10,000) -1.4584 *** 0.1967 -1.0712 *** 0.1104 -0.3884 *** 0.0536
Mental injuries (x10,000) -0.3308 *** 0.1000 -1.3759 *** 0.2467 -0.2002 *** 0.0381
Educational disadvantage (x10,000) -0.5652 *** 0.0671 -0.8658 *** 0.0921 -0.1421 *** 0.0349
Income loss (x100,000) -0.9984 ** 0.3406 -1.9064 *** 0.2194 -0.4669 *** 0.0751
Tax increase (x1,000 euro) -1.1407 *** 0.1379 0.0716 *** 0.1324 -0.1244 *** 0.0315
Increase in WP -0.3870 *** 0.0795 -0.2065 *** 0.0469 -0.2139 *** 0.0193
Taboo -1.4388 *** 0.6993 2.3497 *** 1.0961 -0.4195 *** 0.1921
Class probability functions
Constant -0.9535 *** 0.1397 -0.7497 *** 0.2288 0 (fixed, ref)
Average class probability 0.2074 0.2543 0.5382
LL -5375.2530
N 9081
K 26
Adj. Rho Sq. 0.1419
BIC 10987.4700
Physical Mental Educational Income Tax Increase in
Description 95% CI 95% CI 95% CI 95% CI 95% CI 95% CI
 injuries injuries disadvantage loss increase WP

Men aged 18-25 with low (15.7 , (24.92 , (49.08 , (130.8 , (-3.13 , 0.00 (-0.55 ,
education 16.13 16.57) 25.83 26.73) 52.06 55.04) 131.22 131.65) 0.85 4.83) 0.56)
Men aged 18-25 with (15.68 , (24.78 , (48.79 , (130.2 , (-3.03 , 0.00 (-0.54 ,
medium education 16.09 16.5) 25.66 26.53) 51.69 54.59) 130.61 131.02) 0.85 4.73) 0.54)
Men aged 18-25 with high (14.25 , (21.9 , (41.88 , (115.87 , (-2.33 , 0.00 (-0.47 ,
education 14.59 14.93) 22.62 23.33) 44.19 46.49) 116.21 116.55) 0.77 3.87) 0.48)
Men aged 26-35 with low (12.35 , (21.22 , (38.26 , (105.7 , (-2.6 , 0.00 (-0.57 ,
education 12.76 13.16) 22.09 22.96) 40.67 43.09) 106.07 106.44) 0.65 3.89) 0.57)
Men aged 26-35 with (12.77 , (21.62 , (39.46 , (108.39 , (-2.44 , 0.00 (-0.52 ,
medium education 13.14 13.51) 22.44 23.26) 41.83 44.19) 108.74 109.1) 0.67 3.78) 0.52)
Men aged 26-35 with high (11.86 , (19.65 , (34.81 , (98.81 , (-1.92 , 0.00 (-0.47 ,
education 12.16 12.47) 20.35 21.04) 36.74 38.67) 99.1 99.4) 0.62 3.16) 0.47)
Men aged 36-45 with low (13.07 , (21.67 , (39.94 , (110.09 , (-2.64 , 0.00 (-0.52 ,
education 13.46 13.85) 22.49 23.32) 42.39 44.84) 110.45 110.81) 0.69 4.03) 0.52)
Men aged 36-45 with (13.33 , (21.84 , (40.54 , (111.5 , (-2.49 , 0.00 (-0.48 ,
medium education 13.69 14.05) 22.61 23.39) 42.92 45.3) 111.85 112.19) 0.71 3.91) 0.49)
Men aged 36-45 with high (12.09 , (19.13 , (34.16 , (98.5 , (-1.84 , 0.00 (-0.47 ,
education 12.38 12.66) 19.75 20.37) 35.99 37.83) 98.77 99.05) 0.64 3.12) 0.47)
Men aged 46-55 with low (11.03 , (19.31 , (33.3 , (94.59 , (-2.21 , 0.00 (-0.54 ,
education 11.39 11.75) 20.16 21.01) 35.33 37.35) 94.91 95.24) 0.57 3.34) 0.55)
Men aged 46-55 with (11.48 , (19.7 , (34.52 , (-2.03 , 0.00 (-0.49 ,
medium education 11.8 12.12) 20.49 21.28) 36.5 38.47) 97.69 (97.38 , 98) 0.59 3.22) 0.49)
Men aged 46-55 with high (10.58 , (17.53 , (29.51 , (87.38 , (-1.53 , 0.00 (-0.48 ,
education 10.84 11.1) 18.19 18.84) 31.05 32.6) 87.63 87.88) 0.55 2.62) 0.49)
Men aged 56-65 with low (10.64 , (18.43 , (31.26 , (90.35 , (-1.9 , 0.00 (-0.52 ,
education 10.96 11.28) 19.22 20.02) 33.07 34.88) 90.65 90.95) 0.55 2.99) 0.53)
Men aged 56-65 with (11.04 , (18.72 , (32.23 , (92.67 , (-1.74 , (-0.48 ,
medium education 11.33 11.62) 19.45 20.17) 33.98 35.73) 92.95 93.23) 0.57 2.88) 0.00 0.48)
Men aged 56-65 with high (10.09 , (16.26 , (26.62 , (81.71 , (-1.19 , (-0.51 ,
education 10.32 10.54) 16.83 17.41) 27.91 29.21) 81.93 82.15) 0.52 2.23) 0.00 0.51)
Men aged 66-74 with low (10.75 , (18.02 , (30.65 , (89.59 , (-1.7 , (-0.5 ,
education 11.04 11.33) 18.72 19.43) 32.29 33.93) 89.87 90.15) 0.56 2.81) 0.00 0.51)
Men aged 66-74 with (11.04 , (18.13 , (31.18 , (91.03 , (-1.56 , (-0.47 ,
medium education 11.31 11.58) 18.78 19.42) 32.76 34.35) 91.30 91.57) 0.57 2.71) 0.00 0.48)
Men aged 66-74 with high (9.96 , (15.28 , (24.7 , (78.48 , (-0.98 , (-0.56 ,
education 10.16 10.36) 15.76 16.25) 25.80 26.91) 78.68 78.88) 0.52 2.01) 0.00 0.57)
Men aged 75 and older (12.59 , (20.8 , (37.81 , (105.31 , (-2.17 , (-0.51 ,
with low education 12.94 13.29) 21.52 22.25) 39.93 42.04) 105.64 105.97) 0.66 3.5) 0.00 0.52)
Men aged 75 and older (12.81 , (20.87 , (38.23 , (106.43 , (-2.08 , (-0.49 ,
with medium education 13.15 13.49) 21.57 22.27) 40.31 42.38) 106.76 107.08) 0.68 3.43) 0.00 0.5)
Men aged 75 and older (11.46 , (17.85 , (31.14 , (92.27 , (-1.46 , (-0.52 ,
with high education 11.74 12.02) 18.41 18.97) 32.71 34.29) 92.53 92.8) 0.61 2.67) 0.00 0.52)
Women aged 18-25 with (15.34 , (24.03 , (47.05 , (126.73 , (-2.9 , (-0.51 ,
low education 15.74 16.15) 24.88 25.74) 49.83 52.62) 127.13 127.53) 0.83 4.56) 0.00 0.52)
Women aged 18-25 with (15.25 , (23.77 , (46.46 , (125.45 , (-2.77 , (-0.5 ,
medium education 15.62 16) 24.58 25.39) 49.13 51.8) 125.84 126.22) 0.83 4.42) 0.00 0.5)
Women aged 18-25 with (13.48 , (20.2 , (37.87 , (107.77 , (-1.94 , (-0.48 ,
high education 13.77 14.07) 20.83 21.45) 39.87 41.86) 108.07 108.37) 0.73 3.4) 0.00 0.49)
Women aged 26-35 with (12.92 , (21.53 , (39.48 , (108.91 , (-2.49 , (-0.51 ,
low education 13.30 13.67) 22.33 23.13) 41.87 44.25) 109.27 109.62) 0.68 3.85) 0.00 0.51)
Women aged 26-35 with (13.2 , (21.72 , (40.16 , (110.5 , (-2.34 , (-0.47 ,
medium education 13.55 13.89) 22.48 23.24) 42.48 44.81) 110.84 111.18) 0.70 3.74) 0.00 0.48)
Women aged 26-35 with (12.01 , (19.09 , (33.96 , (97.88 , (-1.69 , (-0.45 ,
high education 12.28 12.55) 19.69 20.29) 35.75 37.54) 98.14 98.41) 0.63 2.96) 0.00 0.46)
Women aged 36-45 with (13.26 , (21.35 , (39.57 , (109.94 , (-2.44 , (-0.47 ,
low education 13.62 13.97) 22.10 22.86) 41.91 44.25) 110.29 110.63) 0.71 3.86) 0.00 0.48)
Women aged 36-45 with (13.38 , (21.29 , (39.62 , (110.17 , (-2.29 , (-0.45 ,
medium education 13.71 14.03) 22.01 22.72) 41.86 44.11) 110.49 110.82) 0.71 3.72) 0.00 0.46)
Women aged 36-45 with (11.83 , (17.93 , (31.66 , (94.04 , (-1.51 , (-0.5 ,
high education 12.08 12.32) 18.46 18.98) 33.27 34.89) 94.28 94.52) 0.63 2.77) 0.00 0.5)
You can also read