Diagnostic accuracy of the different hormonal tests used for the diagnosis of autonomous cortisol secretion
←
→
Page content transcription
If your browser does not render page correctly, please read the page content below
www.nature.com/scientificreports
OPEN Diagnostic accuracy of the different
hormonal tests used
for the diagnosis of autonomous
cortisol secretion
Marta Araujo‑Castro 1,4,5*, Ana García Cano2, Lucía Jiménez Mendiguchía2,
Héctor F. Escobar‑Morreale3,4,5,6 & Pablo Valderrábano3,5
To evaluate the diagnostic accuracy of the different tests commonly used in the evaluation of adrenal
incidentalomas (AIs) for the identification of autonomous cortisol secretion (ACS) and comorbidities
potentially related to ACS. In a retrospective study of patients with AIs ≥ 1 cm, we evaluated the
diagnostic reliability and validity of the dexamethasone suppression test (DST), urinary free cortisol
(UFC), ACTH, late-night salivary cortisol (LNSC), and dehydroepiandrosterone-sulphate (DHEAS) for
the diagnosis of comorbidities potentially related to ACS. Diagnostic indexes were also calculated
for UFC, ACTH, LNSC, and DHEAS considering DST as the gold standard test for the diagnosis of
ACS, using three different post-DST cortisol thresholds (138 nmol/L, 50 nmol/L and 83 nmol/L). We
included 197 patients with AIs in whom the results of the five tests abovementioned were available.
At diagnosis, 85.9% of patients with one or more AIs had any comorbidity potentially related to ACS,
whereas 9.6% had ACS as defined by post-DST cortisol > 138 nmol/L. The reliability of UFC, ACTH,
LNSC, and DHEAS for the diagnosis of ACS was low (kappa index < 0.30). Of them, LNSC reached the
highest diagnosis accuracy for ACS identification (AUC = 0.696 [95% CI 0.626–0.759]). The diagnostic
performances of these tests for comorbidities potentially related to ACS was poor; of them, the DST
was the most accurate (AUC = 0.661 [95% CI 0.546–0.778]) and had the strongest association with
these comorbidities (OR 2.6, P = 0.045). Patients presenting with increased values of both DST and
LNSC had the strongest association with hypertension (OR 7.1, P = 0.002) and with cardiovascular
events (OR 3.6, P = 0.041). In conclusion, LNSC was the test showing the highest diagnosis accuracy for
the identification of ACS when a positive DST was used as the gold standard for its diagnosis. The DST
test showed the strongest association with comorbidities potentially related to ACS. The definition
of ACS based on the combination of elevated DST and LNSC levels improved the identification of
patients with increased cardiometabolic risk.
Adrenal incidentalomas (AIs) are defined as adrenal masses detected in imaging tests performed for reasons unre-
lated to adrenal d
isease1–3. All patients with AIs must be evaluated to exclude malignancy and hormonal e xcess4,5.
Even though imaging tests offer a high sensitivity and a reasonable specificity for the diagnosis of malignancy,
functional evaluation of AIs is often challenging. Particularly, consensus is lacking regarding the definition and
diagnostic criteria of autonomous cortisol secretion (ACS), which may associate an increased cardiometabolic
morbidity and mortality and might appear in as many as 20% of patients with A Is6. Nonetheless, ACS is usually
defined by an incomplete cortisol suppression in response to the overnight 1 mg dexamethasone suppression
test (DST), in the absence of clinical data specific of Cushing’s syndrome4,5,7,8. Nevertheless, other tests such as
24-h urinary free cortisol (UFC), late-night salivary cortisol (LNSC) and plasma adrenocorticotropic hormone
(ACTH) have been proposed for the definition of ACS. However, there are few data comparing these tests and the
DST for the diagnosis of ACS; hence, UFC, LNSC and ACTH are usually used as tools to complement the results
1
Neuroendocrinology Unit, Department of Endocrinology & Nutrition, Hospital Universitario Ramón y Cajal,
Madrid, Spain. 2Department of Biochemistry, Hospital Universitario Ramón y Cajal, Madrid, Spain. 3Department
of Endocrinology & Nutrition, Hospital Universitario Ramón y Cajal, Madrid, Spain. 4Universidad de Alcalá, Madrid,
Spain. 5Instituto Ramón y Cajal de Investigación Sanitaria (IRYCIS), Madrid, Spain. 6Centro de Investigación
Biomédica en Red Diabetes y Enfermedades Metabólicas Asociadas (CIBAERDEM), Madrid, Spain. *email:
marta.araujo@salud.madrid.org
Scientific Reports | (2021) 11:20539 | https://doi.org/10.1038/s41598-021-00011-4 1
Vol.:(0123456789)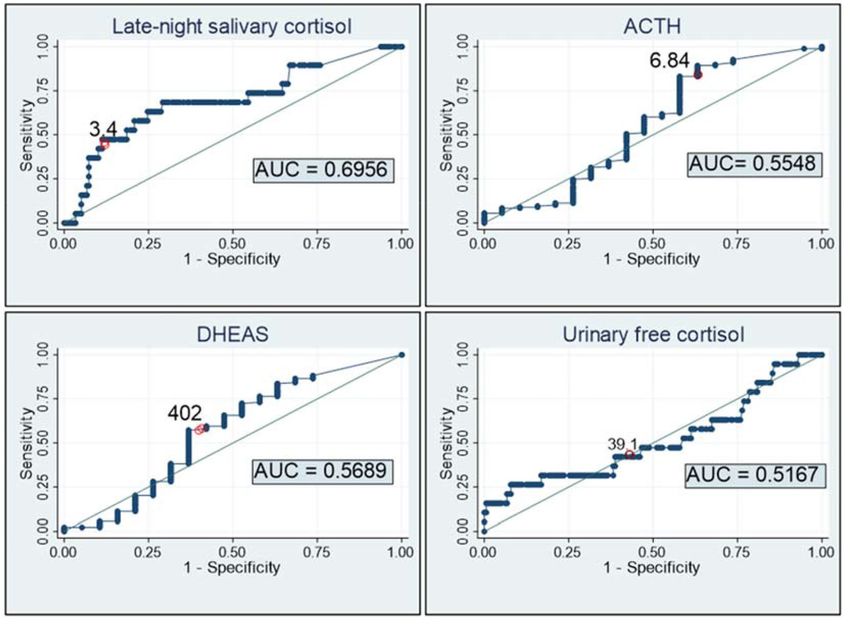
www.nature.com/scientificreports/
Pa
ents with adrenal incidentalomas
evaluated with DST between 2013-2020 at
our ins
tu
on (n=730)
EXCLUSION CRITERIA:
-Adrenal carcinoma (n=2)
-Primary aldosteronism (n=12)
-Pheochromocytoma (n=4)
-Overt Cushing´s syndrome (n=2)
-Adrenal metastasis (n=1)
-Missing informaon in DHEAS
(n=269), ACTH (n=222), LNSC (n=364)
or UFC (n=354)
STUDY COHORT
(n=197)
Figure 1. Study cohort. DST dexamethasone suppression test, LNSC late-night salivary cortisol, UFC urinary
free cortisol.
of the DST in this setting. On the other hand, under usual routine clinical practice conditions, the diagnostic
performance of the DST and complementary tests for the identification of comorbidities potentially related to
ACS seems to be poor.
We hypothesized that the identification of cardiometabolic morbidities potentially related to ACS in patients
with AIs could improve with the use of a panel of tests usually used to characterize adrenal function, either
individually or in combination. Moreover, we evaluated the reliability and validity for the diagnosis of ACS—
considering an increased DST result as the gold standard for ACS definition following current European clinical
guidelines2—of four tests routinely used for the evaluation of adrenal function, including plasma ACTH, age and
sex adjusted serum dehydroepiandrosterone sulphate (DHEA-S) levels, UFC and LNSC.
Methods
Patients. We retrospectively queried the electronic registry of the hormone laboratory of Hospital Univer-
sitario Ramón y Cajal to identify all patients in whom a DST had been performed between 2013 and 2020. We
reviewed their medical records and selected those patients aged 18 to 90 years-old who presented with inciden-
tally discovered unilateral and/or bilateral AIs of at least 10 mm in the largest diameter. We excluded patients
with: (i) known diagnosis of hereditary syndromes associated with adrenal tumours; (ii) chronic treatment with
glucocorticoids or drugs that might affect dexamethasone metabolism; (iii) treatment with oral hormonal con-
traceptives during the 6 weeks preceding the test; (iv) AIs identified during the extension study of an extra-
adrenal cancer; (v) patients with overt syndromes of adrenal hormone excess, (vi) adrenocortical carcinoma;
(vii) adrenal metastasis from extra-adrenal tumours; and (viii) missing information in the results of one or more
of the five tests evaluated here) (Fig. 1). We analysed patients’ data obtained during their initial evaluation and
at their last available follow-up visit.
Clinical evaluation. Demographics information such as age and sex; presence of comorbidities potentially
related to ACS (hypertension, type 2 diabetes, obesity, dyslipidaemia, cerebrovascular and cardiovascular dis-
ease); body mass index (BMI); and systolic and diastolic blood pressure were extracted from medical records.
Obesity was defined by a BMI equal or greater to 30 kg/m2. Hypertension was defined as systolic blood pressure
equal to or greater than 140 mmHg and/or diastolic blood pressure equal to or greater than 90 mmHg, or treat-
ment with blood pressure lowering medications. Diagnosis of type 2 diabetes and dyslipidaemia was based on
current standards9,10. Cardiovascular disease was defined as ischemic heart disease or heart failure, and cerebro-
vascular disease as transient ischemic attack or acute stroke.
Management decision regarding AIs—either observation or surgery—after the last follow-up visit was also
registered.
Biochemical and hormonal evaluation. Routine biochemical profile after an 8 h overnight fasting was
performed at diagnosis and at the last follow-up visit available. Biochemical profiles included fasting plasma
glucose, total cholesterol, LDL-cholesterol, HDL-cholesterol, triglycerides and HbA1c (the latter was available
only in 55 cases). Hormonal studies at the initial evaluation included urinary catecholamines and/or urinary
metanephrines, DST, UFC, ACTH, DHEA-S and LNSC.
DST, UFC, ACTH, age- and sex-adjusted DHEA-S, and LNSC were analysed as continuous and categorical
variables. When considering the DST test as the gold standard for the calculation of reliability and validity for
ACS diagnosis of the others tests of adrenal function, we evaluated not only the post-DST cortisol 138 nmol/L
Scientific Reports | (2021) 11:20539 | https://doi.org/10.1038/s41598-021-00011-4 2
Vol:.(1234567890)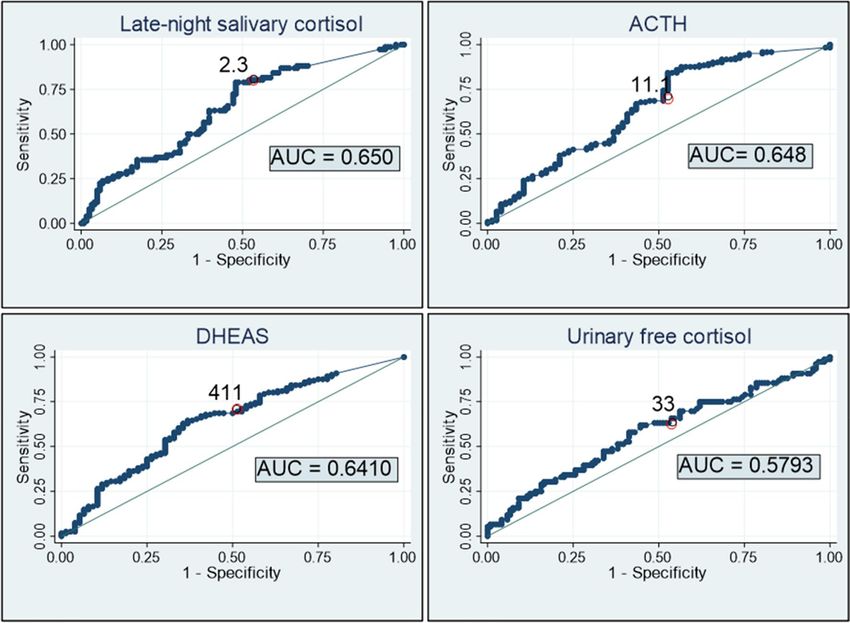
www.nature.com/scientificreports/
Age Female ( ng/mL) Age Males ( ng/mL)
18–24 150–3402 20–29 2800–6400
25–34 150–2982 30–39 1200–5200
35–49 150–2582 40–49 950–5300
50–59 260–2000 50–59 700–3100
60–69 130–1300 60–69 420–2900
70–79 280–1750 70–89 280–1750
Table 1. References ranges for DHEAS levels (ng/mL).
(5.0 µg/dL)2, but also the 50 nmol/L (1.8 µg/dL) and 83 nmol/L (3.0 µg/dL) cut-off values. For the evalua-
tion of the diagnosis accuracy of the DST for the identification of comorbidities potentially related to ACS,
the > 50 nmol/L threshold was employed, based on the results of the ROC curves and on previous studies that
found that this cut-off was the most sensitive for this purpose11–15. UFC levels above the upper limit of the
reference range in our laboratory were considered elevated. Besides, patients with UFC levels within the refer-
ence range were classified into two groups—normal-low or normal-high UFC levels—using 1930 nmol/24 h
(70 µg/24 h) as threshold, because this was the value that associated the highest specificity for the diagnosis of
ACS according to the results of the ROC curve. Patients with UFC levels two-fold above the reference range were
diagnosed with overt Cushing’s syndrome and excluded from the study (Fig. 1). ACTH levels below 2 pmol/L
(10 pg/mL) were considered low. LNSC levels above the upper limit of the reference range in our laboratory
were considered elevated. DHEA-S levels were considered to be elevated or decreased according to age- and
sex-specific reference ranges in our laboratory.
Laboratory assays. As we have previously reported16, urine and serum cortisol were measured by immu-
nochemiluminescence assays in an Architect i2000 systems Abbott Diagnostics platform, with an intra-assay
coefficient of variation (CV) < 10%; the normal range was 102–535 nmol/L (3.7–19.4 µg/dL) for serum cortisol
and < 3862 nmol/24 h (140 µg/24 h) for 24-h urine cortisol. LNSC was measured by electroimmunochemilu-
minescence in a Cobas 6000 Roche autoanalyser, with an intra-assay CV < 10% and a reference range lower
than 157 nmol/L (< 5.7 µg/dL). The determination of ACTH was performed by immunochemiluminescence
assays (we used Immulite 2000 Siemens before 2019 and Liaison XL Diasorin thereafter), with an intra-assay
CVs < 10%. Normal values for ACTH were between 2.0–10.1 pmol/L (9–46 pg/mL) for the Immulite assay and
1.0–10.7 pmol/L (5–49 pg/mL) for the Liaison XL assay. DHEA-S was measured by immunochemiluminescence
assay in Immulite 2000 Siemens system; with intra-assay CV < 15%. Reference ranges for DHEA-S were age- and
sex-specific (Table 1).
Imaging studies. At diagnosis, abdominal computed tomography or magnetic resonance imaging were
obtained in all AIs patients. Tumour size (largest diameter), uni- or bilaterality, presence of necrosis, calcification
and atypical characteristics, lipid content and radiodensity measured in Hounsfield units (HU) were registered.
In bilateral AIs, the recorded tumour size was that of the largest AI. The adrenal tumour was classified as having
rich lipid content when attenuation was low (< 10 HU) in a CT performed without contrast administration or
when the washout in a CT with contrast was rapid (> 60% absolute washout or > 40% relative washout)4. Com-
puted tomography was repeated in 99 patients and magnetic resonance imaging was repeated in 80 patients
during follow-up.
Statistical analysis. We checked continuous variables for normality using the Shapiro–Wilk test, and for
homogeneity of the variances using Levene’s test. Categorical variables were expressed as counts and percent-
ages, whereas continuous variables were expressed as mean ± standard deviation or median and interquartile
range (IQR) as appropriate. Odds ratios (with 95% confidence intervals) and mean differences were calculated as
association measures using logistic regression models or lineal regression β coefficients. For variables following
the normal distribution, we used Student’s t test to compare differences between two groups. The chi-square test
was used for the comparison of categorical variables between independent groups. Cox regression analysis was
used to estimate hazard ratios during follow-up. Reliability was evaluated with the kappa index and the specific
positive and negative agreement indexes. Nonparametric receiver-operator curve (ROC) analysis was used to
determine the diagnostic accuracy for the diagnosis of ACS, and of comorbidities potentially related to ACS, of
the different hormonal tests, either individually or in combination. In all cases, a two-tailed P value < 0.05 was
considered as statistically significant. All statistical analyses were performed using STATA 15 (StataCorp. 2017.
Stata Statistical Software: Release 15. College Station, TX: StataCorp LLC).
Ethical approval. All procedures performed in the participants of the study were in accordance with the
ethical standards of the institutional research committee and with the 1964 Helsinki declaration and its later
amendments or comparable ethical standards. The study was approved by the Ethics Committee of Hospital
Universitario Ramón y Cajal on February 14, 2019.
Scientific Reports | (2021) 11:20539 | https://doi.org/10.1038/s41598-021-00011-4 3
Vol.:(0123456789)www.nature.com/scientificreports/
Parameter Value
Clinical data
Age, years 64.5 ± 10.0
Female sex 57.4% (n = 113)
Comorbidities potentially related to ACS 85.9% (n = 152)
Diabetes 22.3% (n = 44)
Hypertension 57.9% (n = 114)
Dyslipidaemia 49.0% (n = 96)
Obesity 31.0% (n = 61)
Cerebrovascular disease 1.0% (n = 2)
Cardiovascular disease 10.7% (n = 21)
Body mass index (kg/m2) (n = 133) 30.3 ± 6.3
Systolic blood pressure (mmHg) (n = 159) 137.7 ± 16.9
Diastolic blood pressure (mmHg) (n = 159) 79.7 ± 9.6
Analytical data
Fasting plasma glucose, nmol/L (mg/dL) (n = 197) 5.87 ± 1.6 (105.7 ± 28.9)
HbA1c (%) (n = 55) 6.2 ± 0.9
LDL-c, nmol/L (mg/dL) (n = 143) 30.03 ± 8.3 (115.5 ± 31.8)
HDL-c, nmol/L (mg/dL) (n = 143) 13.96 ± 4.6 (53.7 ± 17.7)
Triglycerides, nmol/L (mg/dL) (n = 193) 1.17 ± 0.6 (110.2 ± 51.1)
DST, nmol/L(µg/dL) (n = 197) 66.2 ± 74.5 (2.4 ± 2.7)
Urinary free cortisol, nmol/24 h (µg/24 h) (n = 197) 1092.41 ± 791.1 (39.6 ± 28.7)
ACTH, pmol/L (pg/mL) (n = 197) 3.59 ± 2.6 (16.3 ± 11.6)
DHEAS (ng/mL) (n = 197) 596.2 [IQR = 150–2840]
Late-night salivary cortisol, nmol/L(µg/dL) (n = 197) 110.3 ± 118.6 (4.0 ± 4.3)
Radiological data
Tumor size (mm) (n = 197) 22.2 ± 10.5
Bilaterality (n = 197) 30.0% (n = 59)
Tumor rich in lipidic content (n = 155) 85.2% (n = 132)
Table 2. Baseline characteristics of the cohort (n = 197). ACTH adrenocorticotropic hormone, ACS
autonomous cortisol secretion, DST dexamethasone suppresion test, DHEAS dehydroepiandrosterone
sulphate, LDL-c low-density lipoprotein cholesterol, HDL-c high-density lipoprotein cholesterol, HbA1c
hemoglobin A1c.
Informed consent. The Ethical committee of Hospital Universitario Ramón y Cajal approved the waiver for
informed consent given the retrospective nature of the study.
Results
Cardiometabolic profile at diagnosis and during follow‑up. Following inclusion and exclusion cri-
teria, 197 patients—of a total of 709 patients with AIs consecutively evaluated between 2013 and 2020 at our
centre—were included in the analysis. No statistically significant differences were detected between the patients
with AIs included or excluded in the study with the exception of higher cortisol post-DST, lower ACTH levels
and a larger tumour size in the former (Supplementary Material Table S1). Baseline characteristics of the cohort
included in the present study are summarized in Table 2. At diagnosis, 19 patients (9.6%) had ACS (as defined
by a post-DST cortisol > 138 nmol/L) and 169 patients (85.9%) presented with one or more comorbidities poten-
tially related to ACS. The prevalence of obesity was of 31%, yet no statistically significant differences in the post-
DST cortisol levels were found between patients with and without obesity (59 ± 49 nmol/L vs 71 ± 82 nmol/L,
respectively, P = 0.316). Four patients presenting with non-functioning AIs > 4 cm underwent adrenalectomy,
and active surveillance was carried out in the remainder. After a median follow-up of 30.6 (IQR = 2.0–114.7)
months, 6 out of 120 patients with non-functioning AIs developed ACS and 23 patients developed one or more
new comorbidities: 20 (23.0%) developed dyslipidaemia; 6 (8.8%) developed hypertension; 9 (11.5%) became
obese; 6 (4.5%) were diagnosed with type 2 diabetes; and 5 (3.2%) suffered a cardiovascular event. No cerebro-
vascular events were registered during follow-up.
Reliability and accuracy of LNSC, UFC, ACTH and DHEAS for the diagnosis of ACS. The degree
of agreement (reliability) of LNSC, UFC, ACTH and DHEA-S for the diagnosis of ACS was low, independently
of the DST threshold used for the definition of ACS, with kappa indexes below 0.3 for all tests. However, the spe-
cific negative agreement was high, around 80–90%. Regarding their validity, the highest specificity was reached
when ACS definition was based on the 138 nmol/L (5.0 µg/dL) threshold. Nevertheless, all tests had poor sensi-
tivity for the diagnosis of ACS independently of the DST threshold employed for the diagnosis of ACS (Table 3).
Scientific Reports | (2021) 11:20539 | https://doi.org/10.1038/s41598-021-00011-4 4
Vol:.(1234567890)www.nature.com/scientificreports/
Kappa index Specific Po+ (%) Specific Po− (%) Sensitivity (%) Specificity (%) PPV (%) NPV (%)
Considering the gold standard of ACS a DST > 138 nmol/L (5.0 µg/dL)
UFC > 1931 nmol/24 h 0.157 24.4 91.2 26.3 90.4 22.7 92.0
ACTH < 2 pmol/L 0.039 18.4 76.9 42.1 66.3 11.8 91.5
LNSC > 157 nmol/L 0.283 36.7 91.0 47.4 88.2 30.0 94.0
Low sex- and age-
0.082 20.9 83.8 36.8 77.0 14.6 91.9
adjusted DHEA-S
Considering the gold standard of ACS a DST > 83.0 nmol/L (3.0 µg/dL)
UFC > 1931 nmol/24 h 0.239 34.9 87.6 26.8 92.9 50.0 82.9
ACTH < 2 pmol/L 0.145 36.7 75.8 48.8 69.2 29.4 83.7
LNSC > 157 nmol/L 0.231 36.6 86.1 31.7 89.1 43.3 83.2
Low sex- and age-
0.116 31.5 80.0 34.1 78.2 29.2 81.9
adjusted DHEA-S
Considering the gold standard of ACS a DST > 50.0 nmol/L (1.8 µg/dL)
UFC > 1931 nmol/24 h 0.086 24.5 75.0 15.8 91.7 54.5 63.4
ACTH < 2 pmol/L 0.235 51.4 72.0 48.7 74.4 54.4 69.8
LNSC > 157 nmol/L 0.179 35.8 76.4 25.0 90.9 63.3 65.9
Low sex- and age-
0.103 37.1 71.1 30.3 79.3 47.9 64.4
adjusted DHEA-S
Table 3. Reliability and validity of LNSC, UFC, ACTH and DHEAS for the diagnosis of ACS (considering
three different thresholds in the DST for the ACS definition). ACTH adrenocorticotropic hormone, DST
dexamethasone suppression test, DHEAS dehydroepiandrosterone sulphate, LNSN late-night salivary cortisol,
PPV positive predictive value, NPV negative predictive value, Specific Po + specific positive agreement index,
Specific Po − specific negative agreement index, UFC urinary-free cortisol.
ROC curves confirmed these findings, supporting that these tests should not be used in isolation for the diag-
nosis of ACS. The greatest diagnostic accuracy, although modest, was that of LNSC (Figs. 2, 3). Moreover, when
the four tests were combined, the diagnostic accuracy for the diagnosis of ACS increased, reaching an AUC of
0.73 [0.65–0.80].
Association of the individual ACS diagnostic tests’ results with comorbidities potentially
related to ACS. Seventy-six (38.6%) patients showed a DST serum cortisol level > 50 nmol/L (1.8 µg/dL)
at diagnosis. These patients had a risk of comorbidities potentially related to ACS two-fold higher than those
with DST ≤ 50 nmol/L. The prevalence of dyslipidaemia and hypertension in patients with DST > 50 nmol/L was
1.8 and 2.5 times higher than in patients with DST ≤ 50 nmol/L, respectively (Table 4). However, the diagnostic
performance of the DST to predict the presence of one or more comorbidities potentially related to ACS either
individually or collectively, was poor, because all areas under the ROC curve analyses were below 0.67) (Fig. 4).
UFC was above the > 3862 nmol/24 h in 2 (1.0%) patients whereas another 22 (11.2%) subjects showed nor-
mal-high (1931–3862 nmol/24 h) UFC concentrations. The prevalence of hypertension was three times higher in
patients with normal-high UFC than in patients with normal-low UFC (< 1931 nmol/24 h) (Table 4). LNSC was
above the reference range in 30 (15.2%) patients, who had higher prevalences of hypertension and lower HDL-c
levels when compared with patients showing LNSC levels within the reference range (Table 4). Basal ACTH levels
were < 2 pmol/L in 68 (34.5%) patients and DHEAS levels were below the age and sex-adjusted reference ranges
in 48 (24.4%) patients. No differences were found in the prevalence of ACS-related comorbidities according to
ACTH or DHEAS levels. The AUCs for the diagnosis of ACS-related comorbidities were poor for UFC, LNSC,
ACTH and DHEAS levels; and do not even reaching that of the DST ROC curve (Fig. 4). Even, when the five
tests (including the DST) were used in combination for the prediction of comorbidities potentially related to
ACS, the AUC was modest with an AUC of 0.70 [0.58–0.82].
When we evaluated the combined use of the tests for the diagnosis of comorbidities potentially related to
ACS, the best association was that of the combination of a DST > 50 nmol/L and a LNSC > 149 nmol/L, which
was present in 19 patients in our cohort. These patients had increased risks of hypertension (OR 7.1, 95% CI
1.6–31.6) and cardiovascular events (OR 3.6, 95% CI 1.2–11.3) (Table 5).
Discussion
Our study confirms that, when used as single tests, plasma ACTH, LNSC, UFC and DHEA-S had poor sensitiv-
ity for the diagnosis of ACS. The combination of the four tests, however, improved diagnostic accuracy for ACS
reaching an AUC in the ROC curve of 0.73. On the other hand, the diagnosis accuracy of DST for the prediction
of comorbidities potentially related to ACS is low, albeit other tests routinely used for the study of AIs showed
even worse performances. The association of a positive DST test with hypertension and cardiovascular events
seems to increase when combined with increased LNSC levels, with the addition of ACTH, DHEA-S or UFC
not improving the strength of such an association.
Several studies found that patients with AIs and elevated post-DST cortisol concentrations had worse car-
diometabolic profiles and increased mortality compared with patients reaching adequate cortisol suppression
Scientific Reports | (2021) 11:20539 | https://doi.org/10.1038/s41598-021-00011-4 5
Vol.:(0123456789)www.nature.com/scientificreports/
Figure 2. Diagnosis accuracy of LNSC, ACTH, DHEAS and UFC for the diagnosis of ACS (considering the
1.8 µg/dL threshold for the diagnosis of Autonomous cortisol secretion). Optimal cutoff point based on ROC
curve 2.26 µg/dL (Sensitivity: Se = 78.9% (95% CI 68.5 to 86.6) and Specificity: Sp = 52.1% (95% CI 43.2 to 60.8).
ACTH AUC 0.648, 95% CI 0.577–0.715. Optimal cutoff point based on ROC curve: 11.08 pg/mL (Se = 66.9%
(95% CI 58.2 to 74.7) and Sp = 56.6% (95% CI 45.4 to 67.1). DHEA-S AUC 0.640, 95% CI 0.570–0.708. Optimal
cutoff point based on ROC curve: 411 µg/dL (Se = 64.5% (95% CI 55.6 to 72.4) and Sp = 63.2% (95% CI 51.9
to 73.1). 24 h-urinary free cortisol (UFC) AUC 0.579, 95%CI 0.507–0.649. Optimal cutoff point based on ROC
curve 32.6 µg/24 h (Se = 61.8% (95% CI 50.6 to 71.9 and Sp = 55.4% (95% CI 46.5 to 63.9).
after this test11–13,17. It is currently debated which DST threshold should be used for the diagnosis of ACS. Several
studies suggested that 50 nmol/L is the most sensitive threshold to identify patients with AIs and increased car-
diometabolic risk11–15. In this line, Morelli et al.14 demonstrated that in patients with AI, post-DST cortisol levels
increased according to the number of chronic complications. In another study15, using artificial neural networks,
she found that the optimal cut-off of post-DST cortisol levels for detecting patients with increased cardiovascular
events was 50 nmol/L (accuracy 67.3%, AUC, 0.673). Furthermore, in another s tudy18 an increased risk of car-
diovascular events was observed with post-DST cortisol values above 41 nmol/L (1.5 µg/dL). Our study found
that, although there were some associations between DST results and cardiometabolic comorbidities, the DST
had a poor diagnostic performance for the presence of these comorbidities. This finding is in agreement with
earlier studies14,15,18, supporting that post-DST cortisol is neither accurate enough to predict the occurrence of
post-surgical hypocortisolism nor the improvement of surgical complications in patients with AIs.
The poor performance of the DST and other tests of adrenal function on the prediction of comorbidities
potentially related to ACS might be explained by the multifactorial origin of these prevalent cardiometabolic
disorders. Hence, ACS as a single factor, is unlikely to fully predict them especially when some factors known
to increase the cardiometabolic risk such as older a ge19 and subclinical co-secretion of other hormones like
aldosterone20 are also associated with the presence of AIs. Other factors such as obesity, which can promote
hyperinsulinism and thus the development of AIs, could be indirectly associated with cortisol production as
well21. However, until better and or reliable markers of ACS become available, the DST using the serum cortisol
level > 1.8 µg/dL threshold seems the most sensitive single test to identify ACS patients at risk of cardiometabolic
comorbidities. Moreover, in the presence of an elevated post-DST cortisol concentration, an elevated LNSC
identifies patients at even higher cardiometabolic risk.
The performance of UFC, DHEA-S, ACTH and LNSC levels for the diagnosis of ACS was poor and, for the
identification of comorbidities potentially related to ACS, were even poorer than that of DST in our study. This
finding supports the recommendation of most professional societies to use the DST for the evaluation of ACS in
AIs4,7,8. At present, UFC is not recommended for the diagnosis of ACS, given that less than 20% of patients with
ACS present elevated UFC l evels5,22. The role of DHEA-S in the diagnosis of ACS is currently c ontroversial23–27.
Scientific Reports | (2021) 11:20539 | https://doi.org/10.1038/s41598-021-00011-4 6
Vol:.(1234567890)www.nature.com/scientificreports/
Figure 3. Diagnosis accuracy of LNSC, ACTH, DHEAS and UFC for the diagnosis of ACS (considering the
5 µg/dL threshold for the diagnosis of Autonomous cortisol secretion). Late-night salivary cortisol AUC = 0.696
(95% CI 0.626 to 0.759). Optimal cut-off point based on ROC curve: 3.4 µg/dL (Se = 68.4% (95% CI 46.0 to 84.6)
and Sp = 70.8% (95% CI 63.7 to 77.0). ACTH AUC = 0.555 (95% CI 0.483 to 0.625). Optimal cut-off point based
on ROC curve: 6.84 pg/mL (Se = 83.1% (95% CI 77.0 to 87.9) and Sp = 42.1% (95% CI 23.1 to 63.7). DHEAS
AUC = 0.569 (95% CI 0.497 to 0.639). Optimal cut-off point based on ROC curve: 402 µg/dL (Se = 57.3% (95%
CI 50.0 to 64.3) and Sp = 63.2% (95% CI 41.0 to 80.9). UFC AUC 0.517 (95% CI 0.445 to 0.588). Optimal cut-off
point based on ROC curve: 39.1 µg/24 h (Se = 42.1% (95% CI 23.1 to 63.7) and Sp = 61.2% (95% CI 53.9 to 68.1).
In our study, DHEA-S as a single test or in combination with DST did not achieve better diagnostic performances
for comorbidities potentially related to ACS than using the DST alone. Previous studies found basal ACTH
levels > 2 pmol/L in up to 50% of patients with ACS and < 2 pmol/L in as many as 20% of patients with normal
cortisol metabolism, also suggesting a poor diagnostic performance for A CS28. We found basal ACTH levels
to have a weak association with the results of the DST, but no association with cardiometabolic comorbidities.
LNSC—an easy, stress-free, and cost-effective alternative to late night serum cortisol—also showed limited
utility for the diagnosis of ACS as suggested by previous s tudies29. Of the tests of adrenal function studied here,
LNSC levels showed the greater reliability for the diagnosis of ACS as defined by the DST test, and patients
with elevated LNSC and post-DST cortisol levels were those with the worst cardiometabolic profiles. Moreover,
we found that the combination of basal plasma ACTH, UFC, LNSC and DHEA-S significantly increased the
diagnostic accuracy for the diagnosis of ACS compared with their use as single tests, reaching an AUC of 0.73
in the ROC curve. This is in line with the recommendation of most guidelines and experts in this field of using
the combination of several hormonal parameters to evaluate the presence of ACS2,4–10.
Our present study, however, is not free of limitations, starting by its retrospective design. Because we only
included patients in whom all the diagnostic tests had been obtained, and such a decision was made on a clinical
basis by their physicians, possibility exists of a selection bias towards the inclusion of a subset of more compli-
cated patients as higher tumour size, higher DST and lower ACTH levels were found in the inclusion population
compared to the excluded patients. However, we included all consecutive patients fulfilling the inclusion criteria
during the study period within a single institution, thus allowing for comparable laboratory results. We did not
evaluate osteoporosis, which is a recognized comorbidity related to ACS, due to inconsistent evaluation in the
medical records. Therefore, the association of the results of the different evaluated tests with osteoporosis could
not be evaluated. The metabolism of dexamethasone varies widely among p atients30. Although we excluded
patients with known factors associated with false positive results in the DST such as treatment with oral hormone
Scientific Reports | (2021) 11:20539 | https://doi.org/10.1038/s41598-021-00011-4 7
Vol.:(0123456789)www.nature.com/scientificreports/
DST (nmol/L) > 50 (n = 76) UFC (nmol/24 h) ≥ 1930 ACTH (pmol/L) < 2 (n = 68) DHEAS (µg/dL) low LNSC (nmol/L) > 157
vs ≤ 50 (n = 121) (n = 22) vs < 1930 (n = 175) vs ≥ 2 (n = 129) (n = 48) vs normal (n = 149) (n = 30) vs ≤ 157 (n = 167)
65.7 ± 10.0 vs 63.7 ± 10.1, 64.6 ± 10.0 vs 64.5 ± 10.1, 63.3 ± 9.2 vs 65.1 ± 10.5, 64.3 ± 10.1 vs 64.5 ± 10.1, 66.9 ± 10.8 vs 64.1 ± 9.9,
Age, years
P = 0.173 P = 0.943 P = 0.252 P = 0.885 P = 0.154
Male sex OR 0.8 [0.5–1.4], P = 0.476 OR 1.4 [0.6–3.4], P = 0.461 OR 0.6 [0.3–1.1], P = 0.068 OR 2.3 [1.2–4.5], P = 0.012 OR 1.0 [0.5–2.3], P = 0.934
Comorbidities potentially
OR 2.6[1.0–6.8], P = 0.045 OR 1.7 [0.4–8.0], P = 0.446 OR 1.7 [0.7–4.6], P = 0.248 = 1.0 [0.4–2.7], P = 0.971 OR 2.5 [0.6–11.2], P = 0.188
related to ACS (composite)
Hypertension OR 2.5 [1.4–4.6], P = 0.003 OR 2.7 [1.0–7.7], P = 0.043 OR 1.0 [0.5–1.8], P = 0.915 OR 0.8 [0.4–1.6] P = 0.551 OR 2.7 [1.1–6.7], P = 0.020
Dyslipidaemia OR 1.8 [1.0–3.2], P = 0.054 OR 1.0 [0.4–2.5], P = 0.940 OR 1.0 [0.6–1.9], P = 0.877 OR 1.0 [0.5–2.0], P = 0.903 OR 1.2 [0.6–2.6], P = 0.626
Obesity OR 1.0 [0.6–1.9], P = 0.883 OR 2.0 [0.8–5.0], P = 0.130 OR 1.0 [0.5–1.9], P = 0.986 OR 1.0 [0.5–2.1], P = 0.961 OR 0.6 [0.3–1.6], P = 0.316
Diabetes OR 1.6 [0.8–3.2], P = 0.161 OR 1.7 [0.7–4.6], P = 0.275 OR 1.1[0.6–2.2], P = 0.771 OR 1.0[0.5–2.3], P = 0.912 OR 1.1[0.4–2.7], P = 0.887
Cardiovascular disease OR 2.3[0.9–5.8], P = 0.069 OR 1.4[0.4–5.1], P = 0.642 OR 0.9[0.4–2.5], P = 0.904 OR 1.6[0.6–4.4], P = 0.326 OR 1.9[0.6–5.6], P = 0.273
Cerebrovascular disease OR 1.6[0.1–26.0], P = 0.742 NC OR 1.9[0.1–31.0], P = 0.652 OR 3.1 [0.2–51.3], P = 0.432 NC
Body mass index (kg/m2) 30.4 ± 6.6 vs 30.2 ± 6.2, 31.6 ± 5.8 vs 30.2 ± 6.4, 30.5 ± 7.1 vs 30.2 ± 6.0, 30.2 ± 5.4 vs 30.4 ± 6.7, 31.4 ± 7.1 vs 30.2 ± 6.2,
(n = 133) P = 0.866 P = 0.444 P = 0.824 P = 0.932 P = 0.447
Systolic blood pressure 136.9 ± 16.3 vs 138.2 ± 17.3, 138.8 ± 16.3 vs 137.5 ± 17.0, 135.9 ± 16.1 vs 136.8 ± 17.2, 137.8 ± 18.2 vs 137.6 ± 16.5, 137.2 ± 19.1 vs 137.8 ± 16.5,
(n = 159) P = 0.642 P = 0.779 P = 0.352 P = 0.971 P = 0.889
Diastolic blood pressure 78.4 ± 9.6 vs 80.7 ± 9.6, 76.9 ± 9.4 vs 80.1 ± 9.6, 77.9 ± 7.6 vs 80.6 ± 10.4, 76.4 ± 9.9 vs 80.9 ± 9.3, 78.6 ± 7.3 vs 79.9 ± 10.0,
(n = 159) P = 0.136 P = 0.198 P = 0.095 P = 0.009 P = 0.541
Fasting plasma glucose 6.7 ± 2.3 vs 6.3 ± 1.7, 6.3 ± 1.7 vs 6.4 ± 1.8, 6.8 ± 2.5 vs 6.2 ± 1.4, 6.1 ± 1.2 vs 6.4 ± 1.8,
6.7 ± 2.3 vs 6.1 ± 1.2 P = 0.015
(nmol/L) (n = 197) P = 0.376 P = 0.837 P = 0.053 P = 0.504
6.3 ± 0.8 vs 6.2 ± 0.9, 6.0 ± 0.8 vs 6.3 ± 1.0, 6.2 ± 1.0 vs 6.2 ± 0.9, 6.2 ± 0.7 vs 6.2 ± 1.0,
HbA1c (%) (n = 55) 6.4 ± 1.0 vs 6.1 ± 0.8 P = 0.225
P = 0.799 P = 0.346 P = 0.826 P = 0.820
29.9 ± 7.8 vs 30.1 ± 8.6 30.3 ± 9.6 vs 30.0 ± 8.1, 31.4 ± 7.0 vs 29.4 ± 8.8, 28.4 ± 6.7 vs 30.6 ± 8.7, 30.5 ± 9.5 vs 29.9 ± 8.1,
LDL-c (mmol/L) (n = 143)
P = 0.860 P = 0.859 P = 0.164 P = 0.148 P = 0.755
13.1 ± 4.2 vs 14.5 ± 4.8, 13.6 ± 5.5 vs 14.0 ± 4.5, 13.8 ± 4.0 vs 14.0 ± 4.9, 12.6 ± 4.6 vs 14.4 ± 4.5, 11.7 ± 4.2 vs 14.4 ± 4.6,
HDL-c (mmol/L) (n = 143)
P = 0.079 P = 0.747 P = 0.835 P = 0.035 P = 0.012
Triglycerides (mmol/L) 1.2 ± 0.6 vs 1.1 ± 0.5, 1.0 ± 0.3 vs 1.1 ± 0.5, 1.0 ± 0.1 vs 1.2 ± 0.5, 1.1 ± 0.5 vs 1.1 ± 0.5, 1.1 ± 0.4 vs 1.1 ± 0.5,
(n = 193) P = 0.256 P = 0.278 P = 0.033 P = 0.693 P = 0.974
121.0 ± 95.2 vs 33.0 ± 9.13, 107.4 ± 117.8 vs 61.9 ± 64.3, 75.2 ± 59.0 vs 62.7 ± 79.6, 86.0 ± 105.8 vs 60.9 ± 58.1, 117.5 ± 21.2 vs 57.9 ± 58.6,
DST (nmol/L) (n = 197)
P < 0.0001 P = 0.006 P = 0.253 P = 0.039 P < 0.0001
3.0 ± 2.42 vs 4.0 ± 2.42, 4.6 ± 3.1 vs 3.5 ± 2.5, 1.5 ± 0.4 vs 4.7 ± 2.5, 3.1 ± 1.8 vs 3.8 ± 2.8, 3.2 ± 2.1 vs 3.6 ± 2.6,
ACTH (pmol/L) (n = 197)
P = 0.011 P = 0.056 P < 0.0001 P = 0.110 P = 0.403
1256.6 ± 974.0 vs 2811.6 ± 883.5 vs 983.9 ± 647.3 vs 1155.7 ± 912.8 vs 1329.4 ± 1043.9 vs
UFC (nmol/L) (n = 197)
988.7 ± 635.1, P = 0.020 875.9 ± 883.5, P < 0.0001 1149.1 ± 855.2, P = 0.165 1071.5 ± 751.0, P = 0.523 1049.4 ± 733.5, P = 0.075
1294.4 ± 1216.8 vs 1932.9 ± 1601.0 vs 1276.3 ± 1026.8 vs 627.2 ± 329.2 vs 1533.1 ± 1235.4 vs
DHEAS (µmol/L) (n = 197)
1821.5 ± 1463.0, P = 0.009 1578.6 ± 1365.8, P = 0.262 1798.3 ± 1526.0, P = 0.0121 1937.4 ± 1435.3, P < 0.0001 1633.4 ± 1423.4, P = 0.718
5.0 ± 4.8 vs 3.3 ± 3.9, 147.9 ± 141.3 vs 118.0 ± 118.6 vs 113.4 ± 146.2 vs 330.0 ± 176.2 vs 70.0 ± 30.5,
LNSC (nmol/L) (n = 197)
p = 0.009 104.7 ± 115.5, P = 0.109 105.1 ± 119.3, P = 0.471 108.3 ± 109.3, P = 0.797 P < 0.0001
137.3 ± 131.7 vs 92.1 ± 107.1, 24.2 ± 14.5 vs 22.0 ± 10.0, 25.0 ± 10.8 vs 20.6 ± 10.1, 24.8 ± 10.6 vs 21.3 ± 10.4, 25.4 ± 11.5 vs 21.7 ± 10.3,
Tumor size (mm) (n = 197)
p < 0.0001 P = 0.478 P = 0.021 P = 0.094 P = 0.170
Bilaterality (n = 197) OR 4.3[2.2–8.1], P < 0.001 OR 2.6[1.1–6.5], P = 0.036 OR 2.5 [1.3–4.6], P = 0.005 OR 0.8 [0.4–1.7], P = 0.616 OR 2.0[0.9–4.5], P = 0.091
Tumor rich in lipidic content
OR 1.6 [0.6–4.2], P = 0.303 OR 0.4 [0.1–1.1], P = 0.101 OR 1.7[0.6–4.7], P = 0.267 OR 0.7[0.3–1.7], P = 0.423 OR 0.4[0.1–1.0] P = 0.060
(n = 155)
Table 4. Baseline features and association of ACS-diagnostic tests with the diagnosis of comorbidities
potentially related to ACS. Differences in quantitative variables are expressed in mean differences (d) between
ACS and NFAI group, and for qualitative variables differences are expressed in odds ratios (OR) and 95%
confident interval (in brackets). ACS autonomous cortisol secretion, DST dexamethasone suppression test,
DHEAS dehydroepiandrosterone sulphate, NFAI non-functioning adrenal incidentalomas, LNSC late-night
salivary cortisol, UFC urinary-free cortisol.
contraceptives or other drugs known to alter dexamethasone metabolism, alcoholism, and psychiatric illness,
some of these conditions might have not been registered in the medical records, and dexamethasone levels were
not routinely evaluated during the DST31. Furthermore, other factors could also lead to false positive results
ST32. Added to this is the known variability between techniques and assay kits for cortisol a ssays33 and
in the D
intra-assay variability in measurements which increases in the range of low cortisol levels. Furthermore, in our
institution UFC and LNSC are measured by immunochemiluminescence, which are substandard compared with
the liquid chromatography/tandem mass assays recommended n owadays34. This limitation is supported by the
35
results of a recent study that demonstrated that with the use of liquid chromatography/tandem mass assays,
low DHEA-S levels were associated with diabetes, an association that was lost when DHEA-S was measured by
immunochemiluminescence. Future studies are needed to identify more reliable and accurate markers of cortisol
Scientific Reports | (2021) 11:20539 | https://doi.org/10.1038/s41598-021-00011-4 8
Vol:.(1234567890)www.nature.com/scientificreports/
Figure 4. ROC curve of the different tests for the diagnosis of any comorbidities potentially related to ACS.
etabolomics34 and functional imaging studies such as adrenal iodomethyl-
autonomy. In this regard, urine m
norcholesterol scintigraphy hold promise.
Conclusion
LNSC is the one test with the highest diagnosis accuracy for ACS identification when a positive DST is used
as the gold standard for ACS diagnosis. Comorbidities potentially related to ACS cannot be predicted by any
single test of adrenal function possibly translating their multifactorial nature. In fact, the association of the tests
evaluated here with comorbidities potentially related to ACS was poor. As a single test, DST, had the strongest
association with comorbidities potentially related to ACS. Patients with elevated DST results and elevated LNSC
levels had the highest cardiometabolic risk in our cohort.
Scientific Reports | (2021) 11:20539 | https://doi.org/10.1038/s41598-021-00011-4 9
Vol.:(0123456789)www.nature.com/scientificreports/
DST > 50 nmol/L + LNSC DST > 50 nmol/L + ACTH DST > 50 nmol/L + UFC DST > 50 nmol/L + low LNSC > 149 nmol/L + ACTH LNSC > 149 nmol/L + UFC LNSC > 149 nmol/L +
> 149 nmol/L (19 vs. 178) < 2 pmol/L (37 vs. 160) > 1931 nmol/L (12 vs. 185) DHEAS (23 vs. 174) < 2 pmol/L (12 vs. 185) > 1931 nmol/L (6 vs. 191) low DHEAS (8 vs. 189)
Comor-
bidities
potentially OR 6.9, 95% CI 0.9–53.0, OR 3.8, 95% CI 0.5–30.0,
OR 1.0 OR 1.0 OR 1.0 OR 1.0 OR 1.0
related P = 0.013 P = 0.121
to ACS
(any)
Hyperten- OR 7.1, 95% CI 1.6–31.6, OR 1.9, 95% CI 0.9–4.2, OR 8.8, 95% CI 1.1–69.2, OR 1.8, 95% CI 0.7–4.5, OR 2.3, 95% CI 0.6–8.7, OR 3.8, 95% CI 0.4–32.8, OR 5.4., 95% CI 0.6–44.5,
sion P = 0.0015 P = 0.085 P = 0.007 P = 0.219 P = 0.202 P = 0.175 P = 0.062
Type 2 OR 0.6, 95% CI 0.2–2.5, OR 1.6, 95% CI 0.7–3.6, OR 1.6, 95% CI 0.6–4.2, OR 1.2, 95% CI 0.3–4.5, OR 0.7, 95% CI 0.1–6.1,
OR 1.2, 95% CI 0.3–4.5 OR 1.0
diabetes P = 0.455 P = 0.243 P = 0.337 P = 0.821 P = 0.726
Dyslipi- OR 1.5, 95% CI 0.6–3.8, OR 1.3, 95% CI 0.6–2.6, OR 2.6, 95% CI 1.0–6.7, OR 1.5, 95% CI 0.5–4.8, OR 1.0, 95% CI 0.2–5.2, OR 1.8, 95% CI 0.4–7.6,
OR 1.2, 95% CI 0.5–4.8
daemia P = 0.427 P = 0.516 P = 0.036 P = 0.515 P = 0.970 P = 0.442
OR 0.4, 95% CI 0.1–1.4, OR 1.3, 95% CI 0.6–2.7, OR 1.1, 95% CI 0.3–3.9, OR 0.8, 95% CI 0.3–2.0, OR 0.4, 95% CI 0.1–2.0, OR 2.3, 95% CI 0.5–11.7, OR 0.3, 95% CI 0.0–2.6,
Obesity
P = 0.111 P = 0.546 P = 0.856 P = 0.585 P = 0.243 P = 0.324 P = 0.212
Cardio-
OR 3.6, 95% CI 1.2–11.3, OR 1.9, 95% CI 0.7–5.2, OR 0.8, 95% CI = 0.1–6.1, OR 1.9, 95% CI 0.6–6.4, OR 1.7, 95% CI 0.4–8.6, OR 3.0, 95% CI 0.6–15.8,
vascular OR 1.0
P = 0.041 P = 0.247 P = 0.781 P = 0.297 P = 0.514 P = 0.239
events
Cerebro-
OR 4.4, 95% CI 0.3–72.2,
vascular OR 1.0 OR 1.0 OR 1.0 OR 1.0 OR 1.0 OR 1.0
P = 0.317
events
Table 5. Association of the different combined tests with cardiometabolic comorbidities at presentation.
ACS autonomous cortisol secretion, DST dexamethasone suppression test, DHEAS dehydroepiandrosterone
sulphate, LNSC late-night salivary cortisol, UFC urinary-free cortisol. Differences in quantitative variables are
expressed in mean differences (d) between ACS and NFAI group, and for qualitative variables differences are
expressed in odds ratios (OR) and 95% confident interval (in brackets).
Received: 13 July 2021; Accepted: 5 October 2021
References
1. Wagner, J. & Aron, D. C. Incidentalomas—A “disease” of modern imaging technology. Best Pract Res. Clin. Endocrinol. Metab.
26(1), 3–8. https://doi.org/10.1016/j.beem.2011.08.006 (2012).
2. Fassnacht, M. et al. Management of adrenal incidentalomas: European Society of Endocrinology Clinical Practice Guideline in
collaboration with the European Network for the Study of Adrenal Tumors. Eur. J. Endocrinol. 175(2), G1–G34. https://doi.org/
10.1530/EJE-16-0467 (2016).
3. Kloos, R. T., Gross, M. D., Francis, I. R., Korobkin, M. & Shapiro, B. Incidentally discovered adrenal masses. Endocr. Rev. 16(4),
460–484. https://doi.org/10.1210/edrv-16-4-460 (1995).
4. Araujo-Castro, M. et al. Practical guide on the initial evaluation, follow-up, and treatment of adrenal incidentalomas Adrenal
Diseases Group of the Spanish Society of Endocrinology and Nutrition. Endocrinol. Diabetes Nutr. 67(6), 408–419. https://doi.
org/10.1016/j.endinu.2020.03.002 (2020).
5. Cambos, S. & Tabarin, A. Management of adrenal incidentalomas: Working through uncertainty. Best Pract. Res. Clin. Endocrinol.
Metab. 34(3), 101427. https://doi.org/10.1016/j.beem.2020.101427 (2020).
6. Bulow, B. et al. Adrenal incidentaloma—Follow-up results from a Swedish prospective study. Eur. J. Endocrinol. 154(3), 419–423.
https://doi.org/10.1530/eje.1.02110 (2006).
7. Terzolo, M. et al. AME position statement on adrenal incidentaloma. Eur. J. Endocrinol. 164(6), 851–870. https://doi.org/10.1530/
EJE-10-1147 (2011).
8. Tabarin, A. et al. Exploration and management of adrenal incidentalomas. French Society of Endocrinology Consensus. Ann.
Endocrinol. 69(6), 487–500. https://doi.org/10.1016/j.ando.2008.09.003 (2008).
9. American Diabetes Association. Classification and diagnosis of diabetes: Standards of medical care in diabetes-2019. Diabetes
Care 42(1), S13–S28. https://doi.org/10.2337/dc19-S002 (2019).
10. National Cholesterol Education Program (NCEP) Expert Panel on Detection, Evaluation, and Treatment of High Blood Choles-
terol in Adults (Adult Treatment Panel III). Third Report of the National Cholesterol Education Program (NCEP) Expert Panel
on detection, evaluation, and treatment of high blood cholesterol in adults (Adult Treatment Panel III) final report. Circulation
106(25), 3143–3421 (2002).
11. Debono, M. et al. Cortisol as a marker for increased mortality in patients with incidental adrenocortical adenomas. J. Clin. Endo-
crinol. Metab. 99(12), 4462–4470. https://doi.org/10.1210/jc.2014-3007 (2014).
12. Di Dalmazi, G. et al. Cardiovascular events and mortality in patients with adrenal incidentalomas that are either non-secreting
or associated with intermediate phenotype or subclinical Cushing’s syndrome: A 15-year retrospective study. Lancet Diabetes
Endocrinol. 2(5), 396–405. https://doi.org/10.1016/S2213-8587(13)70211-0 (2014).
13. Sbardella, E. et al. Cardiovascular features of possible autonomous cortisol secretion in patients with adrenal incidentalomas. Eur.
J. Endocrinol. 178(5), 501–511. https://doi.org/10.1530/EJE-17-098 (2018).
14. Morelli, V. et al. Subclinical hypercortisolism: Correlation between biochemical diagnostic criteria and clinical aspects. Clin.
Endocrinol. (Oxf) 73(2), 161–166. https://doi.org/10.1111/j.1365-2265.2010.03794.x (2010).
15. Morelli, V. et al. Cardiovascular events in patients with mild autonomous cortisol secretion: Analysis with artificial neural networks.
Eur. J. Endocrinol. 177(1), 73–83. https://doi.org/10.1530/EJE-17-0047 (2017).
16. Araujo-Castro, M. et al. Presurgical predictive factors of surgical remission in Cushing’s disease. Study of 32 cases. Endocrinol.
Diabetes Nutr. 2, S2530. https://doi.org/10.1016/j.endinu.2021.07.004 (2021).
17. Di Dalmazi, G. et al. Progressively increased patterns of subclinical cortisol hypersecretion in adrenal incidentalomas differently
predict major metabolic and cardiovascular outcomes: A large cross-sectional study. Eur. J. Endocrinol. 166(4), 669–677. https://
doi.org/10.1530/EJE-11-1039 (2012).
18. Morelli, V. et al. Long-term follow-up in adrenal incidentalomas: An Italian multicenter study. J. Clin. Endocrinol. Metab. 99(3),
827–834. https://doi.org/10.1210/jc.2013-3527 (2014).
19. Rosenbaum, A. H. et al. The dexamethasone suppression test in normal control subjects: Comparison of two assays and effect of
age. Am. J. Psychiatry 141(12), 1550–1555. https://doi.org/10.1176/ajp.141.12.1550 (1984).
Scientific Reports | (2021) 11:20539 | https://doi.org/10.1038/s41598-021-00011-4 10
Vol:.(1234567890)www.nature.com/scientificreports/
20. Funder, J. W. et al. Case detection, diagnosis, and treatment of patients with primary aldosteronism: An endocrine society clinical
practice guideline. J. Clin. Endocrinol Metab. 93(9), 3266–3281. https://doi.org/10.1210/jc.2008-0104 (2008).
21. Sydney, G. I., Ioakim, K. J. & Paschou, S. A. Insulin resistance and adrenal incidentalomas: A bidirectional relationship. Maturitas
121, 1–6. https://doi.org/10.1016/j.maturitas.2018.12.002 (2019).
22. Araujo-Castro, M., Sampedro Núñez, M. A. & Marazuela, M. Autonomous cortisol secretion in adrenal incidentalomas. Endocrine
64(1), 1–13. https://doi.org/10.1007/s12020-019-01888-y (2019).
23. Yener, S., Yilmaz, H., Demir, T., Secil, M. & Comlekci, A. DHEAS for the prediction of subclinical Cushing’s syndrome: Perplexing
or advantageous? Endocrine 48(2), 669–676. https://doi.org/10.1007/s12020-014-0387-7 (2015).
24. Di Dalmazi, G. et al. Steroid profiling by LC-MS/MS in nonsecreting and subclinical cortisol-secreting adrenocortical adenomas.
J. Clin. Endocrinol. Metab. 100(9), 3529–3538. https://doi.org/10.1210/JC.2015-1992 (2015).
25. Stoddart, H. Low dehydroepiandrosterone sulphate: a sensitive and specific test for the detection of subclinical hypercortisolism
in adrenal incidentalomas. Clin. Biochem. 54(4), 511. https://doi.org/10.1177/0004563217704738 (2017).
26. Tanabe, A. et al. Autonomy of cortisol secretion in clinically silent adrenal incidentaloma. Horm. Metab. Res. 33(7), 444–450.
https://doi.org/10.1055/s-2001-16234 (2001).
27. Bencsik, Z. et al. Low dehydroepiandrosterone sulfate (DHEA-S) level is not a good predictor of hormonal activity in nonselected
patients with incidentally detected adrenal tumors. J. Clin. Endocrinol. Metab. 81(5), 1726–1729. https://doi.org/10.1210/jcem.
81.5.8626824 (1996).
28. Olsen, H., Kjellbom, A., Löndahl, M. & Lindgren, O. Suppressed ACTH is frequently unrelated to autonomous cortisol secretion
in patients with adrenal incidentalomas. J. Clin. Endocrinol. Metab. 104(2), 506–512. https://d oi.o
rg/1 0.1 210/j c.2 018-0 1029 (2019).
29. Vieira-Correa, M. et al. Saliva versus serum cortisol to identify subclinical hypercortisolism in adrenal incidentalomas: Simplicity
versus accuracy. J. Endocrinol. Investig. 42(12), 1435–1442. https://doi.org/10.1007/s40618-019-01104-8 (2019).
30. Ueland, G. et al. Simultaneous assay of cortisol and dexamethasone improved diagnostic accuracy of the dexamethasone suppres-
sion test. Eur. J. Endocrinol. 176(6), 705–713. https://doi.org/10.1530/EJE-17-0078 (2017).
31. Ceccato, F. et al. Dexamethasone measurement during low-dose suppression test for suspected hypercortisolism: Threshold devel-
opment with and validation. J. Endocrinol. Investig. 43(8), 1105–1113. https://doi.org/10.1007/s40618-020-01197-6 (2020).
32. Nieman, L. K. et al. The diagnosis of cushing’s syndrome: An Endocrine Society Clinical Practice Guideline. J. Clin. Endocrinol.
Metab. 93(5), 1526–1540. https://doi.org/10.1210/jc.2008-0125 (2008).
33. Hawley, J. M. et al. Serum cortisol: An up-to-date assessment of routine assay performance. Clin. Chem. 62(9), 1220–1229. https://
doi.org/10.1373/clinchem.2016.255034 (2016).
34. Araujo-Castro, M., Valderrábano, P., Escobar-Morreale, H. F., Hanzu, F. A. & Casals, G. Urine steroid profile as a new promising
tool for the evaluation of adrenal tumors. Literature review. Endocrine. https://doi.org/10.1007/s12020-020-02544-6 (2020).
35. Di Dalmazi, G. et al. The steroid profile of adrenal incidentalomas: Subtyping subjects with high cardiovascular risk. J. Clin.
Endocrinol. Metab. 104(11), 5519–5528. https://doi.org/10.1210/jc.2019-00365 (2019).
Author contributions
M.A.-C., H.F.E.-M. and P.V. wrote the main manuscript text. All authors reviewed the manuscript.
Funding
Ayuda a la Investigación en Endocrinología, Nutrición y Diabetes 2019, Sociedad de Endocrinología, Nutrición
y Diabetes de la Comunidad de Madrid (BECA SENDIMAD de Ayuda a la Investigación en Endocrinología,
Nutrición y Diabetes 2019). Convocatoria intramural de ayudas a proyectos de investigación de investigadores
noveles, investigadores clínicos asociados y/o grupos emergentes del Hospital Universitario Ramón y Cajal
2019, IRYCIS.
Competing interests
The authors declare no competing interests.
Additional information
Supplementary Information The online version contains supplementary material available at https://doi.org/
10.1038/s41598-021-00011-4.
Correspondence and requests for materials should be addressed to M.A.-C.
Reprints and permissions information is available at www.nature.com/reprints.
Publisher’s note Springer Nature remains neutral with regard to jurisdictional claims in published maps and
institutional affiliations.
Open Access This article is licensed under a Creative Commons Attribution 4.0 International
License, which permits use, sharing, adaptation, distribution and reproduction in any medium or
format, as long as you give appropriate credit to the original author(s) and the source, provide a link to the
Creative Commons licence, and indicate if changes were made. The images or other third party material in this
article are included in the article’s Creative Commons licence, unless indicated otherwise in a credit line to the
material. If material is not included in the article’s Creative Commons licence and your intended use is not
permitted by statutory regulation or exceeds the permitted use, you will need to obtain permission directly from
the copyright holder. To view a copy of this licence, visit http://creativecommons.org/licenses/by/4.0/.
© The Author(s) 2021
Scientific Reports | (2021) 11:20539 | https://doi.org/10.1038/s41598-021-00011-4 11
Vol.:(0123456789)You can also read