DID YOU KNOW ? FACTS AND FIGURES - ABOUT THE EUROPEAN UNION AND THE G20 - Consilium.europa.eu
←
→
Page content transcription
If your browser does not render page correctly, please read the page content below

DID YOU KNOW...?
       FACTS AND FIGURES
ABOUT THE EUROPEAN UNION AND THE G20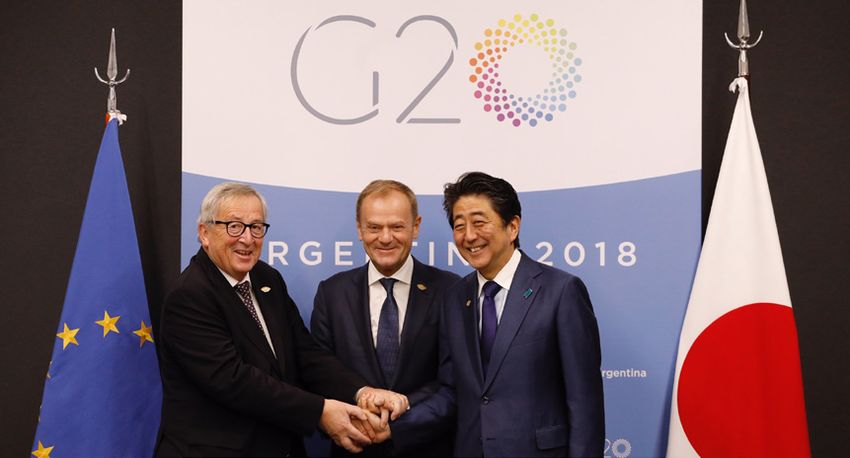
© Brenda Alvarez on Unsplash

        2
TABLE OF CONTENTS

I. The European Union in the G20............................................................................................................. 4

II. The EU’S main priorities for the G20 summit in Osaka............................................................. 5

III. European Union-Japan Relations......................................................................................................... 6

IV. A strong Europe for a strong global economy................................................................................ 7

V. The European Union’s commitment to reforming the World Trade Organization.......11

VI. The European approach to shape the digital economy...........................................................17

VII. The European Union addressing demographic challenges....................................................22

VIII. Women empowerment.........................................................................................................................27

IX. Sustainability.................................................................................................................................................29

                                                                                                                                                                        3
I. THE EUROPEAN UNION IN THE G20
The European Union is a full member of the G20, alongside four of its Member States who are also permanent
G20 members: France, Germany, Italy and the UK. Spain and the Netherlands are invited guests.
Jean-Claude Juncker, President of the European Commission, and Donald Tusk, President of the Council,
represent the European Union at the G20.
The European Union is the second biggest economic power in the world, representing 21.4% of total global
gross domestic product, behind the United States, which accounts for 24%.
The European Union accounts for around 7% of the world’s population, surpassed only by China and India
when it comes to the number of people it represents at the G20 Summit table.
G20 Participants
Source: G20, 2019.
Members (including the EU)
Guests to the 2019 G20 Summit
EU Member States
Note: The Association of Southeast Asian Nations, the African Union, the Asia-Pacific Economic Cooperation and the New
Partnership for Africa’s Development are represented by Thailand, Egypt, Chile and Senegal respectively. Other partner
organisations are the United Nations, the International Monetary Fund, the World Bank, the World Trade Organization,
the International Labour Organization, the Financial Stability Board, the Organization for Economic Cooperation and
Development, the Asian Development Bank and the World Health Organization.
4II. THE EU’S MAIN PRIORITIES FOR THE G20
SUMMIT IN OSAKA
© European Union
The European Union is a key actor in championing
multilateralism. It is by working together in international
fora, like the G20, that the EU can boost global confidence
and tackle global challenges. At the G20 Osaka Summit
on 28-29 June 2019, the EU’s priorities will include the Mr Jean-Claude Juncker, President of the European Commission;
following: Mr Donald Tusk, President of the European Council; Mr Shinzo Abe,
Japanese Prime Minister. Buenos Aires, 1 December 2018
▶▶ Boosting global economic confidence Agreement, including to its ambitious targets for
reducing CO2 emissions by 2030. The EU wants to send
The European Union will send a strong message of a strong message ahead of the United Nations Climate
confidence on the global economy in the face of a Summit in September 2019 and the Climate Change
marked slowdown. Conference (COP25) in November 2019. The EU will
▶▶ Improving the functioning of the multilateral support the G20’s efforts concerning resource efficiency,
trading system with a reformed World Trade decoupling economic growth from environmental
Organization at its core degradation, and stressing the importance of the EU’s
circular economy approach — in particular in avoiding
The European Union will always fight to preserve rules- marine plastic litter, through product design and waste
based international trade. The EU will support the G20’s prevention.
efforts to deescalate trade tensions. This includes
following up on the Buenos Aires G20 Summit with ▶▶ Achieving an inclusive and sustainable world
regards to the reform of the World Trade Organization, The EU will stress the importance of the full
as well as the prolongation of the Global Forum on implementation of the 2030 Agenda and its 17
Steel Excess Capacity on its current basis and the Sustainable Development Goals sending a strong
implementation of previous commitments. message of support ahead of the High Level Political
▶▶ Harnessing the digital transformation Forum that will take place in September 2019 in New
York. The EU will also endorse the G20 Quality of
The EU will support the Japanese presidency’s G20 Infrastructure Principles that underpin environmentally,
priorities on digitalisation. This includes pushing for a economically and socially responsible investments.
global solution on the taxation of the digital economy The EU will also build on the Africa-Europe Alliance for
by 2020 and supporting the ‘Data Free Flow with Sustainable Investment and Jobs, reaffirming the its
Trust’ initiative advanced by Japan, insisting that data support to the G20 Partnership with Africa.
protection should go hand-in-hand with the free flow
of data. ▶▶ Delivering on G20 commitments on counter-
terrorism
▶▶ Addressing inequalities and ageing societies
The EU will also convey its strong support to the fight
The EU will support the Japanese presidency’s G20 against terrorism. This includes delivering on the
priority on finding common solutions to our ageing Hamburg G20 Leaders’ Statement on Counterterrorism
societies. We will also underline the importance of and stepping up collective efforts against the spread of
continuing the implementation of the G20 Leaders’ terrorist content online in full respect of human rights
commitments on women empowerment, in particular and fundamental freedoms.
the actions needed to close the gap in labour
participation rates between women and men as agreed ▶▶ Promoting global responsibility on migration
at the G20 Summit in Brisbane in 2014. and displacement
▶▶ Protecting the environment and fighting The EU will convey the need for continued international
climate change cooperation on migration and displacement.
The European Union will reaffirm its commitment
to the full and effective implementation of the Paris 5III. EUROPEAN UNION-JAPAN RELATIONS
Japan is one of the European Union’s closest and most like-minded partners, and the European Union and
Japan work closely together bilaterally as well as in multilateral fora including the G20. The European Union
and Japan share their support for the rules-based international order, with multilateralism, democracy, the
non-proliferation of weapons of mass destruction, open markets, and a global trading system with the World
Trade Organization at its core. At the 26th European Union-Japan Summit that took place in April 2019,
European Union leaders reaffirmed their support for the priorities of the Japanese Presidency of the G20 in
this historic time for Japan after the accession of Crown Prince Naruhito as Emperor and the beginning of
Japan’s new era of Reiwa, which means “beautiful harmony”. On that occasion, European Union leaders also
underlined the importance of a reform of the World Trade Organization and an ambitious implementation
of the Paris Climate Agreement as key priorities for the European Union in Osaka.
Japan is the European Union’s second biggest trading partner in Asia, and the European Union is Japan’s third
largest trading partner worldwide. The Economic Partnership Agreement between the EU and Japan, which
entered into force on 1 February 2019, is the biggest trade agreement ever negotiated by the European
Union, and the first ever to include a commitment to the Paris Climate Agreement. In January 2019, the
European Commission and Japan also adopted mutual adequacy decisions, allowing personal data to flow
freely between the two economies and creating the world’s largest area of safe data flows.
DID YOU KNOW?
600,000 30% of global gross domestic product
The number of jobs in the The EU’s and Japan’s economic weight
European Union which are tied combined.
to exports to Japan.
Half a million €1 billion
The number of Europeans who The number of customs duties to be
are employed by Japanese com- saved each year, thanks to the EU-Japan
panies in the European Union. Economic Partnership Agreement.
44 €13 billion
The number of joint Master
44 degrees that exist between the The annual increase of EU exports to
European Union and Japan. Each Japan, thanks to the EU-Japan Economic
year, the EU awards a number of Partnership Agreement.
scholarships to fund joint Master
11 Degrees with non-European
Union countries. The number of
2014 2018 programmes selected for
Japanese students has steadily
increased, up from 11 in 2014
to 44 in 2018.
6IV. A STRONG EUROPE FOR A STRONG GLOBAL
ECONOMY
Jobs, growth and investment are back in Europe: 240.7 million people are at work in Europe – more than
ever before. The European Union’s ambitious economic agenda, along with efforts to deepen the Economic
and Monetary Union and the European Central Bank’s accommodative monetary policy have contributed
to a robust economic recovery in Europe. Public finances have improved in all Member States. Poverty
and social exclusion are now decreasing and a stronger European financial sector is supporting credit and
investment. After years of crisis, Europe is bouncing back.
DID YOU KNOW?
The European Union’s economy Investment has returned to
has grown for the past seven pre-crisis levels and is picking
consecutive years up in the European Union
Gross domestic product (GDP) is expanding steadily Investment mobilised by the Juncker Plan
% change in real GDP
€315 BILLION €500 BILLION
4 target by mid 2018 target by 2020
3 2.0
2 1.8 1.4 1.6
0.5 1.9
1 0.5 1.4 1.2 1.5
0 408.4 BILLION
-1
-2
-3
-4 €408.4 billion
-5
2008 2009 2010 2011 2012 2013 2014 2015 2016 2017 2018 2019 2020 The investment volume mobilised by the European
Fund for Strategic Investments (“Juncker Fund”)
EU28 Euro area since 2015, boosting the European Union’s GDP by
Source: European Commission (Eurostat except forecasts). 0.6% and supporting 750,000 jobs in the European
Union.
About 2% 952,000
The average growth rate in the European Union and The number of small and medium-sized enterprises
the euro area in recent years. All European Union benefitting from improved access to finance thanks
Member States recorded growth in 2018. to the Juncker Plan.
13.4 million 15 million
The number of jobs created in the European Union The number of households that have benefited from
since November 2014. The employment rate in the high-speed internet access thanks to the Juncker
European Union is at 73.5%, up from 69.4% at the Plan.
end of 2014.
6.4%
The average unemployment rate in the European
Union. This is a record low since the start of this
century.
7The euro had its 20th
anniversary in 2019 and is
the 2nd most used currency in the
world
Euro area
19
The number of European Union Member States which
use the euro, bringing together 340 million people.
60
The number of countries and territories around the
world, home to some 175 million people, that have
chosen to use the euro as their currency or to peg
their own currency to it.
35.7%
The number of share of world-wide payments made
in euro.
Less than 2%
The average inflation rate in the euro area, allowing
for sound price stability.
is used in
19
EU Member
has a strong
track record of
States
in the EU
price stability
is used by THE
340
million people
EURO
offers a
predictable
in Europe business
environment
60 175
in the world
2ND currency
most used
countries and territories in million
outside of the European Union the world people
have pegged their currency
directly or indirectly to the euro
8GROSS DOMESTIC PRODUCT (GDP) PER CAPITA AND
SHARE OF THE WORLD’S GDP
GDP per capita Share of the world's GDP
(in international dollar) (%)
2017 2017
EU-28 33,836.4 21.42%
Euro area(1) 36,984.3 15.60%
Germany* 44,665.5 4.56%
France* 38,484.2 3.19%
Italy* 32,110 2.40%
United Kingdom* 39,953.6 3.26%
Argentina 14,398.4 0.79%
Australia 53,793.5 1.64%
G20 members
Brazil 9,812.3 2.54%
Canada 44,870.8 2.04%
China 8,827 15.12%
India 1,979.4 3.28%
Indonesia 3,846.4 1.25%
Japan 38,430.3 6.02%
Mexico 8,910.3 1.42%
Republic of Korea 29,742.8 1.89%
South Africa 6,151.1 0.43%
Russia 10,749.1 1.95%
Saudi Arabia 20,849.3 0.85%
Turkey 10,546.2 1.05%
United States 59,927.9 24.08%
Spain* 28,208.3 1.62%
Guests
Netherlands* 48,482.8 1.03%
Singapore 57,714.3 0.40%
Vietnam 2,342,2 0.28%
Rest of the World 12,046.8 (2,3) 13.56%
0 ,000 ,000 ,000 ,000 ,000 ,000 ,000 0% 5% 10% 15% 20% 25% 30%
10 20 30 40 50 60 70
* EU Member States
(1)
The euro area is composed of Austria, Belgium, Cyprus, Estonia, Finland, France, Germany, Greece, Ireland, Italy,
Latvia, Lithuania, Luxembourg, Malta, Netherlands, Portugal, Slovakia, Slovenia and Spain.
(2)
Members of the United Nations.
(3)
Missing data for Democratic People's Republic of Korea, Eritrea, Liechtenstein, Monaco, Syrian Arab Republic,
Venezuela.
Source: World Bank.
9Government debt, 2018
(% of GDP)
240%
250%
200%
150% 132,2%
107,8% 109,1%
98,4% 87,7% 87,7% 97,1%
100% 80% 86,8%
67,1%
60,9% 52,0% 55,6% 63,6%
50,8% 52,4% 52,4%
42,3% 38,3% 20,7% 28%
50% 29,2% 17,7%
0%
EU28 DE* FR* IT* UK* AR(e) AU(e) BR(e) CA(e) CN(e) IN(e) ID(e) JP(e) MX(e) KR(e) ZA(e) RU(e) SA(e) TR(e) US(e) ES* NL* SG(e) VN(e)
G20 members Guests
* EU Member States
(e)
estimated. Source: Eurostat and the International Monetary Fund.
Government deficit, 2018
(% of GDP)
2% 1,7% 1,5% 1,5%
1,4%
0%
-0,6%
-2% -1,5% -1,8% -1,8% -1,5%
-2,1%
-2,5% -2,5% -2,5% -2,4% -2,5%
-4% -3,3%
-3,7% -3,7%
-4,3%
-6% -5,6%
-5,8%
-6,2%
-8% -7,2%
-9,3%
EU28 DE* FR* IT* UK* AR(e) AU(e) BR(e) CA(e) CN(e) IN(e) ID(e) JP(e) MX(e) KR(e) ZA(e) RU(e) SA(e) TR(e) US(e) ES* NL* SG VN
G20 members Guests
* EU Member States
(e)
estimated. Source: Eurostat and the International Monetary Fund.
Employment rate of persons aged 15-64 years, 2018
(% of the whole 15-64 population)
90%
80.5%
80% 75.9% 76.8% 77.2%
74.7% 73.8% 73.8% 70.3% 70.7% 72.5%
68.6% 66.6%
70% 65.4% 66.1% 61.5%
61.6% 60.7% 62.4%
58.5%
60%
52% 52.5% 52%
50% 43.3%
40%
30%
20%
10%
0% N/A
EU28 DE* FR* IT* UK* AR2,3 AU BR CA CN IN2 ID2 JP MX KR2 ZA RU2 SA2 TR US1 ES* NL* SG VN
G20 members Guests
* EU Member States
N/A: Data not available.
¹ Persons aged 16-64.
² Argentina, Indonesia, Russia, South Korea, Singapore and Vietnam: 2017 instead of 2018. Saudi Arabia 2015 instead of 2018. India 2012
instead of 2018
³ Urban households.
Source: Eurostat and the International Labour Organisation (ILOSTAT).
10V. THE EUROPEAN UNION’S COMMITMENT TO REFORMING THE WORLD TRADE ORGANIZATION For the European Union, global trade rules have been the bedrock of its success. The World Trade Organization (WTO) is the ultimate rule setter for international commerce. Without it, businesses cannot rely on fair, predictable and equal trading conditions. The WTO and its predecessor, the General Agreement on Tariffs and Trade, have opened up international trade, helping create economic growth and lift hundreds of millions out of poverty. The WTO has ensured stability, clear rules that people can trust and a mechanism to resolve disagreements. But the WTO rules-based system is in crisis: as a consensus-driven membership body, the WTO has been unable to address the economic and technological changes of the past decades. Unfair practices by State- owned enterprises, forced technology transfers, outdated rules and unilateral action are testing it to its limits. A key part of its dispute settlement mechanism, the Appellate Body, could soon be paralysed, as the appointment of new judges to this body is blocked and the existing members’ mandates are expiring. By the end of 2019, the Appellate Body will only have one member left, yet it cannot function with fewer than three. This is why the European Union is engaging with like-minded partners in the G20 and with key WTO partners, as well as with China specifically through the dedicated bilateral Working Group established at the European Union-China Summit last year, in order to pave the way for a balanced and comprehensive reform of the WTO. How the EU is addressing WTO reform? 1. The European Union was the first WTO member to present a comprehensive approach to reform the WTO, including its negotiating, monitoring and dispute settlement functions, in September 2018. 2. In November 2018, the European Union, together with other WTO members, made a proposal for concrete changes to overcome the deadlock in the WTO Appellate Body. 3. The European Union is working with the US and Japan on strengthened rules on industrial subsidies. The European Union has also submitted an official proposal to strengthen WTO requirements on transparency and notification of government measures that can affect trade. A new global agreement on e-commerce In January 2019, a group of 76 members of the World Trade Organization, including the European Union, decided to launch negotiations that should result in a multilateral legal framework that consum- ers and businesses could rely on to make it easier and safer to buy, sell and do business online. The European Union together with Japan and the other interested parties will reiterate its willingness to engage in these negotiations in the margins of the Osaka Summit. The European Union as part of the world’s largest trade network The European Union is the first trading partner and the first foreign investor for almost every country on the globe. The European Union is also the most open market for developing countries in the world and introduces sustainable development principles in its modern trade agreements. We believe in an open and rules-based economy because it delivers jobs, prosperity and development. Trade policy should not only help create jobs and growth, but also promote social justice, respect for human rights, workers’ rights and high environmental standards. That’s why all comprehensive European Union trade agreements since 2014 include a trade and sustainable development chapter, with means to enforce it and a commitment to public scrutiny. The first trade agreement with a specific reference to the Paris Climate Agreement, with Japan, entered into force in February 2019. 11
The European Union stands firm against unfair and illegal trade practices and state subsidies to protect the
     interests of the European Union, its Member States, citizens, consumers, workers and businesses. The European
     Union did just that by reforming its trade defence instruments, by introducing an investment screening mechanism
     and by starting discussions on an International Procurement Instrument, which aims to ensure that European
     Union companies have better access to government contracts in countries outside the European Union.

     DID YOU KNOW?

                   The European Union is the                              The EU enabled export oppor-
                   number one trading partner                             tunities worth €6.1 billion by
                   of 80 countries worldwide                              breaking down trade barriers
                                               1.
                                                              350,000
           EU                                 80              The number of jobs that the European Union’s
                                                              trade defence measures are protecting. In the past
           U.S.      20                                       five years alone, the European Union has adopted
                                                              42 new anti-dumping and anti-subsidy measures,
     72                                                       bringing the overall number to 139.
     The number of countries across the world that have
     preferential trade agreements with the European          52
     Union. In the past five years alone, the European        The number of on-going European Union anti-
     Union has opened up trade relations with 15              dumping and anti-subsidy measures protecting
     countries, including Canada, Japan, Ecuador and          Europe’s steel sector from unfair trade practices,
     Ukraine.                                                 shielding 142,000 direct jobs in the sector. In an
                                                              effort to tackle global overcapacity in the steel
     15%                                                      sector, the European Union is an active player in the
     Increase in European Union exports between 2014-         Global Forum on Steel Excess Capacity which brings
     2018.                                                    together 33 of the world’s major steel producers - all
                                                              G20 members and other interested OECD countries.
     36 million
     The number of European Union jobs supported by           123
     exports - that’s 5 million more than in 2014.            The number of export barriers the European Union’s
                                                              action has helped to remove in the five last years,
                                                              such as illegal tariffs or discriminatory regulations in
     674,000                                                  countries outside the European Union.
     The number of European small firms that benefit
     from international trade.

                  The European Union is the
                  world’s biggest destination for
                  Foreign Direct Investment

     €6.2 trillion
     The stock of foreign direct investment in the
     European Union at the end of 2017.

     16 million
12   The number of jobs supported by foreign investment
     in the European Union.
EXPORTS OF GOODS AND SERVICES
Exports of goods and services Exports of goods and services
(% of GDP) (current prices, trillion U.S. dollars-TRN)
2017 2017
EU-28 48,5% 7.9 TRN
Germany* 47% 1.7 TRN
France* ( ) p
30.9% 0.8 TRN
Italy* 31.2% 0.6 TRN
United Kingdom* 30.1% 0.8 TRN
G20 members
Argentina 11.2% 0.07 TRN
Australia 21.3% 0.3 TRN
Brazil 12.6% 0.3 TRN
Canada 31% 0.5 TRN
China 19.8% 2.4 TRN
India 18.8% 0.5 TRN
Indonesia 20.2% 0.2 TRN
Japan 17.7% 0.9 TRN
Mexico 37.9% 0.4 TRN
Republic of Korea 43.1% 0.7 TRN
South Africa 29.8% 0.1 TRN
Russia 26.1% 0.4 TRN
Saudi Arabia 34.8% 0.2 TRN
Turkey 24.8% 0.2 TRN
United States 12.1% 2.4 TRN
Spain*( ) p
34.3% 0.5 TRN
Guests
Netherlands* ( ) p
83% 0.7 TRN
Singapore 173.3% 0.6 TRN
Vietnam 101.6% 0.2 TRN
0 20% 40% 60% 80% 100%120%140%160% 180% 200% 0 TRN 1 TRN 2 TRN 3 TRN 4 TRN 5 TRN 6 TRN 7 TRN 8 TRN
* EU Member States
(P) Provisional.
Source: Eurostat, World Bank.
13FOREIGN DIRECT INVESTMENTS
Net inflows Net outflows
(% of GDP) (BOP, current prices, billion U.S. dollars)
2017 2017
Net outflows
(% of GDP)
2017
3.5%
EU-28 4.4% 769.109
2%
Germany* 3.4% 125.040
1.8%
France* 2..2% 57.024
0.5%
Italy* 0.7% 13.007
2.5%
United Kingdom* 5.6% 147.078
1.8%
Argentina 0.2% 1.156
3.2%
Australia 0.3% 4.495
G20 members
3.4%
Brazil 0.3% 6.268
1.7% 81.199
Canada 4.9%
1.4% 101.914
China 0.8%
1.5% 11.090
India 0.4%
2.1%
Indonesia 0.2% 2.048
0.4% 168.569
Japan 3.5%
2.8%
Mexico 0.3% 3.385
1.1%
Republic of Korea 2.1% 31.676
0.4%
South Africa 2.1% 7.441
1.8%
Russia 2.3% 36.757
0.2%
Saudi Arabia 0.8% 5.625
1.3%
Turkey 0.3% 2.701
1.8%
United States 1.9% 379.221
0.5%
Spain*
Guests
2% 26.117
38.21%
Netherlands* 40% 332.315
19.6%
Singapore 7.6% 24.682
6.3%
Vietnam 0.2% 0.540
0 5% 10% 15% 20% 25% 30% 35% 40% 0 100 200 300 400 500 600 700 800
* EU Member States
Sources:
• Net inflows 2017 (% of GDP) : International Monetary Fund, International Financial Statistics and Balance of Payments databases, World Bank,
International Debt Statistics, and World Bank and OECD GDP estimates.
• Net outflows 2017 (% of GDP) : International Monetary Fund, Balance of Payments database, supplemented by data from the United Nations
Conference on Trade and Development and official national sources. The European Union’s bilateral trade agreements.
14 • Net outflows 2017 (BOP, current prices, billion U.S. dollars) : International Monetary Fund, Balance of Payments database, supplemented by
data from the United Nations Conference on Trade and Development and official national sources.The European Union’s bilateral trade agreements
The European Union has the largest trade network in the world. In the past five years, the European
Union’s two biggest trade agreements ever in terms of market size were put into operation: the European
Union-Canada Comprehensive Economic and Trade Agreement and the European Union-Japan Economic
Partnership Agreement. Together, these agreements will help European Union businesses save up to €1.6
billion in customs duties per year once all tariffs are phased out.
The EU-Japan agreement alone has created a free trade area that covers almost
one third of the world’s GDP and more than 630 million citizens.
In the first year of operation of the European Union-Canada agreement, European
Union exports of goods to Canada grew by 9% or more than €3 billion. European
Union imports from Canada also increased. This means new opportunities for 72,000
European Union exporters and 54,000 European Union importers trading with
Canada.
Since 2014, the European Union has also negotiated and agreed five new or reformed deals with Mexico,
Singapore, Vietnam, the East African Community (Burundi, Kenya, Rwanda, Tanzania, and Uganda) and 16
West African countries. These agreements are waiting to be applied.
The European Union has also started talks for new or upgraded agreements with Australia, Chile, Indonesia,
New Zealand and Tunisia and revived negotiations with the South American trading bloc, Mercosur.
Negotiations also continue for an investment agreement with China.
15THE STATE OF EU TRADE IN 2019
EU & Customs Union (Andorra, Monaco, San Marino, Turkey)
European Economic Area (Norway, Iceland, Lichtenstein)
Potential for free trade partnership
Preferential trade agreement in place (FTA, EPA, DCFTA, OCTAA)
Preferential agreement awaiting adoption/ratification
Preferential trade agreement being negotiated
Existing preferential agreement being modernised
Stand-alone investment agreement being negotiated
Source: European Commission.
16VI. THE EUROPEAN APPROACH TO SHAPE THE
DIGITAL ECONOMY
It is a priority of the European Union to ensure that Europe’s citizens have the best possible access to the
online world and are equipped with the right digital skills. At the same time, the European Union’s single
market in which the movement of goods, capital, services and labour is unrestricted, has had to adapt to
the digital era. Successes such as eliminating roaming charges and preventing unjustified geoblocking, for
example, are making the digital single market fit for purpose. Today the European Union has a range of
instruments including the first European Union-wide legislation on cybersecurity, measures to protect our
democratic systems and public debates from disinformation, and the General Data Protection Regulation in
2018, for example, which have set global benchmarks on how to protect citizens online.
The European Union has set global standards when it comes to data protection
The General Data Protection Regulation, in application since May 2018, has not only made Europe fit for
the digital age, it has also set a new global standard for privacy. This single, pan-European law safeguards
citizens’ fundamental right to data protection while enabling individuals and companies to fully seize the
opportunities of the European digital single market without having to go through 28 different costly and
bureaucratic procedures.
The principles of Europe’s data protection regulation are inspiring data protection rules around the world:
From Chile to Japan, from Brazil to South Korea, from Argentina to Kenya, we are seeing new privacy laws
emerge, based on strong safeguards, enforceable individual rights, and independent supervisory authorities.
Such upward convergence offers new opportunities to promote data flows based on trust and security.
The modern general data protection standard is now followed in countries accounting for 42% of global GDP
and 34% of global trade.
DID YOU KNOW?
€2.3 billion €43.2 billion
The savings for companies per year since
there is one set of data protection rules in The amount that the European Union has
the EU, instead of 28. invested in the digital sector in the
European Union.
130 13
The number of countries outside the The number of countries with which the
European Union which have adopted data European Union has agreed adequacy
protection laws, many of them inspired by arrangements with, allowing for free
the European model, representing 42% of and secure flow of data, including
the world’s gross domestic product and Argentina, Canada, Switzerland and the
34% of world trade. US under the Privacy Shield. With Japan,
the European Union has created the
world’s largest area of free and safe
data flows.
172,800 €1 billion
The number of municipalities in Europe The amount that is being invested by the
that have so far been selected to receive European Union with its Member States
a voucher worth €15,000 to spend on to build a world-class European
setting up WiFi hotspots in public spaces supercomputing infrastructure.
such as town halls, libraries, museums,
parks, squares and other places of public
interest.
€0.19 €20 billion per year
The price cap for intra-European Union The minimum public and private
calls per minute. research investment target in Artificial
Intelligence in the European Union until
the end of 2020.
The European Union is investing The European Union is fighting
in human centric artificial for fair tax rules in the digital
intelligence economy
The European Commission’s strategy on All companies — big or small, global or local, digital
Artificial Intelligence (AI) places people at the or analogue — must pay a fair share of tax where
centre of new technologies. For the European Union, real economic activity is taking place and where
respecting fundamental rights and ethical rules their profits are actually made. On average, digital
is not a luxury feature or an add-on, but the very businesses face an effective tax rate of only 9.5% in
essence of artificial intelligence “made in Europe”. Europe, compared to 23.2% for traditional business
models.
Since technologies, data and algorithms know no
borders, the European Commission wants to bring The European Commission has put forward
this approach to Artificial Intelligence ethics to proposals to change that in Europe and we want
the global stage. To this end, the Commission will to work, through the G20 and the Organisation for
strengthen cooperation with like-minded partners Economic Cooperation and Development, to find
such as Japan, Canada or Singapore and continue to global solutions for a fair taxation of the digital
play an active role in international discussions and economy by 2020.
initiatives including the G7 and G20.
18The European Union is working The European Union’s efforts
to prevent the dissemination in protecting citizens online
of terrorist and hate content have already borne
online successful results
Terrorist propaganda has no place in our societies – Since the European Union’s Code of Conduct on
online or offline. Many of the recent attacks have shown countering illegal hate speech online was launched
how terrorists misuse the internet to spread their in May 2016, we have seen an increased number of
messages. The European Union has taken significant xenophobic or racist content being taken off the web.
steps to address terrorist content online through The speed at which content is flagged, assessed
the voluntary cooperation in the European Union as illegal online hate speech, and subsequently
Internet Forum with Europol as well as the European removed within the crucial 24 - hour window before
Commission’s recent proposals to take terrorist content it can spread further, has also rapidly increased.
off the web within 1 hour – the critical window in which
the greatest damage is done.
That’s why President Juncker fully supports the 89%
Christchurch Call co-initiated by French President
Emmanuel Macron and New Zealand Prime Minister
Jacinda Ardern to collaborate on tackling terrorism in
the digital age. The European Commission’s next step 28%
will be to develop a crisis protocol in the context of
the European Union Internet Forum for governments
and online platforms to be able to respond rapidly
and in a coordinated manner to the dissemination of 2016 2019
terrorist content online, while ensuring full respect of
fundamental freedoms such as the freedom speech. Illegal online hate speech removed within
The leaders and the online platforms will meet again 24 hours after signalisation.
in autumn 2019.
19WORLD POPULATION AND DISTRIBUTION
World population Distribution of world population
(in million people) (%)
2017 2017
EU-28 512.4 6.81%
Germany* 82.7 1.10%
France* 67.1 0.89%
Italy* 60.5 0.80%
United Kingdom* 66 0.88%
Argentina 44.2 0.59%
Australia 24.6 0.33%
G20 members
Brazil 209.3 2.78%
Canada 36.7 0.49%
China 1,386.4 18.41%
India 1,339.2 17.79%
Indonesia 263.9 3.50%
Japan 126.8 1.68%
Mexico 129.2 1.72%
Republic of Korea 51.5 0.68%
South Africa 56.7 0.75%
Russia 144.5 1.92%
Saudi Arabia 32.9 0.44%
Turkey 80.7 1.07%
United States 325.1 4.32%
Spain* 46.6 0.62%
Guests
Netherlands* 17.1 0.23%
Singapore 5.6 0.07%
Vietnam 95.5 1.27%
% 0% %
0 200% 400% 600% 800% 1,000 1,20 1,400 1,500% 0 2% 4% 6% 8% 10% 12% 14% 16% 18% 20%
* EU Member States
Source:
(1) Eurostat: Demographic Statistics.
(2) United Nations Population Division. World Population Prospects: 2017 Revision.
(3) Census reports and other statistical publications from national statistical offices.
(4) United Nations Statistical Division. Population and Vital Statistics Reprot (various years).
(5) U.S. Census Bureau: International Database.
(6) Secretariat of the Pacific Community: Statistics and Demography Programme.
20OLD-AGE-DEPENDENCY RATIO
Old-age-dependency ratio, 65 years and above
(% of population aged 15-64)
1990 2020(p) 2050(p) 1990 2020(p) 2050(p)
50.3%
31.7%
20.6% 19.8%
6.6% 9.8%
EU-28 India
51.2%
33.7%
21.5% 8.5% 20.7%
6.3%
Germany* Indonesia
71.2%
45.1% 47.8%
21.2% 32.8%
17%
France* Japan
62.5%
36.1% 29.2%
21.6%
7.5% 11.3%
Italy* Mexico
66.3%
G20 members
40%
24.2% 29.1% 22.1%
7.5%
United Kingdom* Republic of Korea
28.5%
15% 18.1% 8.7% 15.9%
6%
Argentina South Africa
37.2% 36.5%
16.5% 25.2% 23.3%
15.4%
Australia Russia
36.7%
25.1%
6.7% 13.7% 5.1%
Brazil Saudi Arabia 5.2%
43.8%
28% 32.8%
16.5% 7.7% 13.1%
Canada Turkey
44%
36.4%
17.3% 19.2% 25.7%
8.6%
China United States
71.2%
60.6%
20.1% 31.2% 21.3%
Guests
7.7%
Spain* Singapore
48.2%
31.2% 34.9%
18.4% 10.1% 11.7%
Netherlands* Vietnam
*EUWorld
Source: Member States
Bank staff estimates based on age distributions of United Nations Population Division’s World Population Prospects: 2017 Revision.
(p) projections.
21VII. THE EUROPEAN UNION ADDRESSING
DEMOGRAPHIC CHALLENGES
Europe remains the leading continent in the world when it comes to progress made towards reducing
inequalities, although the challenge for the European Union is the risk of the welfare gap widening between
Member States, notably between urban and rural areas. A large, thriving middle class is typically associated
with economic growth and political stability, and some 75% of Europeans identify as ‘middle class’. However,
as the middle class grows globally, 15 European Union Member States have seen their middle class shrink
compared to 6 where there has been growth since 2005. Technology and automation are revolutionising the
world of work, and as is the case across the world, most workers in the European Union will need to change
their job and renew their skills many times during their career. The European Union also faces an ageing
population and on a scale unlike anywhere else in the world. This will place a significant strain on public
health systems and is a key challenge for Europe’s societies today. The European Union is addressing these
societal and demographic challenges with a wide range of actions from the European Pillar of Social Rights
to building a European Education Area and creating a European Labour Authority and ensuring workers earn
the same pay for the same work in the same place in the European Union, wherever they come from.
DID YOU KNOW?
45 20% 83.6 78.2 10.6 1.6
The median The European The The average The gap (in The fertility rate
age in Europe population aged average life life expectancy years) between in the European
by 2035, 65 and above, expectancy for men (up by the life Union, compared
making compared to for women in 3.7 years since expectancy of to the G20
Europeans the 13.3% in the the European 2002). men and women average of 1.8.
oldest in the rest of the G20 Union (up in Lithuania – the
world. in 2017. by 2.7 years largest in the
since 2002). European Union.
Median age by region of the world, projection by 2030
45
Europe
40
North 35
America Asia
21
Africa
34 35
Latin America
& Caribbean Oceania
33
World
Source: Rand Europe.
22The Future of Work
In the context of rapid societal developments and an ageing population, in 2017 the European Union
proclaimed a European Pillar of Social Rights, committing itself to a set of 20 principles and rights, from fair
wages to the right to health care, from lifelong learning, a better work-life balance and gender equality, to
minimum income.
The European Commission is responding to a changing labour market with proposals to address gaps in
social protection across the European Union:
• to ensure that workers and the self-employed in comparable conditions can adhere to corresponding
social security systems;
• to ensure that they are offered adequate effective coverage, so that they can build up and claim adequate
entitlements;
• to facilitate the transfer of social security entitlements from one job to the next;
• and ensure that workers and the self-employed are given transparent information about their social
security entitlements and obligations.
The ‘Skills Agenda for Europe’ is comprised of 10 initiatives to equip Europeans with the right skills for
today’s job market. Vocational education and training is supported via a variety of programmes:
• ErasmusPro - fully operational since 2018 and expected to provide 50,000 young people with new
mobility opportunities over the years 2018–2020;
• the European Alliance for Apprenticeships which has so far mobilised over 900,000 places for young
people;
• 84% of Europeans have access to the Internet. The Digital Skills and Jobs Coalition which brings Member
States, companies, and education providers together to take action and boost digital skills of the wider
population beyond IT professionals;
• and the Skills Profile Tool for Third Country Nationals, which helps national authorities identify the skills
of non-European Union migrants and is available in all European Union languages as well as Arabic, Farsi,
Pashto, Sorani, Somali, Tigrinya and Turkish.
23DID YOU KNOW?
292 million €101.2 billion
333
million
The predicted size of the European The amount that will be available to
292
Union’s working-age population Europeans from the next long-term
million (people aged between 15 and 64) European Union budget to help them
by 2070, a decrease from 333 find a job, gain a qualification or
2016 2070 million in 2016. certificate, and increase their skills
levels.
40% 112,100
The share of people in the European The number of dismissed workers and
Union who are currently in an young people in the European Union
atypical employment situation - that have been supported by the
meaning that they are not working European Globalisation Adjustment
under a full-time, open-ended Fund since 2007. An average of €170
contract - or self-employed, and are million of financial support available
not always well covered in terms of every year has supported applications
social security, lacking from 20 countries.
unemployment insurance or access
to pension rights.
Individuals using the Internet, 2017
(% of population)
95% 93% 95% 95%
91%
90% 84% 90% 87% 87% 85% 84%
82%
80% 76% 76% 75%
71%
70% 67% 65%
64%
60% 56%
54%
50% 50%
40%
34% 32%
30%
20%
10%
0%
EU28 DE* FR* IT* UK* AR AU BR CA CN IN ID JP MX KR ZA RU SA TR US ES* NL* SG VN
G20 members Guests
* EU Member States
Source: Eurostat, International Telecommunication Union, World Telecommunication/ICT Development Report and database.
Internet users are individuals who have used the Internet (from any location) in the last 3 months.
24Health
T he European Union advocates equitable, universal and high-quality healthcare coverage and promotes fair,
effective financing of research to benefit the health of all.
T he European Pillar of Social Rights aims to ensure access to social protection for all workers and self-
employed individuals in the European Union, an important step towards delivering on our commitment to
make healthcare accessible to all citizens, including preventative care as well as medical treatment.
In 2016 the European Union set up a European Medical Corps to dispatch medical experts to tackle health
emergencies such as epidemics or infectious diseases both inside and outside Europe.
s part of the European Union’s One Health Action Plan against antimicrobial resistance which aims to
A
make the European Union a best practice region, the European Commission has adopted guidelines on the
prudent use of antimicrobials in human health, with the aim of reducing inappropriate use and promoting
the prudent use of antimicrobials in people.
DID YOU KNOW?
26.7% €475 million
The predicted percentage of European The amount donated by the European
Union GDP that will be required to fund Union for health initiatives to boost
the cost of ageing in the European research and provide support to fight
Union by 2070. AIDS, Tuberculosis and Malaria across
the world.
33,000 €200 million
The number of deaths in the European The amount per year given in
Union as a result of antimicrobial humanitarian assistance by the
resistance. Globally the figure stands at European Union to support health
700,000 deaths per year. It is also programmes that seek to limit mortality,
estimated to cost the European Union disability and disease associated with
€1.5 billion annually. humanitarian crises.
25Education
T he primary responsibility for education, training and culture policies lies with the European Union’s Member
States but the European Union has ‘soft policy’ tools that are bearing fruit.
I n 2010 the European Union set itself two education targets under the Europe 2020 Strategy to reduce early
school leaving and increase university level education. Early school leaving has been reduced from 17% in
2002 to 10.6% in 2018, and tertiary educational attainment is up from 23.6% in 2002 to 40.7% in 2018.
Early school leaving Tertiary educational attainment
40.7%
17% 23.6%
10.6%
2002 2018 2002 2018
Source: European Commission.
T he support for Europe-wide educational experiences is overwhelmingly clear amongst European Union
citizens. The European Union is building a European Education Area with key targets promoting lifelong
learning with a goal of 25% of people engaging by 2025, for example, and setting an European Union-wide
benchmark for investment in education at 5% of GDP.
DID YOU KNOW?
4.6% 8.8 million
The average percentage relative to GDP The approximate number of teachers in
invested by EU Member States in their the EU in 2017, distributed across all
education systems in 2017. education levels.
11.1% 85.5%
The average participation rate in adult The employability rate of tertiary
learning for 25-64 year olds in the EU. graduates in the EU in 2018.
The target is 15% by 2020.
10 million 95%
The number of people who have The EU’s 2020 target for the participation
benefitted from the European Union’s in early childhood education of children
Erasmus exchange programme over the between the age of 4 and the starting
last 32 years. Last year alone, the EU age for compulsory education in the EU.
invested a record €2.8 billion resulting in The EU has surpassed this target with a
mobility grants for 842,000 Europeans to current participation rate of 95.4%.
study, train, teach, work or volunteer
abroad.
26VIII. WOMEN EMPOWERMENT
T he European Union places gender equality at the centre of its external action through multiple partnerships
with multilateral and regional partners. In the G7 context, the European Union and Canada co-hosted the
first-ever meeting of Women Foreign Ministers in September 2018 where they pledged to build a network of
governments and civil society organisations to advance gender equality and girls’ and women’s rights, and
to work towards implementing existing commitments. The European Union also fully supports the Japanese
World Assembly of Women initiative as a forum bringing participants from all over the world to exchange
views on gender equality.
T he European Commission has adopted an action plan with 24 actions to tackle the gender pay gap in the
European Union, including raising awareness of the importance of gender-neutral job classification systems
to ensure equal pay in practice.
The European Union directly supports gender equality through business support to women entrepreneurs
and improving the quality and access to childcare. For early childhood education and care infrastructure,
€1.23 billion has been programmed in the 2014-2020 period.
Through the European Union’s research and innovation programme – Horizon 2020 – the European
Commission is supporting research organisations and universities to put in place gender equality plans.
These will help improve the conditions for more women scientists to work in research and innovation.
The launch of the Spotlight Initiative by the European Commission together with the United Nations
addresses gender-based violence at global level. Several country programmes have already been launched,
including in Latin America and the Pacific region.
Gender Employment gap in the EU Gender pay gap in the EU
(20-64)
17.1%
75.9% 77.8% 79.0%
16.6% 16.5%
16.2%
11.5% 16.0%
16% 15.1%
62.7% 67.5%
59.9%
2005 2008 2018
2010 2014 2015(p) 2016(p) 2017(p)
Men Women Gap
(p) Provisional.
Source: European Commission.
Since the commitments made by G20 leaders in 2014 at the Brisbane Summit, the gender pay gap in the
European Union has steadily declined but significant differences remain between the European Union’s
Member States.
Barriers recently underlined by the OECD on women at work, are recognised and are being addressed by
the European Union, such as work-life balance as part of the European Pillar of Social Rights. Through the
European Social Scoreboard, the European Union monitors differences between Member States including
gender equality in the labour market.
27DID YOU KNOW?
6.4 million 40%
The additional number of women in Female participation in management
2017 that held a university level positions that the Commission committed
education compared to men in the to achieve by 1 November 2019. The
European Union. figure is currently 39.6%.
73.2% 3 November 2018
The percentage of people aged 20-64 in The European Union Equal Pay Day.
employment in the European Union - the Every year the European Union marks
highest rate recorded since 2002. This the date when women symbolically stop
figure is largely attributable to a growing being paid compared to their male
share of working women. colleagues. In 2018 the date was marked
with 16% of the working year remaining.
16% €3.3 million
The amount of European Union funding
The percentage difference between
that has been granted to projects
women and men’s hourly earnings in the
combatting stereotypes, with regard to
European Union in 2017. The figure
career guidance and career choices.
varies from less than 4% in Romania to
25.6% in Estonia.
5
10
The number of days of leave per year for
The number of working days of paternity carers providing personal care or support
leave available for all fathers or equivalent to a relative or person living in the same
second parents in the European Union, household in the European Union.
compensated at least at the level of sick
pay.
Female share of employment in senior and middle management, 2017
(% of population)
45%
39% 41%
40% 38%
36% 35%
35% 34% 33%
31% 32% 31%
30% 28%
26%
25% 22%
20% 19%2
17% 16%3
15% 13%1
10%
5%
0% N/A N/A N/A N/A N/A N/A N/A
EU28 DE* FR* IT* UK* AR AU BR CA CN IN ID JP MX KR ZA RU SA TR US ES* NL* SG VN
G20 members Guests
N/A: Data not available / 1: 2012 data / 2: 2010 data / 3: 2007 data
* EU Member States
Source: International Labour Organization, ILOSTAT database.
28IX. SUSTAINABILITY
Protecting the planet
Europe has a strong starting position and record of accomplishment in sustainable development. The
European Union has the world’s most ambitious climate and energy policies, playing a major role in the
Paris Climate Agreement, and demonstrating that reducing emissions does not hinder economic growth. The
European Union has made good progress on almost all Sustainable Development Goals, with the highest
score on average for Sustainable Development Goal 1 – ending poverty in all its forms everywhere. Today,
sustainability features in European Union policy-making across the board, from the economy to social policy
and equipping Europeans with the right skills for the future of work, better protecting our oceans by ridding
them of plastic waste, and creating a truly circular economy. Beyond the European Union’s borders, the
European External Investment Plan, for example, has created a new standard in the use of public funding
to leverage private investment for sustainable development in partner countries. The new Africa-Europe
Alliance for Sustainable Investment and Jobs, launched in September 2018, is solely focussed on unlocking
sustainable investments, with the perspective of creating up to 10 million jobs in Africa in the next five
years alone. Systemic change is required for a healthy future. From the local level, to the European level and
beyond, the European Union is putting the right building blocks in place to protect our planet for the future
and ensure that no one is left behind.
Europe has shown that it is possible to reduce emissions, while creating prosperity and high-quality local
jobs in a competitive economy. From 1990 to 2017, European Union emissions declined by 22% while
Europe’s Gross Domestic Product grew by 58%. Under the Paris Agreement on climate change, the European
Union has now committed to cut at least 40% in greenhouse gas emissions by 2030 compared to 1990.
DID YOU KNOW?
25% Over 85%
The share of the next European Union’s A The share of consumers that use the
B
budget that should be spent on climate C Energy Label when purchasing, saving up
action, according to the proposal put D
E
to €500 per household every year.
forward by the European Commission. F
G
20% 3 of the top 5
The percentage of all European Union Of the biggest clean technology
greenhouse gas emissions from road companies in the world are European.
transport alone.
1 million €15 billion
The potential number of jobs that can The amount from the European Fund for
be created by the climate and energy Strategic Investment which has supported
sectors, in addition to the 4 million the environment and resource efficiency
‘green jobs’ in the European Union sector.
today.
29Over €136 billion 13 million tons
Money invested from the European The amount of plastic waste that ends
Structural and Investment Funds in up in the world’s oceans every year,
environment protection, resource this amounts to 85% of all marine
efficiency, climate change adaptation litter.
and risk prevention and the shift
towards a low carbon economy in all
sectors in the 2014-2020 European
Union budget period.
€375 million Up to 300,000 tonnes
The amount invested by the European The potential reduction of garbage
Commission between 2007 and 2015 discharged annually, thanks to the
in research and innovation projects on measures taken by the European
battery technologies. Between 2018 Union in line with Sustainable
and 2020, the Commission will invest Development Goal 14 – conservation
an additional €200 million from the and sustainable use of the oceans,
Horizon 2020 programme to support seas and marine resources, and 22 –
the development and production in ensuring sustainable consumption and
Europe of the next generation of electric production patterns. The EU’s
batteries. measures will also help to significantly
reduce sewage and oily waste
discharges.
2030 $8 billion
The year by which the European Union The estimated global cost per year in
has committed to reducing its damage to marine environments.
greenhouse gas emissions by at least
40% (compared to 1990).
Protecting the oceans
By 2021, single-use plastic items including plastic cotton buds, cutlery, plates, straws, drink
stirrers and sticks for balloons, will be banned in the European Union. The European Union’s
Member States will also be obliged to reach a 90% collection rate for disposable plastic drink
bottles by 2025.
The European Union is active in developing common and coordinated responses to plastic
waste and marine litter through the UN Global Partnership on Marine Litter, and through G7 and
G20 initiatives. Most recently, at the United Nations Environmental Assembly in December
2017, the European Union helped secure a series of international commitments to address the
problem of marine litter and bioplastics.
An effective European Union regime, based on international norms (MARPOL), should result in
a reduction of the administrative costs of waste management for ports, ships and competent
authorities of approximately €7 million per annum.
Led by the European Union, the Our Ocean summit in October 2017 saw public and private
actors from 112 countries commit more than €7 billion to better managing the oceans. This
will make oceans healthier, safer and will help the blue economy grow.
30GREENHOUSE GAS EMISSIONS
Greenhouse gas emissions per capita
(million tonnes of CO2-equivalents)
1990 2016
EU-28 11.9 8.7(p)
Germany* 9.3 11.4
France* 9.3 7.1 (p)
Italy* 9.1 7.2
United Kingdom* 13.9 7.9
Argentina 7.1 9(1)
Australia 24.6 21.7
G20 members
Brazil 10.8 14.9(1)
Canada 22 18.7
China 3.6 9.2(1)
India 1.4 2.4(1)
Indonesia 1.5 3.1(1)
Japan 10.3 9.8
Mexico 4.7 5.5(1)
Republic of Korea 6.8 13.3(1)
South Africa 9.2 10.1(2)
Russia 25.4 13.9
Saudi Arabia 10.1 18.2(3)
Turkey 4 5.4
United States 25.5 17.9
Spain* 7.4 7.3
Guests
Netherlands* 14.9 12.2
Singapore 10.5(4) 10.5(1)
Vietnam 1.5 3(1)
25% 20% 15% 10% 5% 0 5% 10% 15% 20% 25%
* EU Member States
p
: Provisional.
¹ 2012 data.
² 2007 data.
³ 2011 data.
4
2003 data.
Source: Eurostat, UNFCCC Data Interface, European Commission, Joint Research Centre (JRC)/Netherlands Environmental Assessment Agency
(PBL). Emission Database for Global Atmospheric Research ( EDGAR ), EDGARv4.2 FT2012: edgar.jrc.ec.europa.eu.
31ENERGY CONSUMPTION
SOLID PETROLEUM NUCLEAR RENEWABLES
GAS
FUELS PRODUCTS ENERGY AND WASTE
(% of gross inland consumption)
2016
EU-28 14.7 34.6 23.4 13.2 14.1
Germany* 24 33.8 21.9 6.8 13.5
France* 3.4 29.8 15.2 41.2 10.4
Italy* 7.3 36.5 38.3 0 18
United Kingdom* 6.3 38 37 9.9 8.9
Argentina 0.4 48.6 41.9 4.1 5
Australia 3.9 68 20.9 0 7.3
Brazil 3.6 54.4 6.8 2.2 33
G20 members
Canada 1.4 52.3 25.9 15 5.4
China 47.7 33.2 7.6 3.8 7.8
India 20.3 37.5 6.6 2 33.6
Indonesia 6.5 45.8 9.2 0 38.4
Japan 10 69.8 15 2.2 3.1
Mexico 1.9 74.2 14.1 3 7
Republic of Korea 5.5 54.8 12.5 24.6 2.6
South Africa 29.2 45.3 3 6.8 15.7
Russia 3.3 38.2 42.8 14.7 1
Saudi Arabia 0 81.5 18.5 0 0
Turkey 26.9 48.5 28.1 0 7
United States 1.3 53.1 24 15.6 5.9
Guests
Spain* 8.4 44 20.6 12.5 14.5
Netherlands* 13 41.2 38.6 1.3 5.8
Singapore 1.2 90.6 8.2 0 0
Vietnam 28.2 40 3.1 0 28.7
* EU Member States
Data excludes electrical energy and heat.
Source: Eurostat and the International Energy Agency.
32The European Union’s Partnership with Africa
In September 2017 the European Union launched the External Investment Plan to boost investment in the European
Union’s partner countries in Africa and in the European Union’s neighbourhood. The aim is to contribute to the UN’s
Sustainable Development Goals while tackling the root causes of migration, as well as leveraging sustainable public
and private investments to improve economic and social development with a particular focus on decent job creation.
The new Africa-Europe Alliance for Sustainable Investment and Jobs, launched in September 2018, is already
delivering.
In 2018 alone, the European Union committed over €540 million, notably through the European Union’s External
Investment Plan but also through regional and country level cooperation, to support business and investment climate
reforms – significantly exceeding the Africa-Europe Alliance’s commitment to increase the European Union’s support
up to €350 million.
In an increasingly interconnected world, the European Union seeks to help create conditions for sustainable connectivity.
This is why the European Union is working with Asia – a region with the biggest demand for infrastructure and the
highest predicted growth in the world, which together with the European Union accounts for 60% of the world’s GDP.
This approach is best served when countries adopt sound regulatory frameworks, create better business conditions,
are fiscally responsible, and encourage open markets.
DID YOU KNOW?
€37.1 billion 105,000
The amount which the European Students and academics that will benefit
Union’s investment of €3.7 billion from Erasmus+ by 2027.
(through the European Fund for
Sustainable Development) is expected
to leverage in 2018.
10 million 750,000
The number of jobs that will be created The number of people who will receive
in Africa in the next 5 years thanks to vocational training for skills development.
the Africa-Europe Alliance.
24 million 30 million
The number of people who will have The number of people and companies
access to all-season roads through our that will benefit from access to electricity,
leveraged investments in transport thanks to the EU’s leveraged investment
infrastructure. in renewable energy and generation
capacity boosted by 5 GW.
More competition for influence in Africa
BrazilBrazil
China India
Growth in imports to
EU28
Indonesia
Africa, 2006 -2016 (%)
IndiaRussia
IndonesiaTurkey Growth in exports from
RussiaChina Africa 2006-2016 (%)
TurkeyUnion
European
United United
StatesStates
WorldWorld
-100 -100 -50 -500 50
0 100 50 150 100200 250
150 300
200 350 250
Change in exports from Africa 2006-2016 33
Change in imports to Africa, 2006 -2016 Source: Brookings based on IMF, Direction of Trade Statistics, 2017You can also read