DIGITAL FINGERPRINTS OF COGNITIVE REFLECTION - PSYARXIV
←
→
Page content transcription
If your browser does not render page correctly, please read the page content below
1       Digital Fingerprints of Cognitive Reflection
 2        Mohsen Mosleh1, Gordon Pennycook2, Antonio A. Arechar1, and David G. Rand1,3,4
 3
 4   1
       Sloan School of Management, Massachusetts Institute of Technology; 2Hill/Levene Schools of Business,
 5   University of Regina; 3Department of Brain and Cognitive Sciences, Massachusetts Institute of Technology;
 6   4
       Institute for Data, Systems, and Society, Massachusetts Institute of Technology
 7
 8
 9                                     Corresponding authors: mmosleh@mit.edu
10                           This working paper has not yet been peer-reviewed.
11                                         Posted April 14 2020
12
13         Social media is playing an increasingly large role in everyday life. Thus, it is of both
14   scientific and practical interest to understand behavior on social media platforms.
15   Furthermore, social media provides a unique window for social scientists to deepen our
16   understanding of the human mind. Here we investigate the relationship between
17   individual differences in cognitive reflection and behavior on Twitter in a sample of N =
18   1,953 users recruited via Prolific Academic. In doing so, we differentiate between two
19   competing accounts of human information processing: an “intuitionist” account whereby
20   reflection plays little role in daily life, and a “reflectionist” account whereby reflection
21   (and, in particular, overriding intuitive responses) does play an important role. We found
22   that people who score higher on the Cognitive Reflection Test (CRT) – a widely used
23   measure of reflective thinking – were more discerning in their social media use: They
24   followed more selectively, shared news content from more reliable sources, and tweeted
25   about weightier subjects (e.g. politics). Furthermore, a network analysis indicated that
26   the phenomenon of echo chambers, in which discourse is more likely with like-minded
27   others, is not limited to politics: we observe “cognitive echo chambers” in which people
28   low on cognitive reflection tend to follow the same set of accounts. Our results help to
29   illuminate the drivers of behavior on social media platforms, and challenge intuitionist
30   notions that reflective thinking is unimportant for everyday judgment and decision-
31   making.
32
33
34          Social media has become a dominant force in modern life – it is a major channel for
35   social interactions, political communications, and commercial marketing. Social media can
36   have both positive and negative impacts. For example, on the positive side, user-generated
37   content on social media has facilitated social connection by helping friends and relatives who
38   are separated by distance stay abreast of what is happening in each other’s lives1,2, and by
39   helping to connect strangers that have similar interests3. Social media has also helped to spread
40   invaluable information about topics such as awareness of diseases and philanthropic causes
41   (e.g., the ALS ice bucket challenge4), helped people in need generate resources (e.g.,
42   crowdfunding for medical bills5), and quickly disseminated information during disasters (e.g.,
43   Facebook’s “marked safe” tool6). However, social media also allows the spread of
44   misinformation and scams7-10, may facilitate the emergence of echo chambers and political
45   polarization11-13, and could be a host for interference and automated propaganda bots14-18.
46          Given the substantial importance of social media in people’s lives, and the wide range of
47   content available therein, it is therefore of scientific and practical interest to understand how
48   people interact with social media, and what influences their decisions to share various types of
49   content and follow different accounts/pages. Prior work in this vein has explored the

                                                        1
50 relationship between social media use and various personality and demographic measures, such
51 as the “Big-Five” personality traits19-22, the “Dark Triad” personality traits23,24,
52 partisanship25,26, age25,26, and gender27.
53 Here we add to this literature by contributing an account of basic information processing
54 that is capable of explaining social media engagement across a wide range of content. We do
55 so using the lens of cognitive science. Furthermore, by assessing how people behave on social
56 media, we help to litigate an ongoing debate within the cognitive science literature between
57 two competing accounts of the cognitive factors that determine people’s beliefs and behaviors.
58 This debate is grounded in dual-process theories, which distinguish reflective or analytic
59 thought from the intuitive responses that emerge autonomously (and often quickly) when an
60 individual is faced with a triggering stimulus28-31. One of the key implications of this distinction
61 is that analytic thinking (unlike intuitive processing) is, to some extent, discretionary – that is,
62 people may or may not engage in deliberation at any given time, and this tendency to deliberate
63 varies across individuals29,32. Consider the following question: “If you’re running a race and
64 you pass the person in second place, what place are you in?”33 The answer that intuitively
65 comes to mind for many people is ‘first place’, but this is not the correct answer (if you pass
66 the person in second place, you are in second place). Correctly answering problems such as
67 this therefore typically requires most individuals to stop and think analytically, over-riding an
68 intuitive response that, at first blush, seems correct34-37. This individual difference is often
69 referred to as cognitive style. Here we will investigate how cognitive style relates to behavior
70 on Twitter. To do so, we will measure cognitive style using the Cognitive Reflection Test
71 (CRT) 34 – a set of questions with intuitively compelling but incorrect answers (such as the
72 example above) that is widely used in behavioral economics and cognitive psychology to
73 measure the propensity to engage in analytic thinking (and that does not strongly correlate with
74 personality, e.g., ‘Big Five’38,39).
75 Although there appears to be general agreement surrounding the theoretical utility of
76 dual-process theory (although for alternative perspectives, see40,41), there is a great deal of
77 disagreement about the relative roles of intuition and reflection in people’s everyday lives. It
78 has been famously argued that humans are like an “emotional dog with a rational tail”42 – that
79 our capacity to reflect is underused in such a way that its primary function is merely to justify
80 our intuitive judgments43. Similarly, it has been argued that the main function of human
81 reasoning is argumentation rather than truth-seeking44,45.
82 Unlike in the example CRT question given above, where analytic thinking is integral to
83 correcting our (sometimes inaccurate) intuitive impulses (see ref 31), this “intuitionist”
84 perspective implies that, although people may sometimes override intuitive responses on
85 idiosyncratic word problems administered in social science studies, the real-world function of
86 analytic thinking is to merely justify and reinforce the beliefs and behaviors that we have
87 learned culturally. Relatedly, it has been argued that human capacity to reflect actually reduces
88 accuracy by driving polarization around ideological issues46,47 – thus, by this account,
89 reasoning is not simply unable to direct our beliefs and behaviors beyond intuition; in some
90 cases, it actively makes us less reasonable.
91 However, there is also a growing literature that demonstrates positive everyday
92 consequences of analytic thinking29. This “reflectionist” perspective48 argues that thinking
93 analytically actually does have a meaningful impact on our beliefs and behaviors, and typically
94 does so in a manner that increases the accuracy of our beliefs. Evidence for this account comes
95 from lab studies where analytic cognitive style (e.g., higher score on the CRT) is associated
96 with a wide range of social phenomena, such as religious disbelief49-51, paranormal disbelief52-
54
97 , rejection of conspiracist claims55, increased acceptance of science56,57, and rejection of
98 pseudo-profound bullshit58. More reflective individuals are also less likely to offload their
99 thinking to the internet via search engines59. Particularly relevant to social media, recent work
2100 finds that people who perform better on the CRT are less likely to believe blatantly false “fake
101 news” stories60,61 and they self-report a lower likelihood of sharing such content on social
102 media61, as well as reporting less trust in unreliable fake news or hyper-partisan news sources62.
103 Taken together, this body of previous evidence supporting the reflectionist account suggests
104 that people who perform better on the CRT may differ systematically in their social media
105 behavior from people who perform worse – and in particular, that higher CRT performers may
106 be more discerning (i.e., less likely to follow and share epistemically questionable or facile
107 content).
108 Crucially, however, the full body of this research is based on self-reported beliefs and
109 behaviors in survey studies. This is a substantial limitation because the debate between the
110 intuitionist and reflectionist perspectives comes down to the outcomes or consequences of the
111 capacity and disposition to engage in reflective reasoning in the context of daily life. The
112 intuitionist perspective dictates that analytic thinking is not particularly important or effective
113 outside of artificial laboratory settings, and therefore that differences in analytic thinking
114 should not have a meaningful impact on everyday beliefs and behaviors. The reflectionist
115 perspective, conversely, dictates that analytic thinking is crucial for dictating everyday
116 behaviors outside the lab. Here, we investigate the relationship between analytic thinking and
117 naturally occurring behavior on social media, with the goal of distinguishing between these
118 broad accounts of information processing.
119 To do so, we use a hybrid lab-field set-up to investigate such differences by linking
120 survey data to actual behavior on Twitter. We recruited a panel of participants (N = 1,953; 55%
121 female, Mage = 32, 61% UK residents, 37% US residents), who completed the CRT and
122 provided their Twitter username. We then used the Twitter API to pull public information from
123 the users’ profiles on Twitter, allowing us to investigate the relationship between a user’s CRT
124 score and three main dimensions of their “digital fingerprint”: basic characteristics of their
125 profile, the accounts they follow, and the contents of their tweets.
126 In the main text, we report zero-order relationships between measures of interest and z-
127 scored CRT score. Except when otherwise noted, all results continue to hold when including
128 age, gender, ethnicity, US residency, education level (categorical), income, and political
129 ideology as controls; and when accounting for multiple comparisons using either the
130 Bonferroni-Holm correction63 or maintaining a 5% false discovery rate using the Benjamini
131 Hochberg procedure64 (see SI for models with controls and corrected p-values).
132
133 Results
134 Profile characteristics
135 We begin by examining the relationship between CRT and basic profile features:
136 number of accounts followed, number of followers, total number of tweets, number of tweets
137 in the past two weeks, number of favorited tweets, lists, and number of days on Twitter (N =
138 1,900, all users that provided Twitter screen name and completed CRT). As each of these
139 quantities is a count variable, we use negative binomial regression to predict each quantity,
140 taking CRT as the independent variable. We find that higher CRT subjects follow significantly
141 fewer other accounts (IRR =.844, p0.10 for all; see SI
147 Section 1 for full regression tables).
148
149 Accounts followed
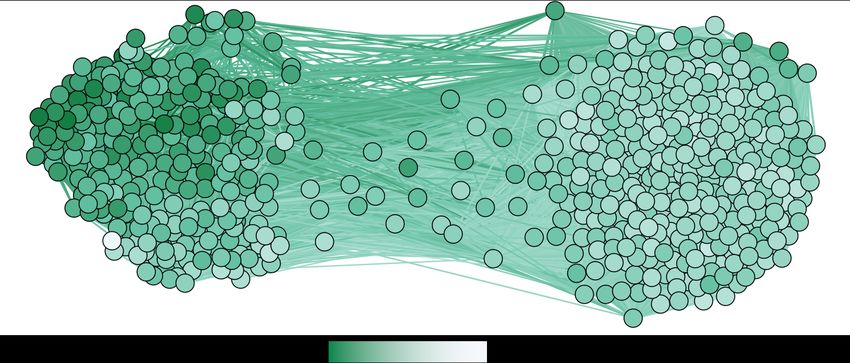
3150 Following up on the observation that higher CRT participants followed significantly 151 fewer accounts, we next examine which accounts are followed by lower versus higher CRT 152 participants – that is, we examine how CRT relates to which types of content users consume 153 on Twitter (according to Grinberg et al. 2019, the accounts one follows form a good proxy for 154 the content one is exposed to). 155 156 157 Figure 1 Co-follower network. Nodes represent Twitter accounts followed by at least 30 users in our dataset and edges are 158 weighted based on the number of followers in common. The intensity of color of each node shows the average CRT score of 159 its followers (darker = higher CRT). Nodes are positions using directed-force layout on the weighted network. Visualization 160 depicts two distinct communities: one where the accounts are followed mostly by low CRT users and one with higher (mixed 161 level) of CRT users. 162 We begin by assessing structural differences between the accounts followed by the 163 users given their CRT. To do so, we construct the co-follower network: each node in the 164 network represents a Twitter account that is followed by at least 30 participants in our dataset 165 (1,129 nodes; results are robust to using thresholds other than 30, see SI Section 2), and the 166 edge between two given nodes is weighted by the number of participants in our dataset that 167 follow both nodes (Figure 1). Community detection analysis65 on the co-follower network 168 reveals two distinct clusters of accounts (Figure 1). Table 1 shows the top accounts in each 169 cluster. The clusters differ substantially in the cognitive style of their followers, with the 170 average CRT score of followers of the accounts in one cluster being 2.0 standard deviations 171 larger than the other cluster (Cohen’s d = 2.0; cluster 1: mean CRT = 0.428, SD = 0.030, 172 fraction of nodes = 0.60; cluster 2: mean CRT = 0.529, SD = 0.069, fraction of nodes = 0.40). 173 Furthermore, the average CRT of the followers of a given account is a highly significant 174 predictor of which community that account belongs to, with a one standard deviation increase 175 in followers’ average CRT score being associated with a more than 16-fold increase in the odds 176 of an account being in the higher CRT cluster (logistic regression, OR = 16.790, p
184   Table 1. Top accounts in each cluster within the co-follower networks. For each cluster, the table shows representative
185   accounts with a large number of followers along with the mean and standard deviation of CRT score of their followers

                               Cluster 1                                                    Cluster 2

                                            Followers’ mean                                              Followers’ mean
           Account          Followers                                  Account         Followers
                                              CRT score                                                    CRT score

         barackobama            316                0.542                 aldiuk            108                 0.474
          stephenfry            243                0.574               sainsburys          96                  0.457
         bbcbreaking            226                0.541               poundland           93                  0.456
        realdonaldtrump         193                0.525              argos_online         90                  0.462
          jk_rowling            151                0.541               Bmstores            89                  0.449
        Theellenshow            144                0.536              Lovewilko            88                  0.433
          Amazonuk              138                0.572               Morrisons           87                  0.473
         Rickygervais           138                 0.52              Nextofficial         87                  0.435
             Nasa               135                0.643               Superdrug           85                  0.395
            Twitter             133                0.509                 Asda              82                  0.400
186
187   Contents of tweets
188           Finally, we shift from the accounts users follow (and thus the content they consume) to
189   the content users create and/or distribute themselves: their tweets (1,537 subjects had accessible
190   public tweets on their timeline, generating a total of 2,402,082 tweets).
191           First, we investigate the quality of the information shared by users. To do so, we focus
192   on tweets or retweets containing links to one of 60 news websites whose trustworthiness was
193   rated by professional fact-checkers in previous work62; these news sites span a wide range of
194   information quality, from entirely fabricated “fake news” sites to hyper-partisan sites that
195   present misleading coverage of events that did actually occur to reputable mainstream news
196   sources. For our analysis, we extracted and unshortened all URLs in all tweets, and collected
197   any tweets containing links to one of the 60 sites (733 users tweeted at least one link from one
198   of these sites, with 11,342 tweets in total).
199           We then perform a linear regression predicting the trustworthiness of the tweeted news
200   source (in [0-1]) based on the CRT score of the user who shared the link, with robust standard
201   errors clustered on user. Doing so finds a positive correlation between CRT score and
202   trustworthiness of shared news sources (b = 0.106, p =0.011; Figure 2). For example, higher
203   CRT users were more likely to retweet links to the BBC (OR = 1.229, p
209 analysis becomes non-significant when controlling for political ideology and/or education.]
210 See SI Section 3 for statistical details.
211
212
1 NYTimes
WashPo
0.9 BBC
CNN
0.8
Fact-checker trust score
MSNBC
WSJ
ABCNews LATimes
0.7
0.6 CBSNews
USAToday
0.5
FoxNews
0.4 DailyMail HuffPo Yahoo
0.3
NYDailyNews DailyKos
0.2 Breitbart
0.1 RawStory
0
0.35 0.4 0.45 0.5 0.55 0.6
Tweeters' average CRT score
213
214 Figure 2. Trustworthiness of shared news sources vs average CRT of score of users. Each dot represents an outlet shared
215 by users in our sample on Twitter. The size of the dots represents the number of observations. For clarity, we show outlets
216 which have been shared at least 50 times by the users.
217
CRT and Topics on Tweets
218 Next, we examine the topics people tweeted about using Structural Topic Modeling66, a
219 general framework for topic modeling with document-level covariate information. For each
220 user, we merged all tweets from the timeline as a document and
peopl, trump, amp, used
will, say, thecan, user
Topic 1:
just, like, CRTone,score
realdonaldtrump, vote, now, as the
221 covariate for the topic1 modeling. Running the model for different number of topics (k = 5-10),
make, get, think, right, want, need, know, year
222 we found that two particular topics are consistently correlated with high Topic 2:versus low CRT users:
win, follow, amp, enter, competit, chanc, giveaway, end, retweet,
223 A topic involving
2 politics (e.g., “people”, “vote”, “trump”, “brexit”) time was positively correlated
freebiefriday, winner, just, give, simpli, prize, tampc, voucher, away, day,
224 with CRT and a topic involving “get rich quick” schemes (e.g., “win”, “enter”, “chance”
Topic 3:
225 “giveaway”, “prize”)
3 was negatively correlated with win, CRT. Figure
giveaway, just, 3 shows
enter, earn, free, thesponsor,
chanc, check, gift,
amp, get, prize, want, cash, mile, love, point
difference
card, via, in
226 topic prevalence for each topic against the users’ CRT score for a 7-topic model (our results
227 are robust to the
4 choice of the number of topics; see via,
SIyoutub,
Section 4). Topic 4:
new, thank, video, amp, like, game, can, music, get, make, art,
228 use, will, check, today, write, post, follow
229 CRT and Topics on Tweets
5 Topic 5:
just, like, get, one, dont, love, know, can, time, now, think, day, peopl,
want, make, good, got, realli, look, thing
Topic1. peopl, will, amp, trump, say, can, just,
6 vote, like, now, one,Topic get,1:
peopl, trump, amp, will, say, just, Topic 6:need,
like, can,
right, make, think,
realdonaldtrump, one, vote, now,
time,
day, thank,brexit,
love,
make, want,
get,get, know
just,think,
today, amp,
right, now,need,
want, look,know,
will, one,
yearnew, can, time,
1 good, pleas, see, week, great, work
7 Topic 2:
Topic2.
win, follow,follow,
amp, enter, amp, enter,
competit,
Topic chanc,
7:
competit,
giveaway, end, chanc,
retweet,
2
giveaway,
freebiefriday,
game, new, amp, end,
winner,
play, get,retweet,
just, give, simpli,
will, win, winner,
prize,
team, give,
just,tampc, simpli,
voucher,
watch, away,
fan, good, one,day,
now,
time
season, can, like, time, look, last
freebiefriday, prize, like, just, day, tampc, good,
away
Topic 3:
-0.2 -0.13 0.0 0.1 0.2 0.3
win, giveaway, just, enter, earn, free, chanc, check, gift, sponsor, card, via,
amp, get, prize, want, cash, mile, love, point
Topic prevalence by CRT score
CRT_ACC
230
231 Figure 3 Difference
4 in topic proportion against CRT score of users.via,Topic 1 related to politicalTopic 4:
engagement is positively
youtub, new, thank, video, amp, like, game, can, music, get, make, art,
232 correlated with CRT score and topic 2 involving “get rich quick” schemes is negatively correlated
use, will, check, withfollow
today, write, post, CRT score.
233 5 Topic 5:
just, like, get, one, dont, love, know, can, time, now, think, day, peopl,
234 Finally, we examined the language used in the tweets at the level of individual words. want, make, good, got, realli, look, thing
235 This final analysis
6
aims mostly to validate the standard interpretation of6: the CRT as capturing
Topic
day, thank, love, get, just, today, amp, now, look, will, one, new, can, time,
good, pleas, see, week, great, work
7
Topic 7:
game, new, amp, play, get, will, win, team, just, watch, fan, good, one, now,
6 season, can, like, time, look, last
-0.2 -0.1 0.0 0.1 0.2 0.3
CRT_ACC236 the tendency to use an analytic cognitive style29. To do so, we employed the Linguistic Inquiry
237 Word Count (LIWC; a psychologically validated set of word dictionaries67) approach to test
238 how CRT scores related to the probability of a user’s tweets containing words related to various
239 LIWC categories. Specifically, if people who do well on the CRT are more likely to engage in
240 thinking (insight) to override (inhibit) their intuitive (often emotional) responses, then we
241 would expect positive correlations between CRT and the use of insight and inhibition words,
242 and negative correlations between CRT and the use of positive and negative emotion words.
243 Secondarily, we investigated the relationship between CRT and several other word categories.
244 We explored the relationship between CRT and the use of words related to morality, as previous
245 work has shown that CRT is associated with different moral values68,69, judgments70, and
246 behaviors71-73, but has not examined the relationship between CRT and engagement with
247 morality more generally. We also looked at the relationship between CRT and use of words
248 related to politics as prior work has found a link between CRT and political engagement74,
249 using the dictionary of words suggested by75. [We also planned to investigate the link between
250 CRT and religious words, based on prior work linking CRT to reduced belief in God76, but
251 found that use of religious words was not associated with belief in God; therefore we would
252 not expect a relationship with CRT.]
253
Insight Inhibition Positive Emotion
0.16 p266 CRT correlation, Table 2 shows the five words with the largest difference in frequency between 267 low and high CRT subjects (using median split). 268 We analyzed 1,787,197 tweets/retweets written in English language from 1,560 users 269 in our dataset whose timeline was accessible and had tweeted in English. As predicted based 270 on the conceptualization of CRT as measuring deliberativeness, we find that users with higher 271 CRT scores are more likely to use words associated with insight (OR = 1.135, p
308           One line of prior work which the current results bear on has to do with media truth
309   discernment. Past work has shown that people who are more analytic and reflective are better
310   at identifying true versus false news headlines, regardless of whether the headlines align with
311   their ideology (e.g., ref 60,61). However, these studies have relied entirely on survey
312   experiments, where participant responses may be driven by experimenter demand effects or
313   expressive responding. Additionally, in these experiments, participants judge a comparatively
314   small set of headlines (pre-selected by the experimenters to be balanced on partisanship and
315   veracity). Thus, these prior results may be idiosyncratic to the specific headlines (or approach
316   for selecting headlines) used in designing the survey. Furthermore, these studies have focused
317   on contrasting true headlines with blatantly false headlines (which may be comparatively rare
318   outside the laboratory25,26, rather than articles which are misleading but not entirely false (e.g.,
319   hyper-partisan biased reporting of events that actually occurred62). Thus, the results may not
320   generalize to the kinds of misinformation more typically encountered online. Finally, these
321   studies have focused on judgments of accuracy, rather than sharing decisions. Thus, whether
322   these previously documented associations extended to actual sharing in the naturally occurring
323   social media environment is an open question – particularly given that the social media context
324   may be more likely to active a political identity (as opposed to accuracy or truth) focus78,79.
325   Yet, despite these numerous reasons to think that prior findings may not generalize outside the
326   survey context, we do indeed find that participants who perform better on the CRT share news
327   from higher quality news sources. This observation substantially extends prior support for a
328   positive role of reasoning in news media truth discernment.
329           Our results are also relevant in similar ways for prior work regarding the role of
330   cognitive sophistication in political engagement. Prior evidence using survey experiments
331   suggests that people who are more cognitively sophisticated (e.g., higher CRT, more educated,
332   higher political knowledge) show higher rates of engagement with politics74,80. However, it has
333   also been suggested that this relationship may be the result of social desirability bias, such that
334   more cognitively sophisticated people simply over-report political engagement to please the
335   experimenter81,82. Our results, however, suggest that more reflective people are indeed actually
336   more engaged with politics on social media. This supports the inference that analytic thinking
337   is associated with increased political engagement.
338           More broadly, cognitive reflection has been associated with lower gullibility – that is,
339   less acceptance of a large range of epistemically suspect beliefs (such as conspiracy theories,
340   paranormal claims, etc. – see 29 for a review), including decreased susceptibility to pseudo-
341   profound bullshit58. Again, however, these findings are rooted in survey evidence and not real-
342   world behavior, and could reflect socially desirable responding. Here we find that low CRT is
343   associated with increased following of and tweeting about money-making scams and get-rich-
344   quick schemes. This supports the conclusion that more intuitive people are indeed more
345   gullible.
346           One of the most intriguing results that we uncovered was the clustering of accounts
347   followed by lower versus higher CRT participants. In particular, there was a cluster of accounts
348   that were predominantly followed by low CRT participants. This observation is particularly
349   interesting in the context of the extremely extensive discussion of partisan echo chambers, in
350   which supporters of the same party are much more likely to interact with co-partisans11,12,16.
351   Our network analysis indicates that the phenomenon of echo chambers is not limited to politics:
352   the cognitive echo chambers we observe have potentially profound implications for how
353   information flows through social media. Furthermore, it is likely that cognitive echo chambers
354   are not confined to social media – future work should investigate this phenomenon more
355   broadly.

                                                       9
356 There are, of course, important limitations of the present work. Most notably, we were
357 only able to consider the Twitter activity of a tiny subset of all users on the platform. Thus, it
358 is important for future work to examine how our results generalize to other sets of users – and
359 in particular, to users who did not opt in to a survey experiment. One potential approach that
360 may be fruitful in this endeavor is training a machine learning model to estimate users’ CRT
361 scores based on their social media activity. Relatedly, it will be important to test how the results
362 generalize to other social media platforms (e.g. Facebook, LinkedIn), and to users from non-
363 Western cultures. Future work should also examine how the results obtained here generalize to
364 other measures of cognitive sophistication beyond the CRT.
365 In sum, here we have shed light on social media behavior using the lens of cognitive
366 science. We have provided evidence that one’s extent of analytic thinking predicts a wide range
367 of social media behaviors. These results meaningfully extend prior survey studies,
368 demonstrating that analytic thinking plays an important role outside the laboratory.
369
370 Methods
371 Participants provided informed consent, and our studies were approved by the Yale
372 Human Subjects Committee1, IRB Protocol # 2000022539.
373 Participants. We recruited participants via Prolific83, a subject pool for online
374 experiments that consists of mostly UK- and US-based individuals. Participants completed the
375 survey on June 15-20, 2018. Twitter IDs were provided by participants at the beginning of the
376 study. However, some participants entered obviously fake Twitter IDs – for example, the
377 accounts of celebrities. To screen out such accounts, we excluded accounts with follower
378 counts above the 95th percentile in our dataset. We had complete data and usable Twitter IDs
379 for 1,953 users (55% female, Mage = 32, 61% UK residents, 37% US residents).
380 Survey materials and procedure. Participants first completed a news discernment
381 task. For this, they were given the following instructions: “You will be presented with a series
382 of news headlines from 2016-2017 (20 in total). We are interested in whether you think the
383 headlines are accurate or not. That is, do you think that they are accurately describing
384 something that actually happened. Note: The images may take a moment to load.” They were
385 then presented with a set of 20 politically neutral headlines in a random order and, for each
386 headline, they were asked the following question61,74: “To the best of your knowledge, how
387 accurate is the claim in the above headline?” (response options: Not at all accurate, Not very
388 accurate, Somewhat accurate, Very accurate). The headlines were either false (“fake”) or true
389 (“real”). The false headlines were verified as untrue by Snopes.com, whereas the true headlines
390 were all obtained from reputable mainstream news outlets. The mainstream headlines were
391 selected to be relatively surprising. The full set of headlines can be found here:
392 https://osf.io/guk3m/.
393 Participants then completed a demographics questionnaire that included education,
394 English fluency, social and economic political ideology (as separate questions), ethnicity,
395 belief in God, religious affiliation, class, and income. Next, participants were given the 7-item
396 CRT61, which consists of a reworded version of the original 3-item CRT34 and a 4-item non-
397 numeric CRT33. Finally, participants were asked if they responded randomly, searched online
398 for the headlines, and/or skipped through the headlines at the start of the study.
399 Twitter Data. We then used the Twitter API to retrieve users’ public information,
400 including general profile information (total number of tweets, accounts followed, followers,
401 etc.), the content of their last 3,200 tweets (capped by the Twitter API limit), and the list of
1
Data was collected when the researchers were with Yale University.
10402 accounts followed by each user in our dataset. We linked the survey responses with Twitter
403 data for our subsequent analysis.
404 For word-level analysis, we removed punctuation and lower-case words then cross-
405 referenced all words in each tweet with the patterns in each word dictionary. We then flagged
406 the tweet against all categories that had at least one pattern matched.
407 To create the co-follower network, we first constructed a bipartite graph representing
408 all users in our study and all accounts they followed on Twitter. We then created the associated
409 weighted mono-partite graph of the accounts that have at least K followers from our subject
410 pool. Each account is represented by the aggregated demographic characteristics of its
411 followers (e.g., fraction female, fraction US resident, fraction white, average age).
412
413
414 Acknowledgments
415 The authors gratefully acknowledge funding from the Templeton World Charity Foundation
416 (grant number TWCF 0350), the Ethics and Governance of Artificial Intelligence Initiative of
417 the Miami Foundation, the Social Sciences and Humanities Research Council of Canada. The
418 authors are very appreciative of helpful comments from Dean Eckles, Ziv Epstein, Adam Bear,
419 and Cameron Martel.
11420 References
421 1 Coyle, C. L. & Vaughn, H. Social networking: Communication revolution or evolution?
422 Bell Labs Technical Journal 13, 13-17 (2008).
423 2 Wellman, B. Computer networks as social networks. Science 293, 2031-2034 (2001).
424 3 Boyd, D. M. & Ellison, N. B. Social network sites: Definition, history, and scholarship.
425 Journal of computer-mediated Communication 13, 210-230 (2007).
426 4 Vaidya, M. (Nature Publishing Group, 2014).
427 5 Chandler, R. GoFundMe sees boom in medically-related fundraising campaigns. WHO
428 TV March 14 (2015).
429 6 Sa, B. P., Chen, W. & Kodama, T. (Google Patents, 2017).
430 7 Del Vicario, M. et al. The spreading of misinformation online. Proceedings of the
431 National Academy of Sciences 113, 554-559 (2016).
432 8 Lazer, D. M. et al. The science of fake news. Science 359, 1094-1096 (2018).
433 9 Vosoughi, S., Roy, D. & Aral, S. The spread of true and false news online. Science 359,
434 1146-1151 (2018).
435 10 Pennycook, G. et al. (PsyArXiv, 2019).
436 11 Barberá, P., Jost, J. T., Nagler, J., Tucker, J. A. & Bonneau, R. Tweeting from left to
437 right: Is online political communication more than an echo chamber? Psychological
438 science 26, 1531-1542 (2015).
439 12 Garimella, V. R. K. & Weber, I. in Eleventh International AAAI Conference on Web
440 and Social Media.
441 13 Brady, W. J. & Crockett, M. How effective is online outrage. Trends in cognitive
442 sciences 23, 79 (2019).
443 14 Woolley, S. C. Automating power: Social bot interference in global politics. First
444 Monday 21 (2016).
445 15 Badawy, A., Ferrara, E. & Lerman, K. in 2018 IEEE/ACM International Conference
446 on Advances in Social Networks Analysis and Mining (ASONAM). 258-265 (IEEE).
447 16 Stewart, A. J. et al. Information gerrymandering and undemocratic decisions. Nature
448 573, 117-121, doi:10.1038/s41586-019-1507-6 (2019).
449 17 Aral, S. & Eckles, D. Protecting elections from social media manipulation. Science 365,
450 858-861 (2019).
451 18 Crockett, M. J. Moral outrage in the digital age. Nature Human Behaviour 1, 769-771,
452 doi:10.1038/s41562-017-0213-3 (2017).
453 19 Matz, S. C., Kosinski, M., Nave, G. & Stillwell, D. J. Psychological targeting as an
454 effective approach to digital mass persuasion. Proceedings of the national academy of
455 sciences 114, 12714-12719 (2017).
456 20 Correa, T., Hinsley, A. W. & De Zuniga, H. G. Who interacts on the Web?: The
457 intersection of users’ personality and social media use. Computers in human behavior
458 26, 247-253 (2010).
459 21 Back, M. D. et al. Facebook profiles reflect actual personality, not self-idealization.
460 Psychological science 21, 372-374 (2010).
461 22 Golbeck, J., Robles, C. & Turner, K. in CHI'11 extended abstracts on human factors in
462 computing systems. 253-262 (ACM).
463 23 Preotiuc-Pietro, D., Carpenter, J., Giorgi, S. & Ungar, L. in Proceedings of the 25th
464 ACM international on conference on information and knowledge management. 761-
465 770 (ACM).
466 24 Sumner, C., Byers, A., Boochever, R. & Park, G. J. in 2012 11th International
467 Conference on Machine Learning and Applications. 386-393 (IEEE).
12468 25 Guess, A., Nagler, J. & Tucker, J. Less than you think: Prevalence and predictors of
469 fake news dissemination on Facebook. Science advances 5, eaau4586 (2019).
470 26 Grinberg, N., Joseph, K., Friedland, L., Swire-Thompson, B. & Lazer, D. Fake news
471 on twitter during the 2016 US Presidential election. Science 363, 374-378 (2019).
472 27 Muscanell, N. L. & Guadagno, R. E. Make new friends or keep the old: Gender and
473 personality differences in social networking use. Computers in Human Behavior 28,
474 107-112 (2012).
475 28 Evans, J. S. B. & Stanovich, K. E. Dual-process theories of higher cognition advancing
476 the debate. Perspectives on Psychological Science 8, 223-241 (2013).
477 29 Pennycook, G., Fugelsang, J. A. & Koehler, D. J. Everyday consequences of analytic
478 thinking. Current Directions in Psychological Science 24, 425-432 (2015).
479 30 Evans, A. M., Dillon, K. D. & Rand, D. G. Fast but not intuitive, slow but not reflective:
480 Decision conflict drives reaction times in social dilemmas. Journal of Experimental
481 Psychology: General 144, 951-966 (2015).
482 31 Kahneman, D. Thinking, Fast and Slow. (Farrar, Straus and Giroux, 2011).
483 32 Stanovich, K. E. & West, R. F. Advancing the rationality debate. Behavioral and brain
484 sciences 23, 701-717 (2000).
485 33 Thomson, K. S. & Oppenheimer, D. M. Investigating an alternate form of the cognitive
486 reflection test. Judgment and Decision making 11, 99 (2016).
487 34 Frederick, S. Cognitive Reflection and Decision Making. The Journal of Economic
488 Perspectives 19, 25-42 (2005).
489 35 Pennycook, G., Cheyne, J. A., Koehler, D. J. & Fugelsang, J. A. Is the cognitive
490 reflection test a measure of both reflection and intuition? Behavior Research Methods
491 48, 341-348 (2016).
492 36 Mata, A., Ferreira, M. B. & Sherman, S. J. The metacognitive advantage of deliberative
493 thinkers: A dual-process perspective on overconfidence. Journal of personality and
494 social psychology 105, 353 (2013).
495 37 Toplak, M. E., West, R. F. & Stanovich, K. E. The Cognitive Reflection Test as a
496 predictor of performance on heuristics-and-biases tasks. Memory & cognition 39, 1275
497 (2011).
498 38 Juanchich, M., Dewberry, C., Sirota, M. & Narendran, S. Cognitive reflection predicts
499 real-life decision outcomes, but not over and above personality and decision-making
500 styles. Journal of Behavioral Decision Making 29, 52-59 (2016).
501 39 Yılmaz, O. & Sarıbay, S. A. An attempt to clarify the link between cognitive style and
502 political ideology: A non-western replication and extension. (2016).
503 40 Kruglanski, A. W. & Gigerenzer, G. Intuitive and deliberate judgments are based on
504 common principles. Psychological review 118, 97 (2011).
505 41 Keren, G. A tale of two systems: A scientific advance or a theoretical stone soup?
506 Commentary on Evans & Stanovich (2013). Perspectives on Psychological Science 8,
507 257-262 (2013).
508 42 Haidt, J. in Psychological Review Vol. 108 814-834 (American Psychological
509 Association, 2001).
510 43 Haidt, J. The Righteous Mind: Why Good People Are Divided by Politics and Religion.
511 (Pantheon Books, 2012).
512 44 Mercier, H. The argumentative theory: Predictions and empirical evidence. Trends in
513 Cognitive Sciences 20, 689-700 (2016).
514 45 Mercier, H. & Sperber, D. Why do humans reason? Arguments for an argumentative
515 theory. (2011).
516 46 Kahan, D. Making climate-science communication evidence-based. Culture, politics
517 and climate change: How information shapes our common future, 203-220 (2013).
13518 47 Kahan, D. M. et al. The polarizing impact of science literacy and numeracy on
519 perceived climate change risks. Nature climate change 2, 732 (2012).
520 48 Pennycook, G. The new reflectionism in cognitive psychology: Why reason matters.
521 (Routledge, 2018).
522 49 Shenhav, A., Rand, D. G. & Greene, J. D. Divine intuition: Cognitive style influences
523 belief in God. Journal of Experimental Psychology: General 141, 423 (2012).
524 50 Pennycook, G., Cheyne, J. A., Seli, P., Koehler, D. J. & Fugelsang, J. A. Analytic
525 cognitive style predicts religious and paranormal belief. Cognition 123, 335-346,
526 doi:10.1016/j.cognition.2012.03.003 (2012).
527 51 Gervais, W. M. & Norenzayan, A. Analytic Thinking Promotes Religious Disbelief.
528 Science 336, 493-496, doi:10.1126/science.1215647 (2012).
529 52 Svedholm, A. M. & Lindeman, M. The separate roles of the reflective mind and
530 involuntary inhibitory control in gatekeeping paranormal beliefs and the underlying
531 intuitive confusions. British Journal of Psychology 104, 303-319 (2013).
532 53 Bouvet, R. & Bonnefon, J.-F. Non-reflective thinkers are predisposed to attribute
533 supernatural causation to uncanny experiences. Personality and Social Psychology
534 Bulletin 41, 955-961 (2015).
535 54 Cheyne, J. A. & Pennycook, G. Sleep paralysis postepisode distress: Modeling potential
536 effects of episode characteristics, general psychological distress, beliefs, and cognitive
537 style. Clinical Psychological Science 1, 135-148 (2013).
538 55 Swami, V., Voracek, M., Stieger, S., Tran, U. S. & Furnham, A. Analytic thinking
539 reduces belief in conspiracy theories. Cognition 133, 572-585 (2014).
540 56 Gervais, W. M. Override the controversy: Analytic thinking predicts endorsement of
541 evolution. Cognition 142, 312-321 (2015).
542 57 Pennycook, G., Cheyne, J. A., Koehler, D. & Fugelsang, J. A. On the belief that beliefs
543 should change according to evidence: Implications for conspiratorial, moral,
544 paranormal, political, religious, and science beliefs. (2019).
545 58 Pennycook, G., Cheyne, J. A., Barr, N., Koehler, D. J. & Fugelsang, J. A. On the
546 reception and detection of pseudo-profound bullshit. Judgment and Decision making
547 (2015).
548 59 Barr, N., Pennycook, G., Stolz, J. A. & Fugelsang, J. A. The brain in your pocket:
549 Evidence that Smartphones are used to supplant thinking. Computers in Human
550 Behavior 48, 473-480 (2015).
551 60 Bago, B., Rand, D. G. & Pennycook, G. Fake news, fast and slow: Deliberation reduces
552 belief in false (but not true) news headlines. Journal of experimental psychology:
553 general (2020).
554 61 Pennycook, G. & Rand, D. G. Lazy, not biased: Susceptibility to partisan fake news is
555 better explained by lack of reasoning than by motivated reasoning. Cognition 188, 39-
556 50 (2019).
557 62 Pennycook, G. & Rand, D. G. Fighting misinformation on social media using
558 crowdsourced judgments of news source quality. Proceedings of the National Academy
559 of Sciences 116, 2521-2526 (2019).
560 63 Holm, S. A simple sequentially rejective multiple test procedure. Scandinavian journal
561 of statistics, 65-70 (1979).
562 64 Benjamini, Y. & Hochberg, Y. Controlling the False Discovery Rate: A Practical and
563 Powerful Approach to Multiple Testing. Journal of the Royal Statistical Society. Series
564 B (Methodological) 57, 289-300 (1995).
565 65 Blondel, V. D., Guillaume, J.-L., Lambiotte, R. & Lefebvre, E. Fast unfolding of
566 communities in large networks. Journal of statistical mechanics: theory and experiment
567 2008, P10008 (2008).
14568 66 Roberts, M. E. et al. Structural topic models for open-ended survey responses.
569 American Journal of Political Science 58, 1064-1082 (2014).
570 67 Pennebaker, J. W., Boyd, R. L., Jordan, K. & Blackburn, K. The development and
571 psychometric properties of LIWC2015. (2015).
572 68 Royzman, E. B., Landy, J. F. & Goodwin, G. P. Are good reasoners more incest-
573 friendly? Trait cognitive reflection predicts selective moralization in a sample of
574 American adults. Judgment and Decision Making 9, 176-190 (2014).
575 69 Pennycook, G., Cheyne, J. A., Barr, N., Koehler, D. J. & Fugelsang, J. A. The role of
576 analytic thinking in moral judgements and values. Thinking & Reasoning 20, 188-214
577 (2014).
578 70 Greene, J. D., Sommerville, R. B., Nystrom, L. E., Darley, J. M. & Cohen, J. D. An
579 fMRI Investigation of Emotional Engagement in Moral Judgment. Science 293, 2105-
580 2108 (2001).
581 71 Rand, D. G. Cooperation, fast and slow: Meta-analytic evidence for a theory of social
582 heuristics and self-interested deliberation. Psychological Science, Pre-print available at
583 SSRN: http://ssrn.com/abstract=2783800 (2016).
584 72 Köbis, N. C., Verschuere, B., Bereby-Meyer, Y., Rand, D. & Shalvi, S. Intuitive
585 Honesty Versus Dishonesty: Meta-Analytic Evidence. Perspectives on Psychological
586 Science, 1745691619851778 (2019).
587 73 Rand, D. G., Brescoll, V. L., Everett, J. A. C., Capraro, V. & Barcelo, H. Social
588 heuristics and social roles: Intuition favors altruism for women but not for men. Journal
589 of Experimental Psychology: General 145, 389-396 (2016).
590 74 Pennycook, G. & Rand, D. G. Cognitive reflection and the 2016 US Presidential
591 election. Personality and Social Psychology Bulletin 45, 224-239 (2019).
592 75 Preoţiuc-Pietro, D., Liu, Y., Hopkins, D. & Ungar, L. in Proceedings of the 55th Annual
593 Meeting of the Association for Computational Linguistics (Volume 1: Long Papers).
594 729-740.
595 76 Shenhav, A., Rand, D. G. & Greene, J. D. Divine intuition: Cognitive style influences
596 belief in God. Journal of Experimental Psychology: General, doi:10.1037/a0025391
597 (2011).
598 77 Rand, D. G. et al. Social heuristics shape intuitive cooperation. Nat Commun 5,
599 doi:10.1038/ncomms4677 (2014).
600 78 Brady, W. J., Crockett, M. & Van Bavel, J. J. The MAD Model of Moral Contagion:
601 The role of motivation, attention and design in the spread of moralized content online.
602 (2019).
603 79 Van Bavel, J. J. & Pereira, A. The partisan brain: An Identity-based model of political
604 belief. Trends in cognitive sciences 22, 213-224 (2018).
605 80 Galston, W. A. Political knowledge, political engagement, and civic education. Annual
606 review of political science 4, 217-234 (2001).
607 81 Holbrook, A. L., Green, M. C. & Krosnick, J. A. Telephone versus face-to-face
608 interviewing of national probability samples with long questionnaires: Comparisons of
609 respondent satisficing and social desirability response bias. Public opinion quarterly
610 67, 79-125 (2003).
611 82 Enamorado, T. & Imai, K. Validating Self-reported Turnout by Linking Public Opinion
612 Surveys with Administrative Records. (2018).
613 83 Palan, S. & Schitter, C. Prolific. ac—A subject pool for online experiments. Journal of
614 Behavioral and Experimental Finance 17, 22-27 (2018).
615
15Digital Fingerprints of Cognitive Reflection
(Supplementary Material)
Authors: Mohsen Mosleh1, Gordon Pennycook2, Antonio A. Arechar1, and David G. Rand1,3
1
Sloan School of Management, Massachusetts Institute of Technology, 2Hill/Levene Schools of Business,
University of Regina, 3Department of Brain and Cognitive Sciences, Massachusetts Institute of Technology
1. Profile characteristics
Table S1 Predicting profile characteristics taking users’ z-scored CRT score as independent variable using negative
binominal regression. Model 1) no controls, Model 2) controlling for age, gender, and ethnicity, Model 3) controlling for age,
gender, ethnicity, US residency, education, social/economic conservatism. pBH is corrected p-value using Bonferroni-Holms
and pHolm using Benjamini Hochberg procedure.
Model 1 Model 2 Model 3
IRR Coeff. IRR
Feature p pBH pHolm p pBH pHolm p pBH pHolm
(SE) (SE) (SE)
0.844 0.878 0.886
Followed 0.000 0.000 0.000 0.002 0.013 0.013 0.004 0.027 0.027
(0.035) (0.036) (0.037)
0.956 0.984 0.952
Followers 0.375 0.454 1.000 0.745 0.852 1.000 0.296 0.519 1.000
(0.049) (0.048) (0.045)
0.799 0.915 0.945
Tweets 0.029 0.073 0.172 0.297 0.416 0.892 0.508 0.630 1.000
(0.082) (0.078) (0.081)
1.067 1.100 1.032
Favorites 0.084 0.411 0.454 0.217 0.380 0.869 0.686 0.686 1.000
(0.084) (0.085) (0.079)
0.902 1.017 0.953
Listed 0.352 0.454 1.000 0.852 0.852 1.000 0.540 0.630 1.000
(0.100) (0.092) (0.076)
Tweets in
0.811 0.894 0.896
last 2 0.031 0.073 0.172 0.167 0.380 0.835 0.235 0.519 1.00
(0.079) (0.072) (0.083)
weeks
Days on 1.008 1.018 1.017
0.454 0.454 1.000 0.103 0.359 0.615 0.139 0.485 0.831
Twitter (0.011) (0.011) (0.011)
12. Accounts followed
.
Table S2. Characteristics of clusters within co-followers’ network for various threshold of number of followers (K).
Regression results are generated by predicting which cluster the accounts belong to taking z-scored average CRT of followers
as independent variable using logistic regression. Model 1) no controls, Model 2) controlling for age (average age of
followers), gender (male fraction of followers), and ethnicity (white fraction of followers), Model 3) controlling for age,
gender, ethnicity, US residency (US resident fraction of followers), education (college degree fraction of followers),
social/economic conservatism (average conservatism of followers), and income (average income of followers). Across all
values of the threshold for the number of followers, there exist one cluster with high average CRT score of followers and one
with low average CRT score of followers. The average CRT of followers can significantly predict which cluster of the two
clusters the accounts belongs to
Threshold Cluster CRT Fraction of Total Model 1 Model 2 Model 3
(K) nodes in nodes OR OR OR
Mean SD
the cluster (SE) (SE) (SE)
0.056 *** 0.257*** 0.451**
Cluster 0 0.428 0.030 0.60 1129
(0.175) (0.213) (0.258)
30
17.902*** 3.887*** 2.117**
Cluster 1 0.529 0.069 0.40 1129
(0.175) (0.213) (0.258)
25 0.087*** 0.315*** 0.568**
Cluster 0 0.429 0.032 0.64 1634
(0.124) (0.157) (0.186)
25 11.457*** 3.171*** 1.760**
Cluster 1 0.526 0.073 0.36 1634
(0.124) (0.157) (0.186)
0.341*** 0.797* 1.212
Cluster 0 0.428 0.035 0.4 2477
(0.064) (0.097) (0.112)
9.483*** 3.033*** 1.876***
20 Cluster 1 0.526 0.077 0.3 2477
(0.094) (0.118) (0.145)
0.422*** 0.550*** 0.492***
Cluster 2 0.428 0.035 0.3 2477
(0.066) (0.092) (0.117)
0.444*** 0.556*** 0.479***
Cluster 0 0.424 0.040 0.3 3876
(0.053) (0.072) (0.086)
0.647*** 0.993 0.978
Cluster 1 0.436 0.043 0.2 3876
(0.048) (0.069) (0.073)
15
6.369*** 2.385*** 1.624***
Cluster 2 0.524 0.086 0.3 3876
(0.064) (0.075) (0.091)
0.443*** 0.788** 1.062
Cluster 3 0.424 0.042 0.2 3876
(0.053) (0.070) (0.081)
0.485*** 0.600*** 0.583***
Cluster 0 0.422 0.051 0.2 6668
(0.039) (0.052) (0.058)
0.642*** 1.050 1.037*
Cluster 1 0.434 0.051 0.2 6668
(0.035) (0.048) (0.051)
10
4.393*** 1.807*** 1.194**
Cluster 2 0.522 0.098 0.4 6668
(0.041) (0.050) (0.061)
0.534*** 0.867** 1.100
Cluster 3 0.426 0.055 0.2 6668
(0.037) (0.047) (0.054)
*p3. Quality of the information shared by users
Domain level
Table S3. Predicting quality score of the tweeted outlet taking users’ CRT score as independent variable using linear
regression cluster standard error by users. Model 1) no controls, Model 2) controlling for age, gender, and ethnicity, Model
3) controlling for age, gender, ethnicity, US residency, education, social/economic conservatism
Model 1 Model 2 Model 3
b b b
p p p
(SE) (SE) (SE)
0.101 0.114 0.094
0.011 0.001 0.003
(0.040) (0.034) (0.032)
Subject level
Table S4 Predicting average quality score tweets by the user’ CRT score as independent variable using linear regression.
Model 1) no controls, Model 2) controlling for age, gender, and ethnicity, Model 3) controlling for age, gender, ethnicity, US
residency, education, social/economic conservatism.
Model 1 Model 2 Model 3
OR OR OR
p p p
(SE) (SE) (SE)
0.075 0.066 0.035
0.044 0.09 0.518
(0.037) (0.039) (0.039)
34. Topic Modeling
We varied the number of topics in the structural topic modeling using the user CRT score as
the covariate. Across all number of topics, there is always one topic (related to political
engagement) that is positively correlated with CRT and one topic (related to “get rich quick”
schemes) that is negatively related to CRT.
Table S5 Topic related to political engagement vs number of topics in the model.
Number Representative words Coefficient of estimating
of topics topic proportion using CRT
k
5 peopl, will, amp, can, just, like, say, trump, one, get, now, need, 0.071**
vote, time, make, think, year, know, right, want
6 peopl, will, amp, trump, just, say, can, like, vote, get, one, now, 0.080**
need, make, think, right, time, know, want, year
7 peopl, will, amp, trump, say, can, just, vote, like, now, one, get, 0.076**
need, right, make, think, time, brexit, want, know
8 peopl, like, just, trump, will, one, say, can, get, know, make, 0.54**
dont, think, realdonaldtrump, want, time, need, thing, right, amp
9 peopl, will, amp, trump, say, vote, just, can, now, like, one, get, 0.064**
need, brexit, think, realdonaldtrump, right, make, time, year
10 peopl, will, amp, trump, say, vote, just, can, now, like, one, get, 0.064**
need, brexit, think, right, realdonaldtrump, make, time, year
*p5. Language use (word-level analysis)
Tweet level
Table S7 Predicting tweets word category using logistic regression taking z-scored users’ CRT score as independent
variable clustering standard error by username. Model 1) no controls, Model 2) controlling for age, gender, and ethnicity,
Model 3) controlling for age, gender, ethnicity, US residency, education, social/economic conservatism.
Model 1 Model 2 Model 3
Word OR OR OR
p pBH pHolm p pBH pHolm p pBH pHolm
category (SE) (SE) (SE)
1.135 1.134 1.106
Insight 0.000 0.000 0.000 0.000 0.000 0.000 0.000 0.000 0.000
(0.025) (0.025) (0.024)
1.105 1.111 1.101
Inhabitation 0.000 0.001 0.001 0.000 0.001 0.001 0.001 0.002 0.004
(0.027) (0.029) (0.028)
Positive 0.927 0.954 0.984
0.022 0.026 0.044 0.145 0.169 0.288 0.539 0.593 1.000
emotion (0.033) (0.032) (0.031)
Negative 1.139 1.135 1.115
0.000 0.000 0.000 0.000 0.000 0.000 0.000 0.001 0.001
emotion (0.031) (0.032) (0.030)
1.073 1.080 1.079
Morality 0.000 0.000 0.001 0.000 0.000 0.000 0.000 0.000 0.000
(0.019) (0.019) (0.019)
1.172 1.156 1.143
Political 0.005 0.008 0.016 0.022 0.031 0.061 0.028 0.039 0.084
(0.057) (0.063) (0.061)
Subject level
Table S8. Predicting fraction of tweets by a user in each word category using linear regression taking z-scored
users’ CRT score as independent variable. Model 1) no controls, Model 2) controlling for age, gender, and ethnicity, Model
3) controlling for age, gender, ethnicity, US residency, education, social/economic conservatism.
Model 1 Model 2 Model 3
Word b b b
p pBH pHolm p pBH pHolm p pBH pHolm
category
(SE) (SE) (SE)
0.107 0.101 0.099
Insight 0.000 0.000 0.000 0.000 0.000 0.000 0.000 0.000 0.001
(0.025) (0.025) (0.026)
Inhabitation 0.104 0.000 0.000 0.000 0.108 0.000 0.000 0.000 0.102 0.000 0.000 0.000
(0.025) (0.026) (0.026)
Positive -0.054 -0.033 -0.014
0.031 0.031 0.040 0.186 0.186 0.186 0.581 0.581 0.581
emotion (0.025) (0.025) (0.025)
Negative 0.136 0.135 0.123
0.000 0.000 0.000 0.000 0.000 0.000 0.000 0.000 0.000
emotion (0.025) (0.025) (0.026)
0.070 0.078 0.076
Morality 0.006 0.008 0.017 0.002 0.003 0.007 0.003 0.005 0.010
(0.025) (0.025) (0.026)
0.059 0.068 0.049
Political 0.020 0.024 0.040 0.007 0.008 0.014 0.054 0.064 0.107
(0.025) (0.025) (0.025)
5You can also read