Director Compensation Practices - IN THE RUSSELL 3000 AND S&P 500 | 2021 EDITION - In collaboration with: ESGAUGE
←
→
Page content transcription
If your browser does not render page correctly, please read the page content below

Director Compensation Practices
IN THE RUSSELL 3000 AND S&P 500 | 2021 EDITION

                           In collaboration with:
ESGAUGE is a data mining and analytics firm uniquely designed for the corporate
practitioner and the professional service firm seeking customized information on US
public companies. It focuses on disclosure of environmental, social, and governance
(ESG) practices such as executive and director compensation, board practices, CEO and
NEO profiles, proxy voting and shareholder activism, and CSR/sustainability disclosure.
Our clients include business corporations, asset management firms, compensation
consultants, law firms, accounting and audit firms, and investment companies. We also
partner on research projects with think tanks, academic institutions, and the media.
esgauge.com

SEMLER BROSSY is a leading independent executive pay and performance consulting
firm. We provide solutions in executive compensation, compensation governance, and
compensation in special situations. We serve a broad cross-section of companies across
industries, from the largest global corporations to smaller, privately held firms. We
partner with Compensation Committees and management teams to develop and apply
compensation solutions to support corporate strategy and ensure sound governance.
Clients choose us for our partnership, thorough thinking, and creative solutions.
We take off where others finish, helping clients address the most pressing issues in
compensation and governance.
semlerbrossy.com
Director Compensation Practices
                      in the Russell 3000 and S&P 500
                                2021 Edition
         Corporate boards of directors face a more acute set of challenges in setting their
         compensation than they have in recent years. Until recently, a primary focus was the risk
         of shareholder litigation challenging allegedly excessive director compensation. That
         concern has receded as many companies have taken steps to mitigate the risk of lawsuits.

         But now boards need to navigate two conflicting pressures. On the one hand, most
         boards may find it inappropriate to increase their compensation during the pandemic.
         On the other, there is pressure to think differently about (and in some cases increase)
         director compensation. Directors’ responsibilities and workload have substantially
         increased, and boards seek to attract a new breed of candidates with specialized skills
         and diverse backgrounds.

         Against that backdrop, Director Compensation Practices in the Russell 3000 and S&P
         500 reviews trends and developments at US public companies to provide insights into
         the compensation policies and programs for non-employee directors and help boards
         navigate these challenges.

         The analysis covers pay levels (in total and by element), the prevalence and rate of
         increases by element (such as cash retainer, meeting fees, equity-based compensation,
         and perquisites), supplemental compensation, and premiums granted for committee
         service and board and committee leadership roles, stock ownership and retention guide-
         lines, deferred compensation programs, and limits placed on director compensation.
         Statistics are reported in aggregate for each of the Russell 3000 and S&P 500, the 11
         business sectors in the Global Industry Classification Standard (GICS), and 14 company
         size groups (measured by both revenue and assets)—to allow for targeted comparison.

         The project is conducted by The Conference Board and ESG data analytics firm
         ESGAUGE, in collaboration with compensation consultancy Semler Brossy. See “Access
         our Online Dashboard” on p. 14 for more information on the study methodology as well
         as the definition of key terms (e.g., Total Compensation and Total Actual Compensation)
         used in this report. Visit conferenceboard.esgauge.org/directorcompensation to access
         and manipulate our data online.

3   DIRECTOR COMPENSATION PRACTICES IN THE RUSSELL 3000 AND S&P 500: 2021 EDITION        www.conferenceboard.org
Reflecting on 2020 and Insights for What’s Ahead
• Director pay reported in 2020 filings continued the upward trends reported
in recent years, as figures reflect decisions made before the pandemic. For a
few industries and some companies, increases were substantial, reflecting an
every three-to-four-year cycle of adjustments to bring director pay to market
instead of the annual increases often awarded to executives. Moves toward a
simpler approach to director compensation policy continued as well.
• Since the onset of the pandemic, a significant proportion of boards tempo-
rarily reduced or eliminated their pay, and few felt that an increase in retainers
going forward was appropriate. As a result, despite the exponential growth
in board members’ workload, the current disclosure season is likely to reveal
an end (or a pause?) to the trend of rising director compensation recorded
in recent years.
• Recruiting a new breed of diverse directors with different experience and
skills may require significant changes to director pay structures, including
adjusting compensation levels upwards to make posts more attractive to
in-demand talent. For directors who are not former CEOs, having pay in the
form of equity that is likely locked up until retirement may not be much of an
incentive to join a board, leading companies to seek new, creative solutions
such as signing equity grants or different equity/cash ratios.
• The pecking order of standing board committees when it comes to
committee compensation (audit at the top, followed by compensation then
nominating/governance) may be in for a reshuffle as director responsibilities
and workloads change and expand to human capital management, environ-
mental, social, governance skills and disclosures, diversity and inclusion—few
of which come under the purview of the audit committee.
• While instances of excessive director pay sporadically come to the fore, the
spotlight on board compensation from shareholders and proxy advisory firms
affects all companies. As a result, pay ceilings in equity plan documents are
more common, and advisory votes on board pay (or on those directors who
decide board pay) could become a more frequent proxy matter.
Director pay reported in 2020 filings continued the upward
trends reported in recent years, as figures reflect decisions
made before the pandemic. For a few industries and some
companies, increases were substantial, reflecting an every
three-to-four-year cycle of adjustments to bring director pay
to market instead of the annual increases often awarded to
executives. Moves toward a simpler approach to director
compensation policy continued as well.
4 DIRECTOR COMPENSATION PRACTICES IN THE RUSSELL 3000 AND S&P 500: 2021 EDITION www.conferenceboard.orgAccording to proxy statements filed in the January 1-December 31, 2020 period, the
median Total Compensation awarded to a board member in the latest fiscal year (most
often, 2019) was $189,980 in the Russell 3000 and $280,000 in the S&P 500. In both
indexes, these figures represent an increase from the previous fiscal year: the rate of
growth was higher (4.6 percent) for companies in the Russell 3000 compared to the
S&P 500 (1.8 percent).
These changes appear to be driven primarily by the rise in the value of equity awards.
According to 2020 disclosure documents, the median value of equity awards made to
board members increased by 7.6 percent since the prior year (from $110,000 to $118,355)
in the Russell 3000 and by 2.4 percent (from 165,000 to 168,933) in the S&P 500. On the
contrary, the dollar amounts of cash retainer and total meeting fees granted to directors
in the index were flat since the prior reporting year, with meeting fees used in director
compensation policies by only 17.4 percent of Russell 3000 companies and 12.5 percent
of S&P 500 companies. See p. 15 for how Total Compensation is calculated for the
purpose of this study.
The Russell 3000 analysis by business sector shows that the highest year-on-year
increases in the median value of Total Compensation occurred in the Materials and
Financials groups (8.2 percent and 7.1 percent, respectively), while the lowest were
reported by companies in the consumer product sectors (0.7 percent in Consumer
Discretionary and 0.9 percent in Consumer Staples). At least in part, this disparity can
be attributed to the fact that, while director pay may be reviewed annually, it is rarely
also adjusted annually. In fact, it is more likely to be increased only once every three,
four, or even five years. We can expect to see this practice continuing because compen-
sation committees typically do not want to increase director pay by incremental amounts,
generally waiting until a substantial market correction is necessary before recommending
changes. It is also worth noting that, while the Financials sector reported one of the
highest annual rates of increase, the median financial company granted the lowest Total
Compensation to its directors ($116,554, according to 2020 disclosure documents, or
almost half of the $221,875 paid by the median company in the Consumer Staples sector).
5 DIRECTOR COMPENSATION PRACTICES IN THE RUSSELL 3000 AND S&P 500: 2021 EDITION www.conferenceboard.orgFor comparison purposes, median increases in non-employee director compensation
lagged behind CEOs and named executive officers (NEOs). For CEOs in the Russell 3000,
the increase in median total compensation (i.e., the sum of the disclosed target value
of compensation elements, such as base salary, annual bonus, stock awards, and stock
options) was 7.8 percent. For CEOs in the S&P 500, the increase in total pay was 4.8
percent. For NEOs in the Russell 3000, the increase in median total compensation was 9
percent, and 3.7 for NEOs in the S&P 500.1
Since the onset of the pandemic, a significant proportion
of boards temporarily reduced or eliminated their pay, and
few felt that an increase in retainers going forward was
appropriate. As a result, despite the exponential growth in
board members’ workload, the current disclosure season
is likely to reveal an end (or a pause?) to the trend of rising
director compensation recorded in recent years.
While the median Total Compensation of directors reported in 2020 filings increased,
the data on Total Actual Compensation from this year’s proxy statements will most
likely paint a different picture. Not only were many director retainers reduced during
the pandemic, but owing to economic challenges of various kinds, it is likely that antici-
pated or planned increases will have been postponed. In fact, increases contemplated
during the fall of 2019 and instituted in the early months of 2020 may have been adjusted
back down again at some companies. See p. 15 for how Total Actual Compensation is
calculated for the purpose of this study.
1 Paul Hodgson and Matteo Tonello, CEO and Executive Compensation Practices in the Russell 3000 and S&P
500: 2020 Edition, The Conference Board/ESGAUGE/Semler Brossy, November 2020.
6 DIRECTOR COMPENSATION PRACTICES IN THE RUSSELL 3000 AND S&P 500: 2021 EDITION www.conferenceboard.orgOur Database of COVID-Related Compensation Changes
Although cuts to director retainers due to the pandemic may be partially
restored as the economic recovery continues, in 2020 compensation reduc-
tions were widespread.
According to a database created by ESGAUGE in collaboration with The
Conference Board and Semler Brossy, through March 31, 2021, 695 companies in
the Russell 3000 index announced adjustments to pay levels; of those, 416 included
both executives and directors, while the remainder applied only to executives. In
the sample of director pay cuts, 25 percent of the companies opted for the total
forfeiture of cash retainers, while another 25 percent of companies applied cuts
of between zero and 25 percent. Some 15 percent of the sample cut retainers by
half and 17 percent cut them by a quarter of their value. In most instances, pay was
reduced in the same proportion as for executives, but in 82 cases director pay went
down by more than for the CEO.
For the current list of Russell 3000 and S&P 500 companies that made this
announcement, access the public database.
Several other factors are putting downward pressure on the Total Actual Compensation
of directors.
The trend away from per-meeting fees (toward fixed-fee retainers) will mean there is no
compensatory upside to the marked increase in meetings in response to the pandemic.
Since the onset of the COVID-19 crisis, directors had to meet much more frequently,
as reported in recent months and confirmed by data on board practices maintained
by ESGAUGE and The Conference Board.2 If, in the past, such a rise in the number of
meetings would have led to an increased level of compensation for directors, under the
new circumstances this increased workload is unlikely to have similar effects.
* TBD indicates that the company disclosed the reduction but not its magnitude.
2 Rusty O’Kelley et al., Corporate Governance Challenges in the COVID-19 Crisis: Findings from a Survey of US
Public Companies, The Conference Board/ESGAUGE, June 2021.
7 DIRECTOR COMPENSATION PRACTICES IN THE RUSSELL 3000 AND S&P 500: 2021 EDITION www.conferenceboard.orgThe extra director Among those that do still pay meeting fees,
around 70 percent of companies award
workload resulting them for live meetings only. Only about
from the COVID crisis is 30 percent pay them for both live board
unlikely to lead to the meetings and telephonic or videoconference
meetings. Almost all board meetings were
pay rises experienced
remote during 2020, which may also keep a
years ago. lid on pay for some directors. Therefore, a
change to this policy might be forthcoming, with companies potentially paying the same
for remote meetings as in-person. 3
That all said, the volatility of the stock market may also have had a dampening effect,
at least initially, on the “take-home” value of director compensation. The standard way
of calculating equity awards (i.e., a fixed value of shares, either stock or stock options)
might have resulted in directors receiving more shares at lower prices if those shares were
granted during the initial depths of the pandemic.
Therefore, the policy of granting stock based on a fixed value could be subject to some
change or, at least, adaptation. Undoubtedly, many companies had to make adjustments
to the way they calculated share awards. These have included delaying grant dates until
share prices have normalized, using six-month trailing average stock prices or premium
pricing stock. New plans may make allowances for these kinds of adjustments to be an
integral part of a flexible policy adapted to meet any situation.
Recruiting a new breed of diverse directors with different
experience and skills may require significant changes to
director pay structures, including adjusting compensation
levels upwards to make posts more attractive to in-demand
talent. For directors who are not former CEOs, having pay
in the form of equity that is likely locked up until retirement
may not be much of an incentive to join a board, leading
companies to seek new, creative solutions such as signing
equity grants or different equity/cash ratios.
While there is a strong impulse to constrain pay levels given the current circumstances,
many companies must keep their director compensation policies attractive to a diverse
slate of candidates with relevant operating expertise in the evolving business landscape.
The new demand for diversity in the boardroom may also further accentuate the director
recruitment challenges encountered by smaller companies and certain industries. For
some years, our data has been showing that almost twice the proportion of Russell 3000
companies (21.8 percent, according to 2020 disclosure) offer a sign-on equity grant to
newly elected directors, compared to the S&P 500 (12.3 percent). This finding is even
3 Matteo Tonello, 2021 Proxy Season Preview and Shareholder Voting Trends (2017-2020), The Conference Board/
ESGAUGE, January 2021.
8 DIRECTOR COMPENSATION PRACTICES IN THE RUSSELL 3000 AND S&P 500: 2021 EDITION www.conferenceboard.orgmore pronounced in the Health Care sector, where as much as 57.6 percent of companies
offer a sign-on bonus.
In the face of economic concerns, companies are reluctant to permanently increase
compensation levels for newly recruited directors; therefore, they may favorably view the
use of sign-on equity grants or the offer of a choice among compensation packages with
different equity/cash mixes. Some directors, especially those who may not be coming to
the board with a long career as a corporate executive, may benefit from these one-time
grants and a somewhat higher portion of cash compensation. To avoid any negative
attention from proxy advisors or shareholders’ concerns, boards should disclose such
awards and explain their rationale, especially that they are non-recurring payments (if that
is indeed the case).
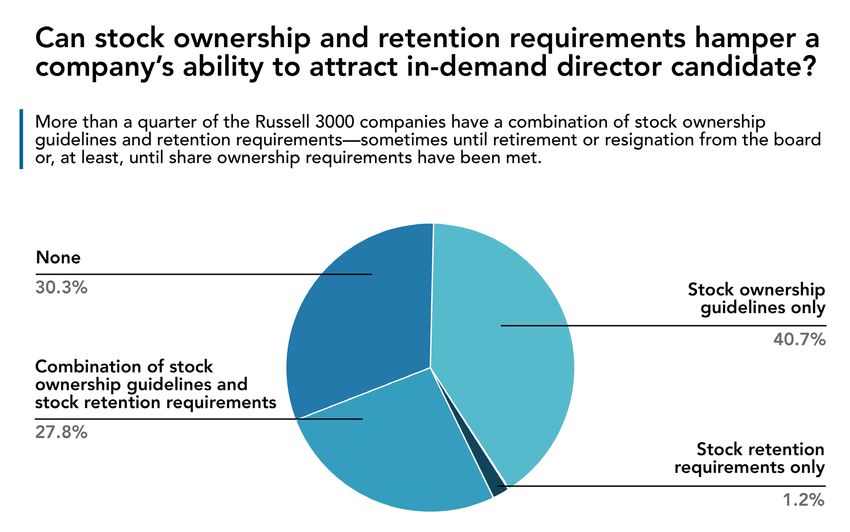
Few companies, either in the Russell 3000
Companies should or the S&P 500, have either mandatory or
a combination of mandatory or elective
explain the rationale
deferred compensation policies, so this
for sign-on awards, to practice is unlikely to be a significant barrier
avoid negative scrutiny to recruitment. However, more than a
from proxy advisors and quarter and just less than half of the Russell
3000 and the S&P 500, respectively, have a
shareholders. combination of stock ownership guidelines
and retention requirements—sometimes until retirement or resignation from the board
or, at least, until share ownership requirements have been met.
9 DIRECTOR COMPENSATION PRACTICES IN THE RUSSELL 3000 AND S&P 500: 2021 EDITION www.conferenceboard.orgMandatory deferral policies, hold-until-retirement or post-retirement provisions, and other
stock retention provisions that defer transfer or vesting of stock until after a director leaves
the board could impair the companies’ ability to recruit in-demand candidates. It will then
be helpful to monitor how these policies evolve in the coming years.
The pecking order of standing board committees when it
comes to committee compensation (audit at the top, followed
by compensation then nominating/governance) may be in for a
reshuffle as director responsibilities and workloads change and
expand to human capital management, environmental, social,
governance skills and disclosures, diversity and inclusion—few
of which come under the purview of the audit committee.
Typically, supplemental committee member compensation is highest for the audit
committee, followed by the compensation committee, with nominating/governance
committee in third place. Our most recent Russell 3000 data, in particular, show that audit
committee members earn, at the median, an annual supplemental retainer of $10,000,
compared to $7,500 for compensation committee members and $5,000 for nominating/
governance committee members. The leadership roles at these committees are also
rewarded differently, with audit committee chairs paid an annual premium of $15,000,
compared to the $10,000 granted, at the median, to their counterparts at the compen-
sation and nominating/governance committees.
10 DIRECTOR COMPENSATION PRACTICES IN THE RUSSELL 3000 AND S&P 500: 2021 EDITION www.conferenceboard.orgIn recent years, the workload and breadth of directors’ responsibility have been
rising, as evidenced by an increasing number of meetings.4 Additional responsibilities
encompass areas such as the oversight of environmental, social, and governance (ESG)
practices, the promotion of policies advancing diversity, equity, and inclusion (DE&I) in
the workforce, and the mitigation of risks related to climate change. At the same time,
scrutiny of director pay levels is intensifying, alongside increased scrutiny of executive
pay, for which directors are responsible. This expansion is beginning to affect the
standing of committees.
The general principle in committee pay is
Directors are paid for to compensate for the additional workload
required to perform the specific tasks
their time. If this principle
assigned to a committee. As a result, over
still holds true after the time and once the current crisis has passed,
COVID crisis, new board these developments may bleed through to
responsibilities on ESG director pay levels in the form of increased
supplemental retainers for committee
oversight will translate service. In particular, if the compensation
into higher committee committee is given responsibility for the
compensations. oversight of DE&I while the task of hiring
directors with ESG experience is assigned
to the nominating/governance committee, it is likely that compensation premiums
for the service on (and the leadership of) those committees will increase and catch
up to audit retainers.
Similarly, pay for leadership roles within the board may begin to outpace the overall
growth rate of standard director compensation. Data on leadership premiums
published in 2020 proxy statements already show a rise in the median retainer for the
chair of the nominating/governance committees at the largest US public companies
by annual revenue—to $20,000, from $15,000 of the prior disclosure year. It might be
an early indication of the potential developments in supplemental compensation for
board committee leaders.
Another point to consider is that, while some companies try to calibrate compen-
sation based on committee workload, others do not pay extra for committee chairs or
committee service. It happens because they understand that the duties and workloads
will change over time or because they don’t want to impair committee members and
chairs’ rotation or create divisions within the board. With this in mind, the convergence
described above could be a further opportunity to take a fresh look at whether supple-
mental compensation for committee membership and leadership should be used at all.
4 For a review of recent data on the frequency of board committee meetings and the expanding committee
responsibilities, see Matteo Tonello, Corporate Board Practices in the Russell 3000 and S&P 500: 2020 Edition,
The Conference Board/ESGAUGE, October 2020.
11 DIRECTOR COMPENSATION PRACTICES IN THE RUSSELL 3000 AND S&P 500: 2021 EDITION www.conferenceboard.orgWhile instances of excessive director pay sporadically come
to the fore, the spotlight on board compensation from
shareholders and proxy advisory firms affects all companies.
As a result, pay ceilings in equity plan documents are more
common, and advisory votes on board pay (or on those
directors who decide board pay) could become a more
frequent proxy matter.
Even though shareholder litigation fears over excessive director pay5 may have subsided
in the past couple of years, the number of companies applying a ceiling to director
compensation continues to grow. According to our review of proxy statements, in the
last three disclosure years, the percentage of companies reporting some type of director
pay ceiling has grown, from 48.7 to 61.5 in Russell 3000 and from 53 to 66.9 in the S&P
500. Specially, the share of companies setting limits on total director compensation
(whether made of cash only or cash and equity) has risen to 26.9 percent in the Russell
3000 and 28.9 percent in the S&P 500 (from the 16.1 percent and 18.9 percent reported,
respectively, in 2017 filings). Moreover, about 30 percent of S&P 500 companies have
dollar-denominated equity limits, and 16.3 percent of Russell 3000 companies disclose
share-denominated equity limits.
The introduction of compensation limits for directors mitigates the risks of litigation.
It may also head off objections from proxy advisors. In particular, ISS considers the
adoption of pay limits when assessing non-executive director compensation policies for
which management seeks shareholder ratification.6 It also recommends a vote against
directors responsible for setting board compensation at a company that shows excessive
director pay for two successive years—unless it discloses “a compelling rationale or other
mitigating factors” for being an outlier.7 (Glass Lewis, the other large proxy advisory
service in the US, also warns about the dangers of excessive director pay as it can
compromise the objectivity and independence of non-executive directors. However, its
guidelines are not specific on what should be viewed as “excessive” and do not equally
emphasize the importance of benchmarking by company size and industry.8)
5 For a discussion, see the last edition of this study: Mark Emanuel, Todd Sirras, and Matteo Tonello, Director
Compensation Practices in the Russell 3000 and S&P 500: 2020 Edition, The Conference Board/ESGAUGE/
Semler Brossy, April 2020.
6 United States Proxy Voting Guidelines: Benchmark Policy Recommendations, Institutional Shareholder Services
(ISS), November 19, 2020, p. 50. Where companies do offer up their director compensation policy to a share-
holder vote, ISS will assess factors such as the relative magnitude of director compensation as compared to
companies of a similar profile, equity award vesting schedules, the cash-equity mix, and meaningful limits on
director compensation.
7 Id., p. 16.
8 2021 Proxy Paper Guidelines: United States, Glass Lewis, p. 47.
12 DIRECTOR COMPENSATION PRACTICES IN THE RUSSELL 3000 AND S&P 500: 2021 EDITION www.conferenceboard.orgThe Definition of Outlier and the Importance of Benchmarking in
Setting Director Pay
The ISS voting policy defines outliers as those companies reporting director pay
figures above the top 2 percent of all comparable directors within the same index
and two-digit GICS business sector group.
In practice, within those groupings, the distribution of director pay data can be
much more compressed than the one often observed for executive compensation,
underscoring the importance of stress-testing director compensation in different
benchmarking scenarios. For example, according to our data, in the Russell 3000
Consumer Discretionary sector, the difference in total director compensation
between the median and the 90th percentile can amount to only $68,008, or 32.6
percent of the median (a fraction of what is typically seen in executive compensation
data). Therefore, companies should be mindful of the effects on total compen-
sation of program features such as meeting fees and guidelines applicable to
fixed-share grants. In a year of frequent meetings or rapid share price appreciation,
these features could easily move the company’s directors to the higher end of the
peer comparative range.
The ISS policy recognizes that board-level leadership positions, such as non-executive
chairs and lead independent directors, are often paid more than other directors and thus
compares such positions to similar roles. Reasons that might mitigate a company’s position
as an outlier include the payment of legacy retirement benefits or incentives earned as an
executive but paid after becoming an outside director.
Over time, and for the reasons just explained, a ceiling for director equity pay may become
a standard part of all or most director equity plans. To place a ceiling on cash payments,
management could submit a proposal on the specific issue of director compensation
limits for a vote at the next annual meeting.
Over time, a ceiling for This practice would provide similar legal
director equity pay may protections as equity pay ceilings in equity
plans. Alternatively, a change in the board
become a standard part of
or committee charter that applied an overall
all or most director equity ceiling to total director compensation amounts
plans. although it would not grant legal protection
unless also ratified by shareholders.
13 DIRECTOR COMPENSATION PRACTICES IN THE RUSSELL 3000 AND S&P 500: 2021 EDITION www.conferenceboard.orgAccess our Online Dashboard
Director Compensation Practices in the Russell 3000 and S&P 500: 2021 Edition
documents trends and developments in non-employee director compensation at 2,855
companies issuing equity securities registered with the US Securities and Exchange
Commission (SEC) that filed their proxy statement in the period between January 1 and
December 31, 2020, and, as of January 2021, were included in the Russell 3000 Index.
The project is a collaboration among The Conference Board, compensation consulting
firm Semler Brossy, and ESG data analytics firm ESGAUGE.
Data from Director Compensation Practices in the Russell 3000 and S&P 500: 2021
Edition can be accessed and visualized through an interactive online dashboard. The
dashboard is organized into six parts.
Part I: Compensation Elements, with benchmarking information on the prevalence,
value, and year-on-year increases of cash retainers, meeting fees, stock awards, stock
options, and any benefits and perquisites.
Part II: Supplemental Compensation, including the cash retainer and meeting fees
granted for serving on board committees and the premiums offered for board and
committee leadership roles.
Part III: Equity-Based Compensation, which reviews cash and equity compen-
sation mix, the prevalence and value of various equity award types, and the vesting
schedules of awarded equity.
Part IV: Stock Ownership Guidelines and Retention Policies, for a detailed analysis of
the features of ownership guidelines for board members (including their disclosure, their
compliance window, the definition of ownership adopted, and whether the guidelines
revolve around a multiple of the cash retainer or a specific number of shares) and the
types of retention requirements applicable to equity-based compensation (including the
retention ratios and the duration of the retention period).
Part V: Compensation Limits, including the prevalence of limits by type (whether total
compensation limits, dollar-denominated limits or share-denominated limits) and the
median and average value of these ceilings.
Part VI: Deferred Compensation and Deferred Stock Units (DSUs), including elective
and mandatory deferrals, to what compensation element the deferral applies, the form of
the deferred compensation payout, the use of deferred cash investment vehicles (such as
money-market or savings accounts, retirement accounts, or others) and the prevalence,
value, holding requirements, vesting periods, and payout forms of DSUs.
Compensation figures included in Director Compensation Practices in the Russell
3000 and S&P 500: 2021 Edition reflect the disclosures made in the director compen-
sation tables and narratives included, under SEC rules, in proxy statements filed during
the examined period.
The following calculation methodologies were applied. The calculations extend to the
entire sample of companies, including those reporting no value for any of the compen-
sation components or supplemental compensations described:
14 DIRECTOR COMPENSATION PRACTICES IN THE RUSSELL 3000 AND S&P 500: 2021 EDITION www.conferenceboard.orgTotal Compensation figures are the sum of all compensation elements paid to
each member of the board of directors (including cash retainer, total meeting
fees, stock awards, and stock options but excluding the values reported under
“other compensation,” which often display significant variations from company to
company) plus the per-director value of the supplemental compensation paid to
committee members (exclusive of any leadership premiums).
Unlike Total Compensation, Total Board Service Compensation excludes any
supplemental compensation paid for committee service.
Total Actual Compensation is the average of the amounts actually received by each
director on the board, as reported in the Director Compensation table included
in the proxy statement. Since the compensation paid to individual directors varies
based on committee membership, leadership role, meeting attendance, and time
of appointment, the average across the board is calculated.
Total Committee Service Compensation is the sum of all cash retainers
and total meeting fees for all meetings held across all standing or special
committees of the board, divided by the number of directors. It excludes
board chair premiums and committee leadership premiums. The sum of Total
Committee Service Compensation and Total Board Service Compensation then
equals Total Compensation.
Total Committee Leadership Premium is the sum of the premiums paid to the
directors serving as chairs of standing or special committees of the board, above
the value of a committee member’s compensation
Total Compensation is reported two ways: exclusive of initial equity premiums and
inclusive of initial equity premiums on an annualized basis. For the calculation inclusive of
initial equity premiums, the premium was annualized over a five-year period: As a result,
the figures reported represent 1/5 of any initial equity premium value.
Compensation figures are reported for the aggregate Russell 3000 and the aggregate
S&P 500. Russell 3000 figures are also segmented according to business industry and
company size. The industry analysis aggregates companies within 11 groups, using
the applicable Global Industry Classification Standard (GICS). For the company-size
breakdown, data are categorized along seven annual-revenue groups (based on data
from all GICS groups except for companies in the Financials and Real Estate sectors)
and seven asset-value groups (exclusively based on data reported by companies in the
Financials and Real Estate sectors, which tend to use this type of benchmarking). Annual
revenue and asset values are measured in US dollars as of December 31, 2020.
The Russell 3000 sample distribution is illustrated in Exhibits 1 through 4. To highlight
historic trends, the most recent data are compared with the compensation disclosures
included in 2019 and 2017 filings by companies that, as of January of each of those years,
were in the Russell 3000 Index.
15 DIRECTOR COMPENSATION PRACTICES IN THE RUSSELL 3000 AND S&P 500: 2021 EDITION www.conferenceboard.orgExhibit 1—Sample Distribution, by Exhibit 3—Business Sectors, Industry Groups and
Index (2020) GICS Codes
by Index (2020)s
Index n= GICS GICS
Business Sector Industry Group
Code Subcode
Russell 3000 2855 Communication Media &
50 5020
S&P 500 495 Services Entertainment
Source: ESGAUGE, 2021. Communication Telecommunication
50 5010
Services Services
Consumer Automobiles &
25 2510
Discretionary Components
Exhibit 2: Sample Distribution, by
Business Sector (GICS) (2020) Consumer Consumer Durables &
25 2520
Discretionary Apparel
Business Sector Percent of Consumer
n= 25 Consumer Services 2530
(GICS) total Discretionary
Communication Consumer
106 3.7% 25 Retailing 2550
Services Discretionary
Consumer Consumer Food & Staples
126 4.4% 30 3010
Discretionary Staples Retailing
Consumer Consumer Food Beverage &
313 11.0% 30 3020
Staples Staples Tobacco
Energy 546 19.1% Consumer Household & Personal
30 3030
Financials 376 13.2% Staples Products
Health Care 72 2.5% Energy 10 Energy 1010
Industrials 377 13.2% Financials 40 Banks 4010
Information Financials 40 Diversified Financials 4020
187 6.5% Financials 40 Insurance 4030
Technology
Materials 104 3.6 Health Care
Health Care 35 3510
Real Estate 113 4.0 Equipment & Services
Utilities 535 18.7% Pharmaceuticals,
Health Care 35 Biotechnology & Life 3520
Source: ESGAUGE, 2021.
Sciences
Industrials 20 Capital Goods 2010
Commercial &
Industrials 20 2020
Professional Services
Industrials 20 Transportation 2030
Semiconductors
Information
45 & Semiconductor 4530
Technology
Equipment
Information
45 Software & Services 4510
Technology
Information Technology Hardware
45 4520
Technology & Equipment
Materials 15 Materials 1510
Real Estate 60 Real Estate 6010
Utilities 55 Utilities 5510
Source: MSCI, Inc., 2021.
16 DIRECTOR COMPENSATION PRACTICES IN THE RUSSELL 3000 AND S&P 500: 2021 EDITION www.conferenceboard.orgExhibit 4—Sample Distribution,
by Company Size (2020)
Annual Revenue
(All companies except Financials Percent
n=
and Real Estate) of total
Under $100 million 351 12.3%
$100 million to < $1 billion 645 22.6%
$1 billion to < $5 billion 686 24.0%
$5 billion to < $10 billion 176 6.2%
$10 billion to < $25 billion 171 6.0%
$25 billion to < $50 billion 44 1.5%
$50 billion and over 49 1.7%
Asset Value
(Financials and Real Estate Percent
n=
companies) of total
Under $500 million 21 0.7%
$500 million to < $1 billion 44 1.5%
$1 billion to < $10 billion 438 15.3%
$10 billion to < $25 billion 108 3.8%
$25 billion to < $50 billion 55 1.9%
$50 billion to < $100 billion 23 0.8%
$100 billion and over 44 1.5%
Source: ESGAUGE, 2021.
Data in this report are descriptive, not prescriptive, and should be used only to identify the latest practices
and emerging trends. None of the commentaries included are intended as recommendations on director com-
pensation design, compensation-related resolutions, or board oversight practices in the field. On the contrary,
The Conference Board, Semler Brossy, and ESGAUGE recommend that companies make compensation and
governance decisions after careful consideration of the company’s specific circumstances in the current mar-
ketplace, including its overall compensation policy, strategic priorities, and business needs.
Access the dashboard at: conferenceboard.esgauge.org/shareholdervoting
Access the dashboard at:
conferenceboard.esgauge.org/directorcompensation
17 DIRECTOR COMPENSATION PRACTICES IN THE RUSSELL 3000 AND S&P 500: 2021 EDITION www.conferenceboard.orgOnline Dashboard Table of Contents
Visit: conferenceboard.esgauge.org/directorcompensation
PART I: COMPENSATION ELEMENTS Guideline Compliance Disclosure, Prevalence (2017-2020)
Equity Award Types, Prevalence (2017-2020)
Director Compensation Elements, Prevalence (2017-2020)
Guideline Design Type, Prevalence (2017-2020)
Meeting Fee Types (2017-2020)
Retainer Multiple, Prevalence (2017-2020)
Director Compensation Elements, Value (2020)
Interim Stock Ownership Requirements (2017-2020)
Director Compensation Mix (2017-2020)
Ownership Definition (2017-2020)
Cash Compensation Structure (2017-2020)
Compliance Window (Accumulation Period) (2017-2020)
Cash vs. Equity Compensation Structure (2017-2020)
Ownership Guidelines, Value (2020)
Total Compensation, Median Value (2017-2020)
Ownership Guidelines, Median Value (2017-2020)
Total Actual Compensation, Median Value (2017-2020)
Stock Retention Policies for Directors, Prevalence
Cash Retainer, Median Value (2017-2020)
(2017-2020)
Cash Retainer Increases, Prevalence (2017-2020)
Retention Requirement Type, Prevalence (2017-2020)
Total Meeting Fees, Median Value (2017-2020)
Retention Ratio, Prevalence (2017-2020)
Meeting Fee Increases, Prevalence (2017-2020)
Duration of Retention Period, Prevalence (2017-2020)
Stock Awards, Median Value (2017-2020)
Stock Award Increases, Prevalence (2017-2020) PART V: COMPENSATION LIMITS
Stock Options, Median Value (2017-2020)
Shareholder-Approved Limits on Annual Director
Stock Option Increases, Prevalence (2017-2020)
Compensation, Prevalence (2017-2020)
Other Compensation, Median Value (2017-2020)
Shareholder-Approved Limits on Annual Director
Other Compensation Increases, Prevalence (2017-2020) Compensation, Value (2017-2020)
Director Perquisites, Prevalence (2017-2020) Shareholder-Approved Limits on Annual Director
Director Perquisites, Value (2017-2020) Compensation, Median Value (2017-2020)
Director Perquisites, Median Value (2017-2020) Limit Multiple (2020)
PART II: SUPPLEMENTAL COMPENSATION PART VI: DEFERRED COMPENSATION AND DSUs
Supplemental Compensation, Prevalence (2017-2020) Deferred Compensation Policy, Prevalence (2017-2020)
Committee Service Compensation, Value (2020) Deferred Compensation Elements, Prevalence (2017-2020)
Committee Service Compensation, Median Value Cash vs. Equity Director Compensation Deferrals,
(2017-2020) Prevalence (2017-2020)
Committee Leadership Premium, Value (2020) Mandatorily Deferred Percentage of Director
Committee Leadership Premium, Median Value (2017-2020) Compensation Elements (2017-2020)
Board Leadership Premium, Value (2020) Deferred Cash Investment Vehicle, Prevalence (2017-2020)
Board Leadership Premium, Median Value (2017-2020) Deferred Compensation Payout Form, Prevalence
(2017-2020)
PART III: EQUITY-BASED COMPENSATION
Deferred Compensation Payout Time, Prevalence
Features of Equity-Based Compensation Policy for (2017-2020)
Directors, Prevalence (2017-2020) Deferred Stock Units (DSUs), Prevalence (2017-2020)
Cash and Equity Compensation Mix (2017-2020) Deferred Stock Units (DSUs), Value (2020)
Equity Award Types, Prevalence (2017-2020) Deferred Stock Units (DSUs), Median Value (2017-2020)
Equity Award Types, Value (Excluding Annualized Initial DSU Vesting Period (2017-2020)
Equity Awards) (2020) DSU Holding Requirements (2017-2020)
Equity Award Types, Value (Including Annualized Initial Dividend Treatment on Undelivered DSUs (2017-2020)
Equity Awards) (2020) DSU Payout Form (2017-2020)
Equity Award Types, Median Value (Excluding Annualized
Initial Equity Awards) (2017-2020)
Equity Award Types, Median Value (Including Annualized
Initial Equity Awards) (2017-2020)
Equity Denomination (2017-2020)
Equity Vesting Schedule (2017-2020)
Cliff vs. Graded Vesting (2017-2020)
PART IV: STOCK OWNERSHIP & RETENTION
REQUIREMENTS
Stock Ownership Guidelines for Directors, Prevalence
(2017-2020)
Guideline Compliance Disclosure, Prevalence (2017-2020)
Equity Award Types, Prevalence (2017-2020)
Guideline Design Type, Prevalence (2017-2020)
Retainer Multiple, Prevalence (2017-2020)
Stock Ownership Guidelines for Directors, Prevalence
(2017-2020)
18 DIRECTOR COMPENSATION PRACTICES IN THE RUSSELL 3000 AND S&P 500: 2021 EDITION www.conferenceboard.orgAbout the Authors
Mark Emanuel is Managing Director at Semler Brossy. Matteo Tonello is Managing Director, ESG Research
He has nearly 15 years of executive and management at The Conference Board. In his role, Tonello advises
compensation consulting experience with Semler The Conference Board members on issues of corporate
Brossy. Mark advises clients across industries, with governance, risk management, corporate sustain-
a depth of expertise in retail and consumer-facing ability, and citizenship. He is a graduate of Harvard Law
businesses and financial services. He particularly enjoys School and the University of Bologna.
helping companies navigate strategic transformation
and turnarounds through thoughtful metric selection
and goal setting. Mark holds a BS in Engineering from
Harvey Mudd College.
Paul Hodgson is Senior Advisor to ESG data analytics
firm ESGAUGE and serves as chief US correspondent
for Responsible Investor. He has co-authored The
Conference Board’s CEO and Executive Compensation
Practices report since 2016. Paul has more than 25
years of experience in the fields of ESG and executive
and director compensation. Until 2012, he was GMI/
The Corporate Library’s Chief Research Officer. He
was also the chief author of GMI’s award-winning blog
and a regular contributor to Fortune and Forbes.com,
among many other publications. He is a graduate of
Durham University and University College, Cardiff.
Elijah Ostro is a consultant at Semler Brossy with
13 years of executive compensation experience. He
graduated from the University of Arizona with dual
degrees in English Literature with honors and Business
Economics, and conducted a portion of his studies at
Oxford University. Prior to joining Semler Brossy, he
founded and managed an IT services business.
Todd Sirras joined Semler Brossy in 2002 and was
named Managing Director in 2005. Earlier in his career,
he was a Senior Vice President in Bank of America’s
Asset Management Group and a trader in listed equity
options for O’Connor & Associates. He is a graduate
of NYU Stern School of Business, the University of
Virginia, and Phillips Exeter Academy.
19 DIRECTOR COMPENSATION PRACTICES IN THE RUSSELL 3000 AND S&P 500: 2021 EDITION www.conferenceboard.orgTHE CONFERENCE BOARD is the member-driven think tank that delivers trusted insights for what’s ahead. Founded
in 1916, we are a nonpartisan, not-for-profit entity holding 501(c)(3) tax-exempt status in the United States.
THE CONFERENCE BOARD, INC. | www.conferenceboard.org
( )
PUBLISHING TEAM
DESIGN Peter Drubin
EDITOR Paul Hodgson
GRAPHICS and Paras Shishodia, Abhishek Sinha
© 2021 The Conference Board, Inc. All rights reserved. PRODUCTION (GrowthGear)You can also read