Discriminating crop and other canopies by overlapping binary image layers - Ryoichi Doi
←
→
Page content transcription
If your browser does not render page correctly, please read the page content below

Discriminating crop and other canopies
                 by overlapping binary image layers

                 Ryoichi Doi

Downloaded From: https://www.spiedigitallibrary.org/journals/Optical-Engineering on 26 Jan 2021
Terms of Use: https://www.spiedigitallibrary.org/terms-of-use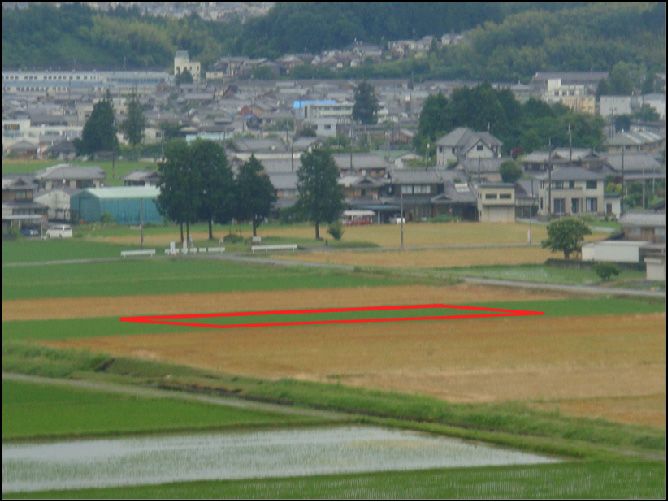
OE Letters

                                                                                                  components of red-green-blue (RGB) and other color models
                Discriminating crop and                                                           are used.4 Therefore, overlapping pixels with (intensity) val-
                other canopies by                                                                 ues within crop-specific intensity ranges as black pixels of
                                                                                                  binary image layers was expected to reveal both more
                overlapping binary image                                                          crop-likely pixels and less crop-likely pixels. Hence, this
                                                                                                  study was conducted to examine the binarization and over-
                layers                                                                            lapping method to distinguish a rice canopy from canopies of
                                                                                                  weed and tree species and other objects in a digital photo-
                                                                                                  graph acquired in Shiga prefecture, Japan.
                Ryoichi Doi
                The University of Tokyo, Graduate School of Agricultural                          2 Methods
                and Life Sciences, 1-1-1 Yayoi, Bunkyo-ku, Tokyo
                113-8657, Japan                                                                   2.1 Photograph
                E-mail: roird2000@yahoo.com
                                                                                                  A photograph was acquired in Koka city, Shiga prefecture,
                                                                                                  Japan, (34° 55 N, 136° 09 E) at 14.41 on 16 Jun 2012 using a
                Abstract. For optimal management of agricultural fields by
                remote sensing, discrimination of the crop canopy from                            digital camera (Cyber-shot DSC T-700, Sony, Tokyo). A
                weeds and other objects is essential. In a digital photograph,                    scene including paddy fields, various weed and tree cano-
                a rice canopy was discriminated from a variety of weed and                        pies, and other objects was photographed. Eventually,
                tree canopies and other objects by overlapping binary image                       2048 × 1536 pixels were acquired as a JPEG file (Fig. 1).
                layers of red-green-blue and other color components indicat-
                ing the pixels with target canopy-specific (intensity) values                     2.2 Processing the Digital Image
                based on the ranges of means ð3×Þ standard deviations.
                By overlapping and merging the binary image layers, the tar-                      Adobe Photoshop 7.0 was used as one of the tools to extract
                get canopy specificity improved to 0.0015 from 0.027 for the                      and combine information on the pixels in Fig. 1. After open-
                yellow 1× standard deviation binary image layer, which was                        ing the photograph, a rhombus-shaped frame was prepared
                the best among all combinations of color components and                           on a single paddy field [Fig. 1(b)]. The grayscale layers that
                means ð3×Þ standard deviations. The most target rice can-                        show the intensity values of R, G, B, cyan (C), magenta (M),
                opy-likely pixels were further identified by limiting the pixels at               yellow (Y), key black (K), and lightness (L) and the values
                different luminosity values. The discriminatory power was also                    of a and b were prepared.5 RGB, CMYK, and L  a  b
                visually demonstrated in this manner. © 2013 Society of Photo-                    color models are unique.6 In each grayscale layer, (intensity)
                Optical Instrumentation Engineers (SPIE) [DOI: 10.1117/1.OE.52.2.020502]          values of the color component for the pixels in the rhombus
                                                                                                  frame were reported. In the grayscale layer, the pixels with
                Subject terms: binarization and overlapping; canopy; color models/
                components; crop, weed and tree species; standard deviation.                      (intensity) values between mean 1× or 3× standard
                                                                                                  deviation (SD) were identified to obtain a binary image
                Paper 121266L received Sep. 5, 2012; revised manuscript received                  layer. The pixels with values in the range were black-colored
                Dec. 21, 2012; accepted for publication Jan. 2, 2013; published online
                Jan. 25, 2013.
                                                                                                  while the others were white. Then, the percentages of black
                                                                                                  pixels inside and outside of the rhombus frame were deter-
                                                                                                  mined. These statistics were used to find the color compo-
                1 Introduction                                                                    nent that specifically shows the rice canopy. In this study,
                Observation of changes in leaf spectral profile (color) is                        target rice canopy-specific color components were chosen
                                                                                                  and the binary image layers were merged. Then, the pixels
                important for crop management.1 Spatial unevenness in
                                                                                                  were indicated as white and gray pixels. The gray pixels had
                leaf color abnormalities is common in actual agricultural
                                                                                                  different intensity values so that the likeliness of the pixels to
                fields, and observation is facilitated by remote sensing of
                                                                                                  represent the rice canopy was shown. More and less target
                the whole field. The precise observation of crop canopies,
                                                                                                  rice canopy-likely pixels were shown by setting a threshold
                as an assembly of leaves, is becoming more feasible as a
                                                                                                  value of gray intensity.
                result of recent development in remote sensing technologies
                such as balloons with remotely controlled digital cameras in
                                                                                                  3 Results and Discussion
                addition to the most advanced remote sensing sensors. A pre-
                requisite for the precise observation of crop canopies is the                     Figure 2 shows binary image layers for the color compo-
                ability to discriminate them from weeds and other plant can-                      nents. Each binary image layer indicates the pixels with
                opies.2 Zheng et al.,3 succeeded in the distinction of crop                       (intensity) values between the mean ð3×Þ the SD for the
                leaves from bare soil in digital photographs of agricultural                      rhombus frame in Fig. 1. Among the color components,
                fields. Their achievements were based on the differences                          Y appears to be the most advantageous in specifically finding
                in color between the greenish plant leaves and the bare                           the pixels that represent the rice canopy. In the Y1 × SD
                soil. Discrimination between crop canopies and other                              (1SD) binary image layer, most of the pixels outside of
                plant species was expected to be more difficult because                           the rhombus frame were recognized to be different from
                the differences in color may be less significant than those                       those of the target rice canopy. A majority of the pixels
                between crop leaves and bare soil or other non-greenish                           of the rice canopy had Y values between 67 and 77. In
                objects. However, the ranges of (intensity) values of some                        the Y 1SD binary image layer, outside of the rhombus
                color components may be crop-specific when the                                    frame, the number of pixels with (intensity) values within
                                                                                                  the mean SD range was the smallest (2%). The 3SD binary
                                                                                                  image layers tend to have more black pixels both inside and
                0091-3286/2013/$25.00 © 2013 SPIE                                                 outside the rhombus frame.

                Optical Engineering                                                        020502-1                                         February 2013/Vol. 52(2)

Downloaded From: https://www.spiedigitallibrary.org/journals/Optical-Engineering on 26 Jan 2021
Terms of Use: https://www.spiedigitallibrary.org/terms-of-use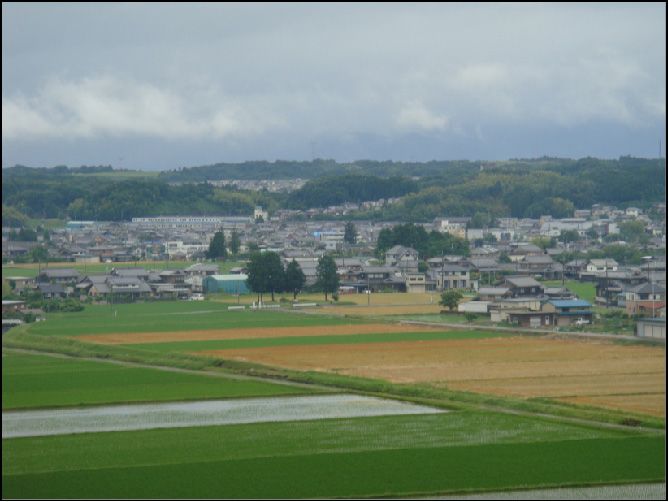
OE Letters

                                             (a)                                                  (b)                 tree canopies

                                                                                                                  80 m

                                                                                                                    weed s
                                                                                                                          pecies

                Fig. 1 The photographed site in Shiga prefecture, Japan (a). The area surrounded by the red rhombus frame (b) was used for preparation of the
                mean ð3×Þ SD binary image layers. The area outside of the rhombus frame was also used to find the most target rice canopy-specific color
                components.

                Fig. 2 Binary image layers representing pixels with (intensity) values between the mean ð3×Þ SD in the rhombus frame [Fig. 1(b)] for each color
                component. The percentages indicate those of the black colored pixels inside and outside the rhombus frame, respectively. The range indicates the
                mean ð3×Þ SD.

                Optical Engineering                                                        020502-2                                    February 2013/Vol. 52(2)

Downloaded From: https://www.spiedigitallibrary.org/journals/Optical-Engineering on 26 Jan 2021
Terms of Use: https://www.spiedigitallibrary.org/terms-of-use
OE Letters
Pixels in the range (%) outside of the rhombus frame 0.25
(Fig. 1b) / pixels in the range (%) inside of the farme
Symbols R G B C M Y K L* a* b*
while that outside was 0.04%. Thus, the ratio
11×SD
SD (0.04∕27 ¼ 0.0015) dropped from 0.027 (2∕72, Fig. 2)
0.20 33×SD
SD for Y 1SD as the best target canopy-specific value among
the single binary image layers (Figs. 2, 3). Thus, the target
rice canopy specificity defined in Fig. 3 increased more than
0.15 10-fold by overlapping the binary image layers chosen
in Fig. 3.
The visually perceivable different distribution patterns of
0.10
the black-colored pixels among the binary image layers of
the color components (Fig. 2) are related to the absence
0.05
of correlation among the (intensity) axes of the color com-
ponents, R, G, B, C, M, Y, a, and b.4,7 In this study, the
absence clearly favored the discrimination of the rice canopy.
0.00 The similarity among the binary image layers of G, K, and
0 50 100
Pixels in the range (%) inside of the frame
L, which have significant correlations among the intensity
axes,8 evidences the advantage of the absence of correlation.
Fig. 3 Target rice canopy specificity of the mean ð3×Þ SD ranges for A possible future development of the current method is to
the color components. The broken line was used as the threshold to involve the reflectance of infrared light and hyperspectral im-
choose the most target canopy-specific color components. aging for preparation of binary image layers. This will
increase the number of binary image layers available in
this method and will thus maximize the chances to discrimi-
nate the target crop canopy from weeds and other objects that
are common in actual agricultural fields.
4 Conclusions
The current method quite successfully discriminated the rice
canopy from a large variety of greenish weed and tree can-
opies that generate a great diversity of color in the photo-
The binary image layers merged Pixels with luminosity < 200
graphed scene. Overlapping and merging the binary image
layers resulted in a marked improvement of the target canopy
specificity to 0.0015 from 0.027 for the Y1SD binary image
layer, which was the best among all binary image layers, sup-
ported by the absence of correlation among the (intensity)
axes of the color components, R, G, B, C, M, Y, a, and
b. The method is thus expected to aid in agricultural
field management as photographs of the crop canopies
can be used to confirm normal growth and/or detect abnor-
malities in leaf color. The current method is, therefore, worth
Pixels with luminosity < 150 Pixels with luminosity < 100 considering, developing, and improving.
Fig. 4 The grayscale image generated by merging the selected rice
canopy-specific binary image layers (left top) according to the criterion References
adopted in Fig. 3. The most target canopy-likely pixels were revealed 1. R. Doi, “Quantification of leaf greenness and leaf spectral profile in
by identifying the pixels with smaller luminosity values, which were plant diagnosis using an optical scanner,” Cienc. Agrotec. 36(3),
therefore darker, than 200, 150, and 100. 309–317 (2012).
2. K. R. Thorp and L. F. Tian, “A review on remote sensing of weeds in
agriculture,” Precis. Agric. 5(5), 477–508 (2004).
Figure 3 shows the target rice canopy specificity of the 3. L. Zheng, D. Shi, and J. Zhang, “Segmentation of green vegetation of
crop canopy images based on mean shift and Fisher linear discriminant,”
binary image layers in Fig. 2. According to the relationship Pattern Recogn. Lett. 31(9), 920–925 (2010).
between percentages of black-colored pixels inside and out- 4. R. Doi, “Simple luminosity normalization of greenness, yellowness and
redness/greenness for comparison of leaf spectral profiles in multi-tem-
side of the rhombus frame in Fig. 2, the Y 1SD layer was the porally acquired remote sensing images,” J. Biosci. 37(4), 723–730
most target canopy-specific. By setting a target canopy- (2012).
specificity threshold (Fig. 3), 13 binary image layers were 5. Adobe Systems, Adobe Photoshop 7.0 Classroom in a Book, Adobe
Press Inc., San Jose, CA (2002).
overlapped and merged to find the most target rice can- 6. R. Doi et al., “Semiquantitative color profiling of soils over a land deg-
opy-likely pixels (Fig. 4). The most target canopy-likely pix- radation gradient in Sakaerat, Thailand,” Environ. Monit. Assess.
els were distributed in the area of the rhombus frame while 170(1–4), 301–309 (2010).
7. D. J. Hayes and S. A. Sader, “Comparison of change-detection tech-
the second-most target-likely pixels were mainly distributed niques for monitoring tropical forest clearing and vegetation regrowth
in the spaces of a few other paddy fields. In the merged in a time series,” Photogramm. Eng. Rem. Sens. 67(9), 1067–1075
(2001).
image (Fig. 4), the percentage of the darkest pixels 8. K. Kirk et al., “Estimation of leaf area index in cereal crops using red
(luminosity ¼ 0) inside of the rhombus frame was 27% green images,” Biosystems. Eng. 104(3), 308–317 (2009).
Optical Engineering 020502-3 February 2013/Vol. 52(2)
Downloaded From: https://www.spiedigitallibrary.org/journals/Optical-Engineering on 26 Jan 2021
Terms of Use: https://www.spiedigitallibrary.org/terms-of-useYou can also read