"TUTT-Induced Hail Event in Suriname" - WPC Training Tropical Desk Presentation Dwight Samuel Suriname Weather Service 24 July 2015
←
→
Page content transcription
If your browser does not render page correctly, please read the page content below
WPC Training Tropical Desk Presentation
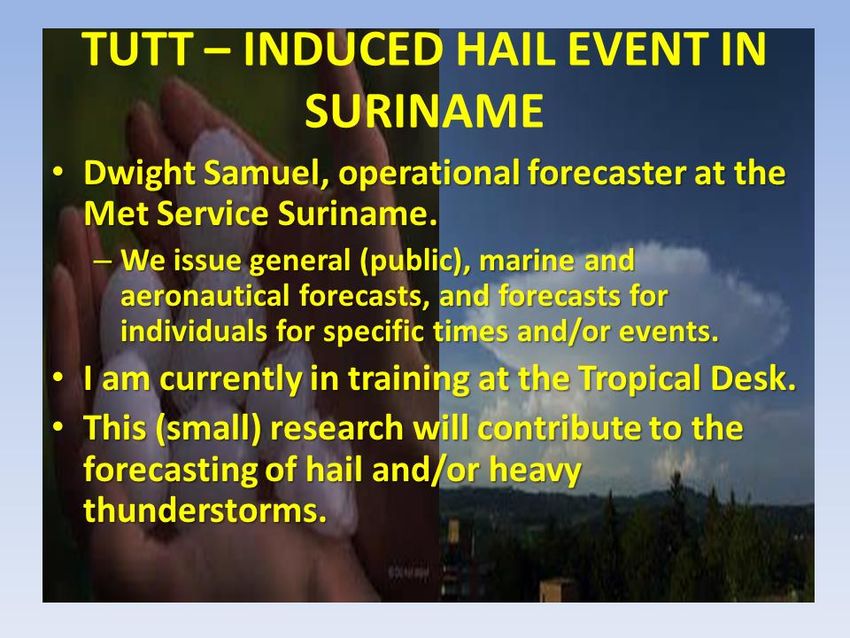
“TUTT-Induced Hail Event in Suriname”
Dwight Samuel
Suriname Weather Service
24 July 2015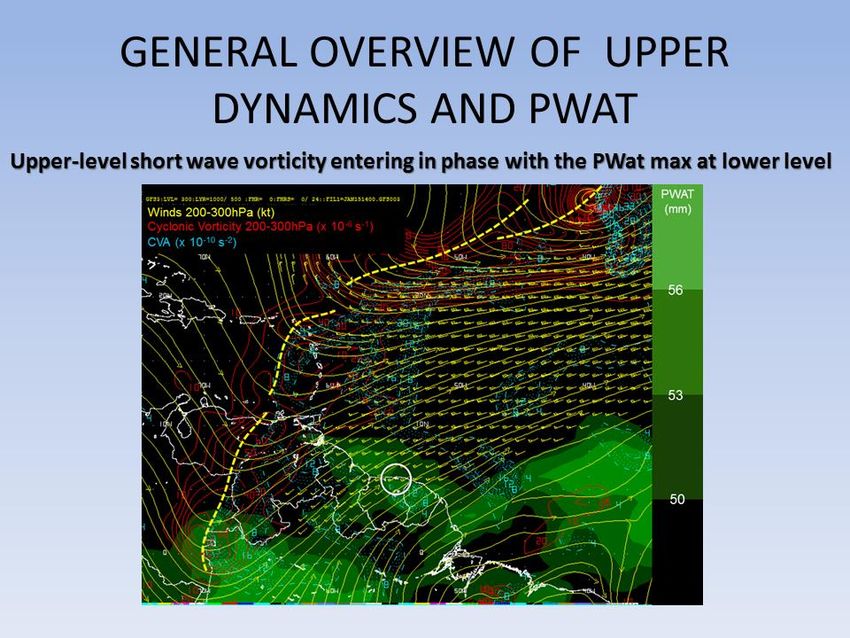
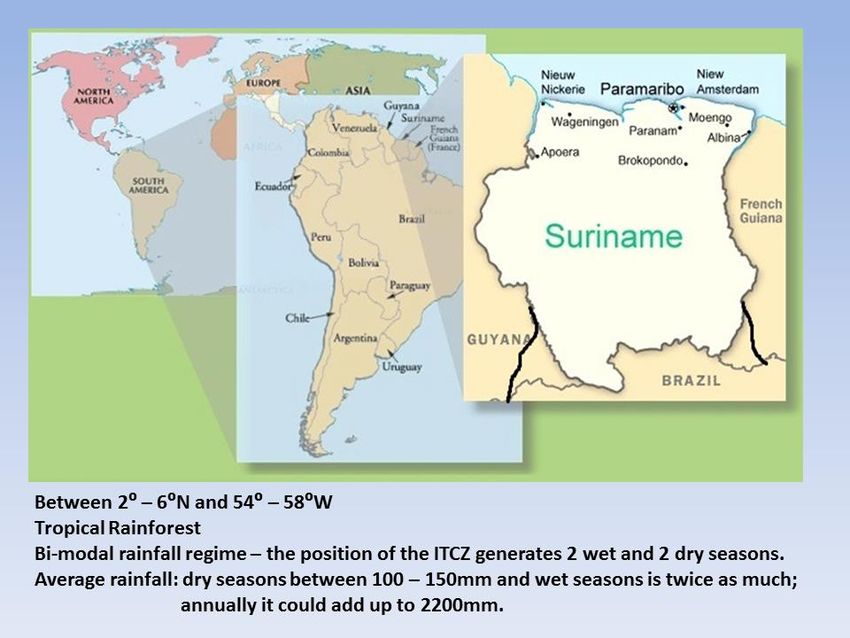
Suriname is located in the northeaster tier of Tropical South America. The
national language is Dutch, but everybody speaks Surinamese. As said; we
are a Caribbean country in South America. Positioned between 2⁰ – 6⁰N and
54⁰ – 57⁰W. Suriname has a small coastal plain, where almost the whole
population lives, some savannah and the rest (south 0f 4⁰N) is tropical
rainforest. This is where you’ll find some mountain ranges, with the highest
top at 1280m.

The rainfall regime in Suriname is bimodal. This means that it has two wet
and dry seasons, which are modulated by the position of the ITCZ. This is well
defined in the northern part of Suriname, while in the southern tier
precipitation is organized for the most part in just two seasons: a dry and a
wet one. Annual rainfall is often in the order of 2200mm/year.
Hail in Suriname is a very rare phenomenon. Until today there are only three
identified cases. One occurred in the 1970’s, one in September 2013 and
another in January 2014. From these cases, only the latest one has sufficient
reports to attain reliability. Confidence increased further more once the setup
of the atmosphere was identified, as a large TUTT was present just to the
north of the region with short wave vortices revolving in its southern
periphery. The hail observed was smaller than dimes, so it did not really have
a strong impact.

The only impacts were those associated with the gusty winds. Gusty winds are
a feature we see with every thunderstorm the last few years, ranging from 20
– 35kts. But the strongest one dates from a few weeks back, peaking around
40kts.

The case study focuses on the 16 January 2014 hail event that occurred at
23Z or right after sunset. The method of analysis considers different
parameters relevant to the prediction of hail such as stability indices, vertical
wind shear, freezing level height, 0°C wet bulb temperature near the 700 hPa
level, and an evaluation of the dynamics favorable for strong updrafts.

The data and tools used consist of GFS model runs analyzed using Wingridds,
French Guiana soundings, CPTEC infrared-4 and water vapor satellite images
and METAR observations.

The conditions that favor hail formation require the presence of a
thunderstorm cool enough temperatures that favor accretion of supercooled
water droplets into a growing ice particle, and with updrafts in the supercooled
water layer sufficiently strong to increase the duration of the growing ice
particle inside the supercooled water layer by counteracting the effects of
gravity. The droplet grows bigger and once it becomes too heavy for the
updraft to maintain it aloft it falls out of the cloud.

Cool mid-tropospheric temperatures can be assessed by identifying the height
of the freezing level. A large part of the cloud below 0°C tends to favor the
formation of hail. Strong updrafts are also very favorable. These can be
evaluated by looking into mid-level instability. For example 700-500 hPa steep
lapse rates favor strong updrafts at mid-levels. Large scale dynamics that
favor deep-layer ascent are also favorable. For example, an upper divergent
pattern ahead/in the periphery of a trough combined with a low-level
convergent pattern such as a front, low-level trough, etc., can favor deep-
layer ascent. Enhanced vertical shear also favors strong updrafts. High
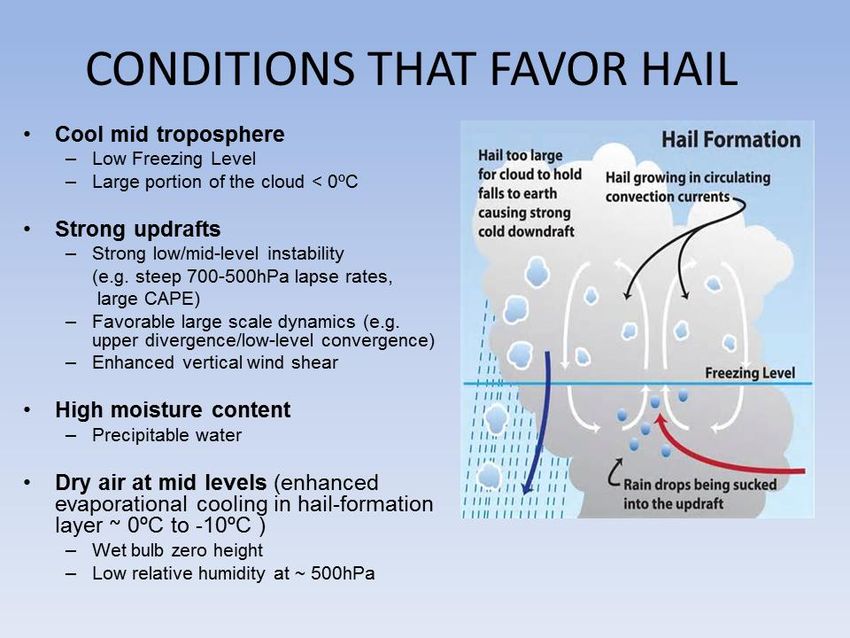
moisture content, especially at low-levels, is also important. Precipitable water
is an important variable to assess this. Finally, evaporational cooling in the
hail-formation layer/near the freezing level favors hail formation as it
enhances cooling. Evaporational cooling is enhanced when some dry air is
present in the layer. Some parameters used are wet bulb zero height close to
700 hPa, and low-relative humidity at mid-levels.

The satellite animation shows a band of convection positioned over
northeastern Suriname. The band does not look very impressive but cold cloud
tops were definitely present.


This is the sounding from French Guiana 12 hours before the event. The
sounding station is in Rochambeau, French Guiana, approximately 320km east
of Paramaribo. Considering the low-level flow, this is often upstream from
Suriname. We were interested in confirming the height of the freezing level,
looking for shear in the supercooled water layer and revising the values of
stability indices. Note that when analyzing soundings one must be careful
when nearly deep-layer moist adiabatic saturated profiles are present, as they
can represent the radiosonde going through a cloud. Also one needs to keep
in mind the location of the sounding with respect to the station of analysis,
since in some levels it will fall upstream from the analysis location but in others
it will fall downstream.

This particular sounding shows the freezing level at about 580 hPa, shows the
presence of directional and speed shear in the supercooled water layer, and
shows relatively unstable values for different indices. It also shows large
precipitable water values, with numbers exceeding 63mm.
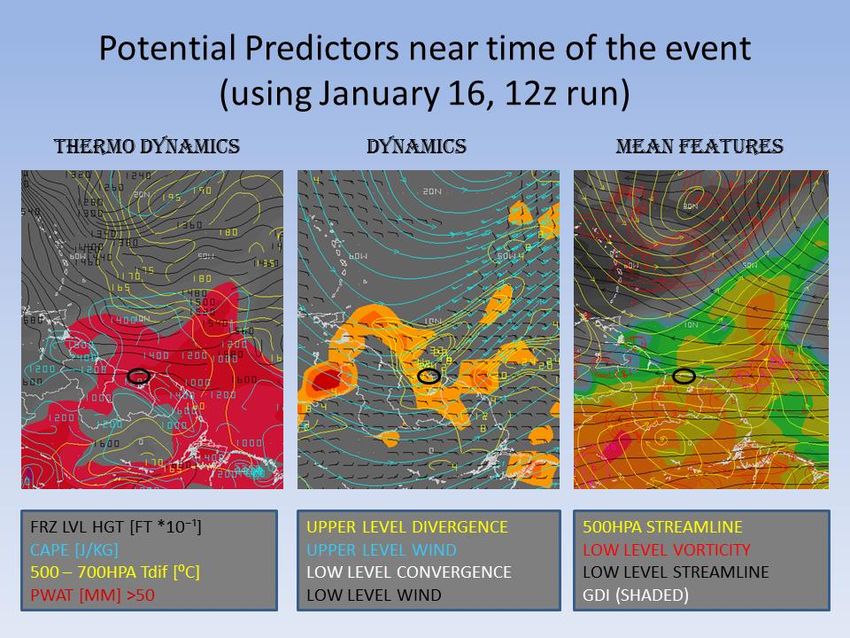
Different potential predictors, associated with the forecasting of hail, are
plotted near the time of the event. The thermodynamic properties are
presented on the left panel. Precipitable water was very high with values
exceeding 55mm in association with the Inter-tropical Convergence Zone and
a perturbation in the trades arriving from the east. CAPE was also plotted to
evaluate instability, and shows values exceeding 1400 J/Kg. The freezing level
height was plotted in black and was at approximately 16000ft, not necessarily
low for the area. Finally 500-700 temperature differences were plotted to
assess mid-level instability and largest values were present to the north in
association with the TUTT. Other parameters such as wet bulb zero height
(usually near 700 hPa during hail events) was also too high and was not
plotted. The fact that the thermodynamic parameters showed marginal values
for the generation of hail suggests that the dynamics were particularly
important for this event.

Time sections at a point in northern Suriname are presented. The period when
hail occurred is indicated with ovals. The sections show the increase in
instability below 600 hPa after 18Z as the perturbation in the trades arrived.
The perturbation shows as a change in the low-level winds from
easterly/southeasterly at 15Z to northeasterly/ easterly by 21Z. Ascent was
enhanced above 400 hPa in association with the upper trough.

The GFS model suggests that a short wave trough entered in phase with the
arrival of the perturbation in the trades and precipitable water maxima.

An EMSEMBLE analysis was made by comparing the contours of a few variable
thresholds using different GFS simulations. This is a way to evaluate the
confidence on the model solution.
Two moisture parameters are compared using the ENSEMBLE technique. The
contour of precipitable water=55mm (left) and the relative humidity500=50%.
Blue indicates older simulations and yellow the most recent ones. The
background shading represents the ensemble average. The model was
consistent with the different solutions for both quantities analyzed.
Cyclonic vorticity and upper divergence are compared using a similar
ensemble technique near the peak of the event. These figure evidence more
variability on the solution of these dynamic variables with respect to the
moisture parameters.
Appendix

Three macros/scripts were developed for the software Wingridds. These are
SU01.CMD, SU02.CMD, and SU03.CMD. These should be placed in the folder
C:/WINGRIDDS/MACROS/. Two color tables were also generated. These are
CFC6.DAT and CFC7.DAT. The color tables should be placed in the folder
C:/WINGRIDDS/USER/. Winds and divergence for the lower troposphere (925-
700hPa) and the upper troposphere (200-400hPa) were calculated on the ALIAS.USR
file. This file is also in the C:/WINGRIDDS/USER/ folder. All files must be in their
respective places for the macros/scripts to work.

The following text needs to be included in the ALIAS.USR file.

@@@@@@@@@@@@@@@
@@@WINDS AND DIVERGENCE IN THE 925-700 HPA LAYER - START
@@@@@@@@@@@@@@@
LLC1=SMTH SMLC 1+6 DVRG WIND 700
LLC2=SMTH SMLC 1+6 DVRG WIND 925
LLC3=SMTH SMLC 1+6 DVRG WIND 850
LLC0=SDVC 3 SSUM LLC1 SSUM LLC2 LLC3
LLW0=VDVC 3 VSUM BKNT 700 VSUM BKNT 925 BKNT 850
@@@@@@@@@@@@@@@
@@@WINDS AND DIVERGENCE IN THE 925-700 HPA LAYER - END
@@@@@@@@@@@@@@@

@@@@@@@@@@@@@@@
@@@WINDS AND DIVERGENCE IN THE 300-200 HPA LAYER - START
@@@@@@@@@@@@@@@
ULD1=SMTH SMLC 1+6 DVRG WIND 300
ULD2=SMTH SMLC 1+6 DVRG WIND 250
ULD3=SMTH SMLC 1+6 DVRG WIND 200
ULD0=SDVC 3 SSUM ULD1 SSUM ULD2 ULD3
ULW0=VDVC 3 VSUM BKNT 300 VSUM BKNT 250 BKNT 200
@@@@@@@@@@@@@@@
@@@WINDS AND DIVERGENCE IN THE 300-200 HPA LAYER - END
@@@@@@@@@@@@@@@
The macros/scripts created follow.

(1) SU01.CMD plots the convergence of 925-700 hPa winds and the divergence of
200-300 hPa winds plus the winds. The code follows:
LOOP
CTFC CFC7 LLC0
LLW0 CLRG GRTN 10/
ULD0 GRTN 1 CIN4 CLR2/
STRM ULW0 CLR1 GRTN 40/
ULW0 CLR1 GRTN 50/
TXT2 **LOW LEVEL CONVERGENCE (SHADED) AND UPPER DIVERGENCE*******
TXT3 **REQUIRES COLOR TABLE CFC7 AND CALCULATION OF LLW0 and ULW0**
TXT4 **IN THE ALIAS.USR FILE**
ENDL

(2) SU02.CMD plots the GDI, precipitable water, 925-700 hPa winds, 500 hPa winds
and 850-700 hPa vorticity, often the level of better defined vorticity in trade wind
waves. The code follows:
LOOP
CTFC CFCB GDIF
STRM LLW0 CLRG/
SMLC 1+6 SAVR RVRT WIND 850 RVRT WIND 700 GRTN 0.1 CIN3 CLR6/
SMLC 10 PWAT GRTN 55 CIN1 CLR3/
STRM WIND 500 CLR2/
TXT2 **GDI, PWAT, 925-700 WINDS(LLW0), 500 WINDS *******
TXT3 **850-700 POSITIVE RELATIVE VORTICITY **
TXT4 **REQUIRES ALIAS.USR FOR THE CALCULATION OF LLW0 **
ENDL

(3) SU03.CMD plots some parameters used in the prediction of hail:
LOOP
CTFC CFC6 SMLC 10 PWAT
SMTH SMLC 10 SDIF TEMP 700 TEMP 500 grtn 155 cin5 CLR2/
SDVC 10 SMTH M2F= HGHT 0DEG lstn 1600 CI20 CLRG/
SMTH CAPE GRTN 1000 C200 CLR1/
TXT3 ***THERMODYNAMIC PREDICTORS FOR HAIL
TXT4 ***PWAT in mm (Water vapor)
TXT5 ***700-500 Temperature Difference (C)
TXT6 ***Freezing level height (ft)
TXT7 ***CAPE
ENDL
The color tables generated follow.

COLOR TABLE CFCB.DAT
!
!Configuration file for Contour Line-Fill/Color
!
!Color Mode - 1=MAX/MIN COLOR, 2=MULTI INTERPOLATION, 3=INDIVIDUAL
COLORS
!
3
!
!Number of Data Entries (ONLY 2 ALLOWED IN COLOR MODE 1)
!
21
!
!Number of Color Entries (ONLY 2 ALLOWED IN COLOR MODE 1)
!
21
!
!Min to Max Values
!
-26
-22
-18
-14
-10
-06

-03
00
03
07

11
15

20
25

30
35
40
45

50
60
70
!
!R-G-B Values (Top-min, Bottom-max)
!
035 035 035
040 040 040
045 045 045
060 060 060
065 065 065
070 070 070

090   090   090
095   095   095
100   100   100
105   105   105

090 120 125
070 125 140

025 150 050
035 160 040

150 150 015
150 140 010

190 100 006
190 085 009

205 020 055
195 010 032
150 000 080
*****************************************************
*****************************************************
************* END-OF-DATA ***********************
*****************************************************
*****************************************************
COLOR TABLE CFC6.DAT
!
!Configuration file for Contour Line-Fill/Color
!
!Color Mode - 1=MAX/MIN COLOR, 2=MULTI INTERPOLATION, 3=INDIVIDUAL
COLORS
!
3
!
!Number of Data Entries (ONLY 2 ALLOWED IN COLOR MODE 1)
!
6
!
!Number of Color Entries (ONLY 2 ALLOWED IN COLOR MODE 1)
!
6
!
!Min to Max Values
!
42
46
50
54
58
62
!
!R-G-B Values (Top-min, Bottom-max)
!
095 095 095
100 100 100
105 105 105
205 020 055
195 010 032
150 000 080
*****************************************************
*****************************************************
************* END-OF-DATA ***********************
*****************************************************
*****************************************************
COLOR TABLE CFC7.DAT
!
!Configuration file for Contour Line-Fill/Color
!
!Color Mode - 1=MAX/MIN COLOR, 2=MULTI INTERPOLATION, 3=INDIVIDUAL
COLORS
!
3
!
!Number of Data Entries (ONLY 2 ALLOWED IN COLOR MODE 1)
!
6
!
!Number of Color Entries (ONLY 2 ALLOWED IN COLOR MODE 1)
!
6
!
!Min to Max Values
!
-20
-15
-10
-5
-2
-1
!
!R-G-B Values (Top-min, Bottom-max)
!
100 000 000
150 000 000
200 000 000
250 100 000
250 150 000
100 100 100

*****************************************************
*****************************************************
************* END-OF-DATA ***********************
*****************************************************
*****************************************************
You can also read