ECOCONCRETE STUDENT COMPETITION 2021 - EcoConcrete calculation tool instruction - Last update: 05/28/2021 - American ...
←
→
Page content transcription
If your browser does not render page correctly, please read the page content below
ECOCONCRETE STUDENT COMPETITION 2021

       EcoConcrete calculation tool instruction

                Last update: 05/28/2021
Table of contents

1.    EcoConcrete Student Competition .................................................................................................... 1
            Introduction to LCA ................................................................................................................... 1
            Goal and scope definition ........................................................................................................... 1
            Life cycle inventory.................................................................................................................... 1
      1.3.1       Life cycle impact assessment method (TRACI v.2.1) ........................................................ 1
2.    EcoConcrete calculations tool user manual ...................................................................................... 2
            Description of sheets .................................................................................................................. 2
      2.1.1.      Cover page ......................................................................................................................... 2
      2.1.2.      Base-Case Scenario ........................................................................................................... 3
      2.1.3.      Alternative-case scenario.................................................................................................. 5
      2.1.4.      Summary ............................................................................................................................. 8
      2.1.5.      Database ............................................................................................................................. 9

List of figures
Figure 1. Overview of the cover page ....................................................................................................... 3
Figure 2 : Overview of the Base-Case Scenario sheet .............................................................................. 4
Figure 3 : Overview of the Transport inputs ............................................................................................. 5
Figure 4 : Overview of the Alternative-Case Scenario sheet .................................................................... 6
Figure 5 : Material production boundary .................................................................................................. 6
Figure 6 : Overview of the Production inputs ........................................................................................... 7
Figure 7 : Selecting the adequate mix of energy by region ...................................................................... 7
Figure 8 : Calculated potential environmental impacts ............................................................................ 8
Figure 9 : Overview of the Summary sheet .............................................................................................. 9
Figure 10 : Overview of the Database .................................................................................................... 10

List of tables
Table 1 : Impact categories and their definition ....................................................................................... 2

                                                                                                                                                         i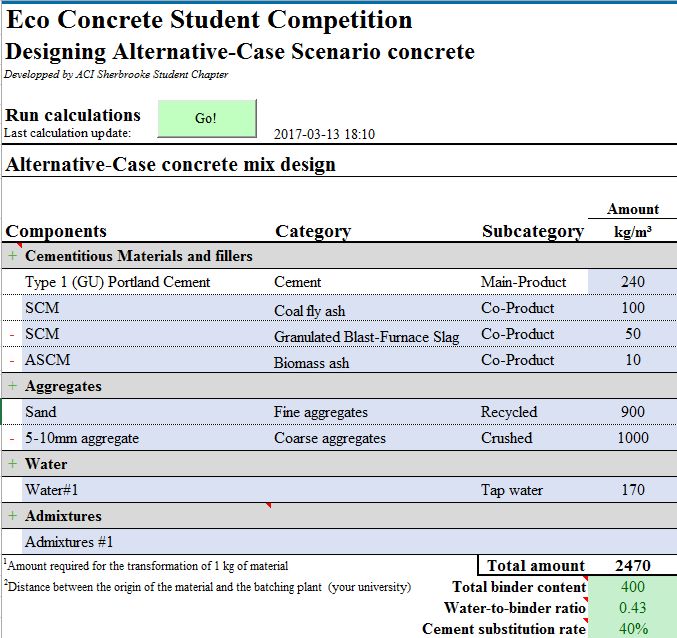
1. EcoConcrete Student Competition
      Introduction to LCA
In this competition, a simplified life cycle assessment (LCA) tool is used to assess the environmental
aspect of concrete mixtures. Generally, LCA helps to quantify, analyze, and compare environmental
impacts of different types of materials from raw material extraction to their end-of-life. LCA
methodology is generally divided into the following steps: 1) goal and scope definition; 2) Inventory
collection and analysis; 3) life cycle impact assessment, and 4) interpretation of the obtained results.
In the first phase (goal and scope definition), we define the aim of LCA, its intended audience, and its
application. In addition, the scope of study must be defined considering the function of the product, the
functional unit (quantification of the defined function), and system boundary (i.e. the processes are to be
included in the assessment). Following the goal and scope definition, all the environmental exchanges in
the system boundary are identified and quantified in the inventory analysis. The list of inventory will be
shortened to some environmental impact categories by assigning relevant substances to these categories
considering the magnitude and significance of their environmental impacts. Finally, the significant issues
based on the obtained results are identified and the completeness of the results will be evaluated.

      Goal and scope definition
In order to follow the current orientation of concrete industry, this student competition aims to promote
the idea of environmental performance in concrete mix design as an important aspect of sustainability.
Teams thus have the mission to develop an innovative concrete mixture, which has the lowest
environmental impacts while maintaining or improving the durability performance. To achieve this goal,
teams are encouraged to seek out and use local sources of concrete materials such as supplementary
cementitious materials (SCMs) with reasonable environmental impacts.
The functional unit will be “producing one cubic meter of concrete mixture incorporating
environmentally friendly components located in marine spray zone in Tampa, Florida”. Hence, the
system boundary of this environmental assessment is regarded as raw material extraction to final
production of the concrete mixture; from cradle to gate. Finally, the environmental impacts of the
environmentally friendly mixture (Alternative-Case Scenario) are compared to an ordinary concrete
mixture (Base-Case Scenario) (i.e., a concrete produced with ordinary portland cement).

      Life cycle inventory
All the environmental inputs and outputs come from the supply chain of concrete materials are quantified
in this stage. To simplify the calculation of environmental performance in the tool, the inventory results
of materials have been already calculated, characterized and assigned to their corresponding impact
categories.
     1.3.1 Life cycle impact assessment method (TRACI v.2.1)
 The Tool for the Reduction and Assessment of Chemical and other environmental Impacts (TRACI) 2.1
is developed by the US EPA to conduct impact assessment with the best applicable methodologies. This

                                                                                                         1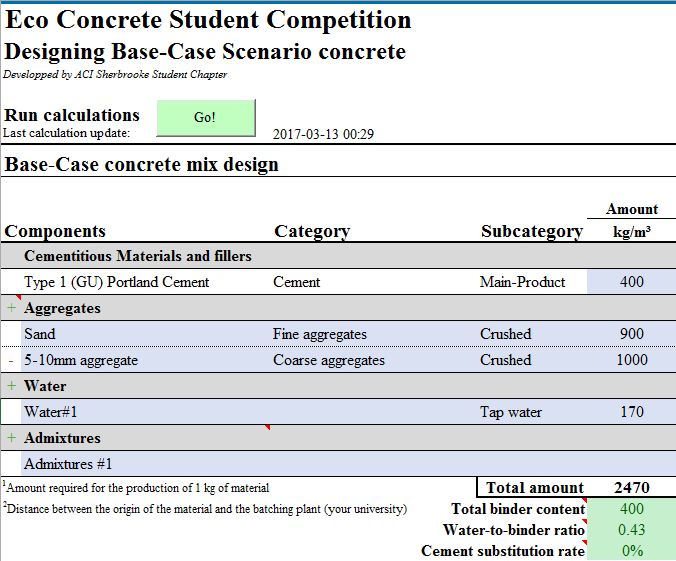
method they provide a North American context for the mandatory category indicators. In the case of the
EcoConcrete Student Competition, five most relevant categories were selected as presented in Table 1.
                                  Table 1 : Impact categories and their definition

 Category                     Unit                 Definition
 Climate change               kg CO2 eq            Global warming is an average increase in the temperature of
                                                   the atmosphere near the Earth’s surface and in the troposphere,
                                                   which can contribute to changes in global climate patterns.
                                                   Global warming can occur from a variety of causes, both
                                                   natural and human-induced. In common usage, “global
                                                   warming” often refers to the warming that can occur as a result
                                                   of increased emissions of greenhouse gasses from human
                                                   activities.
 Carcinogenic                 CTUh                 This category is expressed in comparative toxic units (CTUh),
                                                   providing the estimated increase in morbidity in the total
                                                   human population per unit mass of a chemical emitted.
 Ozone depletion              kg CFC-11 eq         Ozone within the stratosphere provides protection from
                                                   radiation, which can lead to increased frequency of skin
                                                   diseases and cataracts in the human populations.
 Ecotoxicity                  CTUe                 Ecotoxicity involves the effects of toxic chemicals on
                                                   biological organisms, especially at the population, community,
                                                   ecosystem, and biosphere levels.
 Resource fuel                MJ surplus           Resource depletion categories addressed within TRACI be
 depletion                                         fossil fuel use, land use, and water use.
*Notice that no conclusions can be drawn about the relative importance of the scores when compared across impact categories

2. EcoConcrete calculations tool user manual
This tool is a spreadsheet platform provided to estimate and compare the environmental impacts of the
innovative and the ordinary concrete in the same geographical region. In this section, a brief description
of the tool is provided. A systematic instruction of the tool is given in the next section.

       Description of sheets
The tool consists of five sheets: cover page, base-case scenario, alternative-case scenario, summary, and
database. The details of each sheet are presented in following sections. In addition, the procedure of
modeling the environmental aspect of the mixtures are described, accordingly.
2.1.1. Cover page
All the information about team members and specimens’ codes is to be found in this sheet.
The procedure of using the tool starts from the cover page, where the information of participants should
be stated. The blue cells in this sheet (see Figure 1) should be filled with appropriate information.

                                                                                                                              2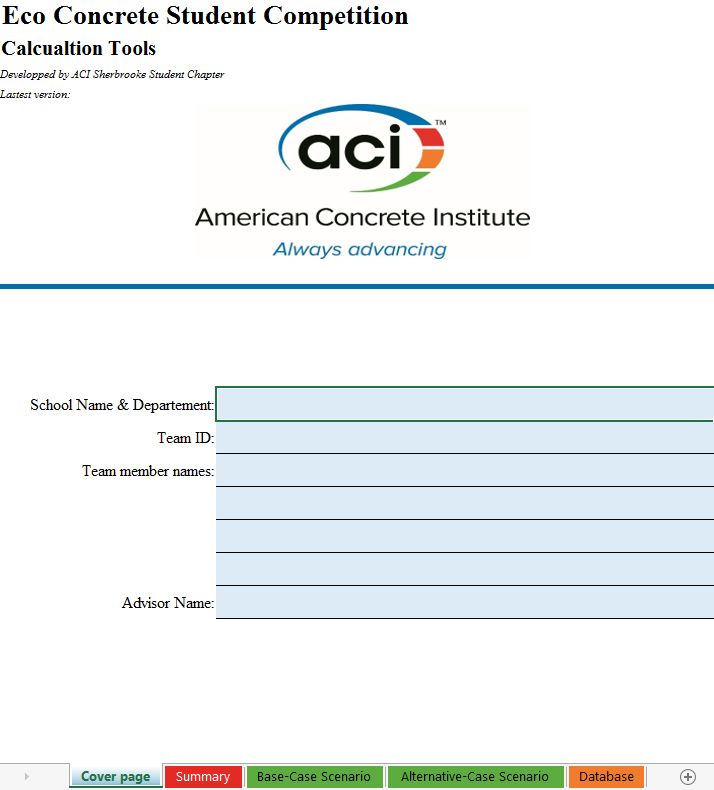
Figure 1. Overview of the cover page

2.1.2. Base-Case Scenario
The Base-Case Scenario is modeled in the Base-Case Scenario sheet of the EcoConcrete Calculations
tool. This scenario consists of an ordinary concrete mixture made with Type I (GU) Portland cement,
fine and crushed coarse aggregates and water. Its binder content, water-to-binder ratio and cement
substitution rate shall equal 0.40 and 0%, respectively (See Figure 2).

                                                                                                 3
Figure 2 : Overview of the Base-Case Scenario sheet
In this sheet, the user must follow this procedure for defining the ordinary concrete information:
− Select the type of materials used for the ordinary concrete mixture (the mixture containing only
Portland cement as a binder). For aggregates, you can select the type of material (crushed, natural,
or recycled) and for water, it is possible to select tap or recycled water.
− Enter the mass of materials including portland cement, fine and coarse aggregates, water, and
possibly chemical admixture for producing one cubic meter concrete.
− Check concrete unit weight, binder content, and water-to-binder ratio to make sure the values
entered in the previous step are entered correctly (See Figure 2).
− Enter the transportation distance between your university (i.e. the batching plant) and the mine,
cement plant, or the factory, where the materials are processed. It is possible to select different
types of transportation (by road, rail, and water) as shown in Figure 3.
− After entering all the information, click on “Go!” and wait to see the message box “The
environmental scores of your Base-Case Scenario has been successfully computed and saved in
the Summary sheet".
4Figure 3 : Overview of the Transport inputs
2.1.3. Alternative-case scenario
The information about the environmentally friendly mixtures designed by the user must be entered here.
The Portland cement can be partially replaced by supplementary cementitious materials according to the
rule of competition. The water-to-binder ratio must be kept at 0.40, similar to the base-case scenario.
This sheet must be filled out, accordingly:
− Select the type of materials you have used for producing your alternative mixture. It can be a
recycled material, a co-product, or a single product of the corresponding process.
− Enter the mass of materials including Portland cement and its alternative binder(s), fine and
coarse aggregates, water, and possibly chemical admixture for producing one cubic meter
concrete. It should be noted that the user can use more than one type of cement alternative binder
and aggregates by clicking on the “green cross” on the right gray rows.
− In the case of selecting “co-product” or “recycled material” for a material, enter the amount of
electricity and heating energy used to produce 1 kg of the material.
− Check concrete unit weight, binder content, water-to-binder ratio, and cement substitution rates
to make sure the values entered in the previous step are entered correctly (See Figure 4).
− Enter the transportation distance between your university (i.e. the batching plant) and the mine,
cement plant, or the factory, where the materials are processed. It should be noted that selecting
different types of transportation (i.e. by road, rail, and water) is possible (See Figure 3).
− After entering all the information, click on “Go!” at the top-left of the sheet and wait to see the
message box “The environmental scores of your Alternative-Case Scenario have been
successfully computed and saved in the Summary sheet".
5Figure 4 : Overview of the Alternative-Case Scenario sheet
Note that if teams have used the materials that do not have a pre-set environmental impact (e.g. recycled
aggregates or alternative supplementary cementitious materials (ASCM)), the corresponding
environmental impacts must be calculated manually according to the following procedure:
− Select the type of materials you have used. It can be a recycled material, a co-product, or a single
product of the corresponding process.
− The environmental modeling of materials should be consistent with the processes described in
Figure 5 in including the energy consumed for treatment processes (e.g. recycling equipment)
and transportation to university.
Figure 5 : Material production boundary
6− The electricity and heating energy for materials processing should be exactly calculated or
extracted from similar reports (In terms of kWh or MJ per kilogram of material).
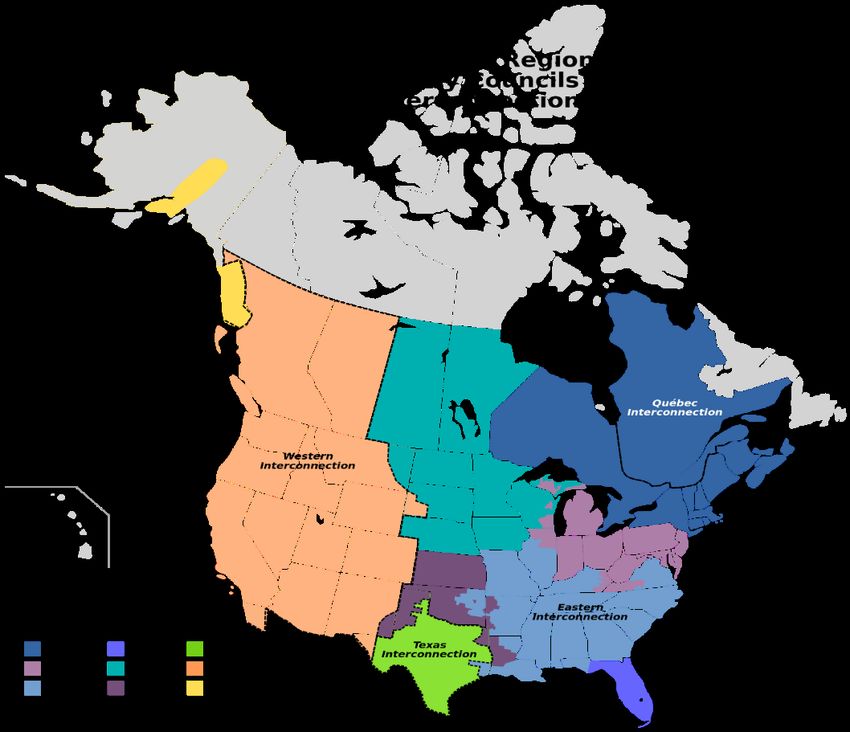
− As shown in Figure 6, the amount of energy must be entered in corresponding cells. Select the
region where the energy sources are produced. For the U.S. and Canada, the regions are divided
into nine areas according to Figure 7. Other countries can use “Rest of the world” between the
options as shown in Figure 6.
Figure 6 : Overview of the Production inputs
Figure 7 : Selecting the adequate mix of energy by region
7− Enter the transportation distance between your university (i.e. the batching plant) and the mine,
cement plant, or the factory, where the materials are processed. It should be noted that selecting
different types of transportation (i.e. by road, rail, and water) is possible (See Figure 3).
− After entering all the information, click on “Go!” at the top-left of the sheet and wait to see the
message box “The environmental scores of your Alternative-Case Scenario have been
successfully computed and saved in the Summary sheet". After entering the amount of process
energy and transportation and clicking on “Go!” you can see the corresponding environmental
impacts of the materials at the right of the sheet (see Figure 8).
It should be noted that this procedure must be precisely described in the poster and report and appropriate
references must be placed in the text.
Figure 8 : Calculated potential environmental impacts
2.1.4. Summary
The Summary sheet presents the overview of all the characteristics of the Base and Alternative-Case
scenario as shown in Figure 9. The comparative environmental results of base-case and alternative-case
will be shown in this section. The users must enter the average compressive strength and electrical
resistivity of their mixtures, which have already been measured at their university, in this section.
8Figure 9 : Overview of the Summary sheet
2.1.5. Database
All the preset environmental impacts, such as the amount of emissions and consumption in material
production, electricity and heat generations, and transportation can be observed in this sheet (Figure 10).
This sheet in placed for the information of the team to enable them to compare the environmental impacts
of different processes for achieving the most environmentally friendly alternatives.
9Figure 10 : Overview of the Database
10You can also read