Do Private Transport Services Complement or Compete against Public Transit? Evidence from the Commuter Vans in Eastern Queens, New York - MDPI
←
→
Page content transcription
If your browser does not render page correctly, please read the page content below
Article
Do Private Transport Services Complement or
Compete against Public Transit? Evidence from the
Commuter Vans in Eastern Queens, New York
Catherine Musili 1 and Deborah Salon 2, *
 1    School of Sustainability, Arizona State University, Tempe, AZ 85281, USA; Catherine.Musili@asu.edu
 2    School of Geographical Sciences and Urban Planning, Arizona State University, Tempe, AZ 85287, USA
 *    Correspondence: Deborah.Salon@asu.edu

 Received: 31 December 2018; Accepted: 13 February 2019; Published: 22 February 2019

 Abstract: Do private transport services complement or compete against public transit? As transit
 agencies scramble to adjust to the new transport landscape of mobility services, this has become an
 important question. This study focuses on New York’s commuter vans (also known as “dollar vans”),
 private vans that have operated alongside public transit for decades. We use original survey and
 observational data collected in the summer of 2016 to document basic ridership characteristics and
 to provide insight into whether the commuter vans complement or compete against city buses.
 Commuter van ridership in Eastern Queens is high; it is roughly equivalent to city bus ridership
 on parallel routes at approximately 55,000 per day. Further, more than 60% of van riders surveyed
 would have had a free trip on a city bus, through either a transit pass or transfer. Time savings was
 an important motivation for these riders to pay extra for the vans; the vans are faster than city buses,
 and van wait times are shorter. These results suggest that New York’s commuter vans complement
 public transit by serving as a feeder system. This conclusion, however, is highly context-dependent.
 As private transport services proliferate, continued research is needed to ascertain their relationships
 with public transit.

 Keywords: paratransit; dollar vans; jitneys; informal transport; New York City; microtransit;
 ride hailing

1. Introduction
     New York’s commuter vans—also known as “dollar vans” or jitneys—carry approximately
120,000 passengers each day [1]. This is comparable to the total transit ridership in other US cities
such as Phoenix, AZ [2] and Minneapolis/St. Paul, MN [3]. Despite its size, little is known about the
commuter van industry. Because these vans are privately owned and operated, data that is commonly
available for transit systems is absent. This study is one of the first to shed light on New York’s
“shadow transit” system, building on the work of King and Goldwyn [1], King [4], Reiss and Lavey [5],
and Goldwyn [6].
     Commuter vans occupy a market space in between taxis/ride hailing services and formal public
transit. They are faster than city buses and offer some of the flexibility, comfort, and convenience
of neighborhood taxis for an affordable US $2 fare. They have an intermediate capacity of
13–20 passengers and follow a semi-regular route. The vans pick up passengers along their route
like city buses, but are often street-hailed like taxis. They can deviate from the route at the driver’s
discretion, but can only legally serve a predetermined neighborhood area.
     With these features, commuter vans can complement public transit by serving as a feeder
system for the buses and subways that transport passengers out of the van-served neighborhoods.

Urban Sci. 2019, 3, 24; doi:10.3390/urbansci3010024                          www.mdpi.com/journal/urbansci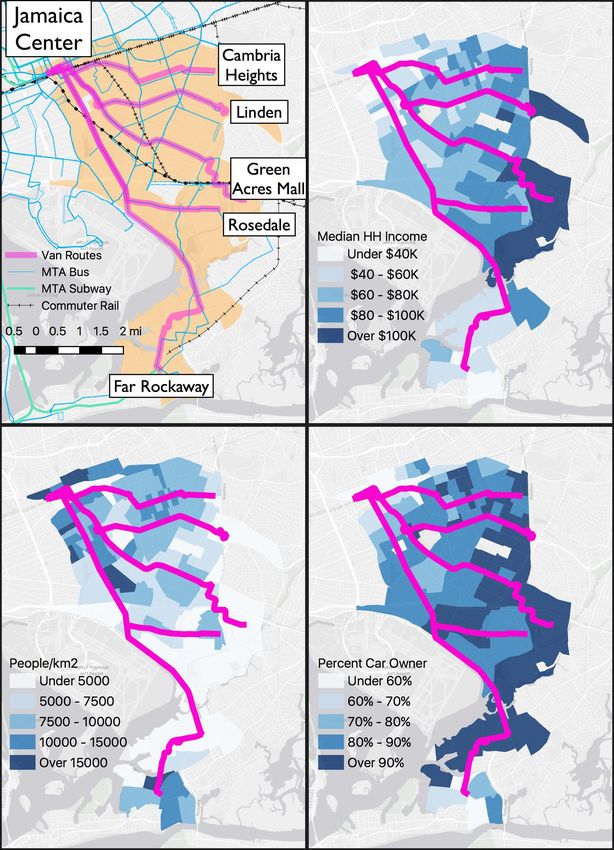
Urban Sci. 2019, 3, 24                                                                             2 of 18

However, they can also directly compete against local city buses. Some researchers have argued that
while services such as ride hailing and commuter vans threaten public transit, they are also key to
its future success [7]. These private services help to smooth transportation demand shocks caused
by temporary transit disruptions such as closing of subway stations [8], extreme weather conditions,
and unexpected natural disasters as in the case of New York City’s Hurricane Sandy [9].
      The perception of the role played by services such as commuter vans is at the core of policy
decisions surrounding these services. For instance, the New Jersey Interstate Commerce Commission
views jitneys as contributing to overall increased mobility even though they are in direct competition
with New Jersey transit [10], hence it implemented policies that encouraged new entries into the market
and relaxed jitney restrictions [10]. Stricter policies like those that govern New York commuter vans,
such as levying fines for operation of commuter vans along Metropolitan Transportation Authority
(MTA) bus routes, are the result of the perception that commuter vans compete against the city’s
MTA transit.
      This research documents travel and sociodemographic characteristics of commuter van riders
in Eastern Queens and uses these data to shed light on the role that these vans play in relation to the
formal MTA transit system in the study area. In particular, we ask four research questions:

1.     How many people ride commuter vans in Eastern Queens?
2.     What are the socioeconomic characteristics of commuter van riders?
3.     Why do riders choose the commuter vans over public buses?
4.     Do vans complement or compete against MTA transit service?

The first two questions are motivated by the need to understand both the extent of commuter van
services and the population they serve. The third question is motivated by a need to understand how
commuter van and MTA transit services compare from the van riders’ point of view. Answering the last
question is important for making evidence-based commuter van policy going forward. Our answers
to these questions are drawn from original on-board surveys and a tally of commuter van riders in
Eastern Queens, conducted in the summer of 2016.
     This research is especially timely today, as ride hailing service providers such as Uber and Lyft
are moving into the collective transport business. For instance, uberPOOL and Lyft Line provide
service to up to 4 or 6 passengers at a time, and Uber’s Express POOL, Lyft Shuttle, and services
such as Via require people to walk to a meeting point comparable to a bus stop and offer fixed routes
and fixed pricing. These new jitney-style services are remarkably similar to New York’s commuter
vans, and questions have been raised about the extent to which they compete against both the more
heavily-regulated taxi industry [11,12] and against public transit [13–15]. City approaches to regulating
these new services are still evolving, but decision making is hampered by limited information about
how these services affect travel patterns [16]. This study of New York’s commuter vans—a private
jitney-style service that has existed alongside MTA transit for over three decades—can inform these
regulatory decisions.

2. New York’s Commuter Vans
     Jitneys operate in almost every city in the developing world, and in many wealthier cities as well.
Many jitney services in US cities sprang up in response to inefficient, inconsistent, or simple lack of
formal public transit services in the neighborhoods they serve (e.g., Jersey City [17], Pittsburg [18],
San Francisco [19], and Miami [20]). In the US, they are often viewed as informal services run mostly
by immigrants for immigrants [21], providing low-cost collective transport services to low-income
neighborhoods with low car ownership.
     The New York commuter vans fit this description. Neighborhood vans in the Bronx, Brooklyn,
and Eastern Queens are largely owned and operated by recent immigrants from the Caribbean and
Africa, while the vans operating between Chinatowns in Manhattan, Brooklyn, and Queens are owned
and operated by Chinese immigrants. The heavy immigrant influence in van ownership and operation,
Urban Sci. 2019, 3, 24 3 of 18
however, does not limit the service to foreign born riders. Our data show that only half of commuter
van riders in Eastern Queens are foreign born. That said, fieldwork observations clearly indicated
a racial pattern among van riders; the vast majority were of African or Hispanic descent, both US-born
and foreign-born. In fact, in three months of data collection requiring daily interaction with van
riders and drivers, we observed only one Caucasian van rider in a neighborhood that is just over
10% white [22]. Although the survey administered in this study did not specifically ask for the
racial/ethnic identification of the van riders, about 50% of the survey respondents indicated that they
were immigrants from the Caribbean (65%), Africa (25%), Latin America (8%), and Asia (2%).
New York commuter van service began in 1980 in response to an 11-day MTA labor strike.
The strike opened an opportunity for people with personal vehicles to step in and provide transport
services for a small fee. This opportunity was lucrative enough that even after the MTA strike ended,
some continued to offer transport services, albeit illegally. In 1982, the New York State Department of
Transportation began to grant permits to commuter vans, making them legal but doing little else to
ensure compliance with regulations [6]. In 1993, the New York City Taxi and Limousine Commission
(TLC) was granted regulatory authority over commuter vans and remains the governing body to date.
New York presents a somewhat unusual case because although the vans sprang up due to inadequate
or absent formal transit services in certain neighborhoods, most of these neighborhoods today have
MTA transit service comparable in quality to that in other parts of New York.
Commuter vans today remain privately owned and operated. They provide low-cost collective
transport service within selected neighborhoods in New York, and they do not receive government
subsidies. Their fare is regulated to be $2 per ride. Most commuter vans in the study area operate from
06:00 or 07:00 to 18:00 or 19:00 with some operating earlier or later. By law, these individually-owned
commuter vans must be registered under a commuter van authorization or base “company”.
A commuter van base is a TLC-licensed business that sends TLC-licensed commuter vans to transport
passengers within a particular geographic service area in New York City [23]. In some cases, the base
license holder also owns all the vans under his/her base and rents them out to drivers. In other cases,
van owner-operators pay a fee to join an existing commuter van base [6]. In August 2016, there were
443 licensed commuter vans operating in New York City [24], 270 of which were operating in our
study area of Eastern Queens [25].
Like jitney services nearly everywhere, the New York commuter vans present a regulatory
challenge for the city. While regulating to ensure public safety, a balance must be struck between
encouraging these transport services to complement public transit and discouraging them from
stealing transit riders and revenues. Achieving this regulatory balance is especially difficult without
detailed van ridership data, such as that presented in this article. Many of the current rules governing
commuter vans focus on combating transit rider stealing. Specifically, commuter vans are licensed only
to provide prearranged transport (street hail pickups are not allowed), are not allowed to use the same
routes as MTA buses, and are not allowed to pick up passengers at bus stops. Because their business
model relies on street hails and it is difficult to create viable van routes that do not overlap with bus
routes, these rules have pushed the van industry to operate only semi-legally. There are semi-regular
TLC “crackdowns” during which van drivers and owners receive costly tickets for failing to follow
these rules.
As we will demonstrate in this article, however, the commuter vans actually play a largely
complementary role to MTA transit in Eastern Queens. Discouraging the commuter van industry
likely hurts both access and mobility in the van-served neighborhoods and adds to already-crowded
conditions on MTA buses in the neighborhood.
3. Eastern Queens Study Area Characteristics
Eastern Queens commuter vans serve six main routes in both Queens and Nassau County [5].
This study focuses on the five commuter van routes operating in Queens County leaving out the one
route operating solely in Nassau County. These commuter vans connect five neighborhoods in EasternUrban Sci. 2019, 3, 24 4 of 18
Queens to the Jamaica Center commercial district: Rosedale, Cambria Heights, Green Acres Mall,
Far Rockaway and Linden. Additional neighborhoods are served as commuter vans operate on roads
through or adjacent to them.
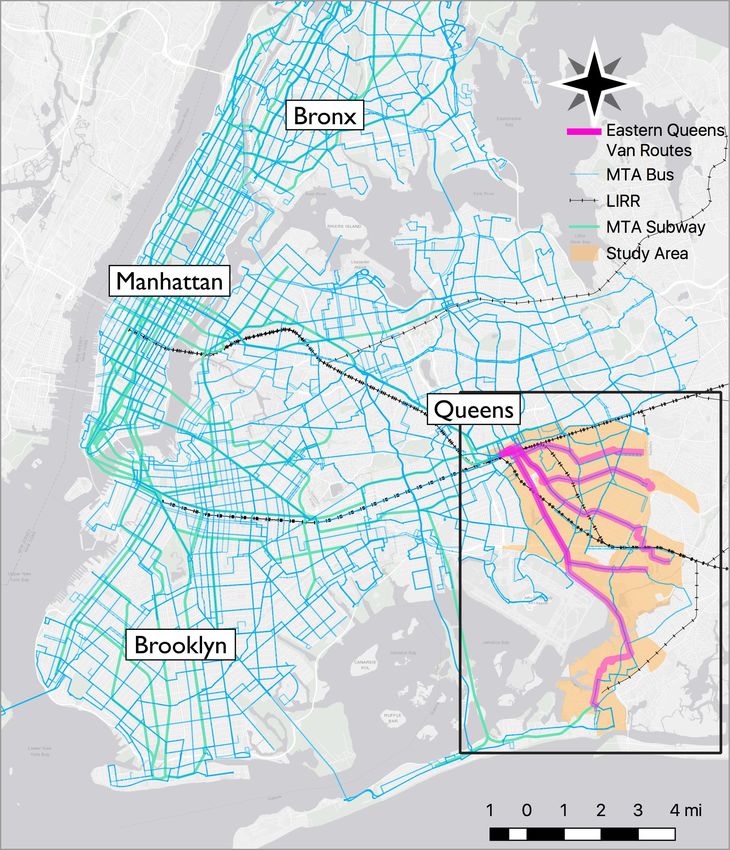
The neighborhoods served by the commuter vans include 115 census tracts. Figures 1 and 2
illustrate the van routes and the location of the study area in the context of New York City and the
MTA transit system, as well as the median household income, population density, and the percent of
households that own cars [22]. The study area is the easternmost part of New York City adjacent to
Long Island, with a suburban feeling. In comparison with much of New York City, the area is more
sparsely populated, and the north and west sides are more densely populated than the rest of the study
area. The median household income is higher in the sparsely populated east and south side of the
study area, while the higher density west side houses residents with lower income. Still, the median
income in most of the study area is actually higher than New York City’s median annual income of
about $53,000.
Urban Sci. 2019, 3, x FOR PEER REVIEW 4 of 20
Figure
Figure 1. The 1. Thearea,
study studyMetropolitan
area, Metropolitan Transportation Authority
Transportation Authority(MTA), and commuter
(MTA), van routes.van routes.
and commuterUrban Sci. 2019, 3, 24 5 of 18
Urban Sci. 2019, 3, x FOR PEER REVIEW 5 of 20
Clockwisefrom
Figure 2.2. Clockwise
Figure fromtop
topleft:
left:commuter
commuter
vanvan routes
routes andand MTA
MTA transit,
transit, household
household income,
income, car
car ownership, and population density
ownership, and population density [22]. [22].
The bottom right map in Figure 2 depicts the spatial distribution of household car ownership in
the study area. Households without cars are completely dependent on shared modes of transportation.
In the northwest corner of the study area where density is high and incomes are low, less than half ofUrban Sci. 2019, 3, 24 6 of 18
households own cars. This vehicle ownership pattern directly impacts the spatial pattern of commute
mode choices. Where car ownership is low, people are more likely to ride public transportation.
In census tracts where car ownership is higher, commute trips are made by carpooling or driving alone.
Note, however, that by the census definition, a commuter van trip is a “carpool” trip. For the longest
portion of their commute, the census reports that 43% of commuters in the study area used public
transportation, 6% carpooled, and 44% drove to work in 2016. As will become clear from our data,
however, many commuters use commuter vans together with MTA transit to get to work.
4. Materials and Methods
Data for this study were collected over three months in summer of 2016 using an Arizona State
University Institutional Review Board-approved survey questionnaire (Appendix A provides a copy of the
survey and raw data totals for each question), a three-day van rider tally on each of the five Eastern Queens
routes, and researcher observation. Surveys were administered on board randomly-selected commuter
vans. Survey implementation required the researcher to ask drivers for permission to ride in their vans
and talk to their passengers, after paying the $2 fare for the trip. The researcher then gave all passengers
the opportunity to participate in the survey and rode each van until all surveys were returned or to the
end of the route, whichever came first. The survey response rate was approximately 40%.
In addition to the surveys, a 3-day ridership tally was conducted on each of the five routes in the
study area. The methodology used was simple, but time-intensive; the researcher rode one van from
approximately 07:00 to 19:00 for three consecutive days, counting each passenger and noting their
gender. These data were collected on the Thursday, Friday, and Saturday of five consecutive weeks
in July and August of 2016, counting passengers on one route each week. Conducting the tally from
Thursday through Saturday allowed for observation of ridership for a typical weekday, a transition
day (Friday), and a weekend day.
An advantage of on-board surveys is that respondents do not need to remember a past trip;
they are asked about their travel while they are traveling. A limitation, however, is that this approach
cannot provide information about commuter van use by a representative sample of neighborhood
residents. As with all surveys, nonresponse bias—where those who choose to answer the survey are
systematically different from those who choose to decline the survey—was a concern. Because this
survey was administered in person, the researcher directly observed differences between respondents
and non-respondents. Specifically, younger commuter van riders were more likely to respond to the
survey than older riders.
The survey included questions about MTA transit use, commuter van-related travel choices,
the current commuter van trip, and basic demographics. Data collected in the field were cleaned,
coded, and analyzed using Microsoft Excel and Stata 14 software. Goldwyn [6] also used on-board
surveys in his study of the Brooklyn commuter vans—the only existing study of New York’s commuter
vans that is comparable to ours. Many of our survey questions overlap with those asked in Goldwyn’s
2013 survey of Brooklyn commuter van riders [6].
Table 1 provides summary statistics for the Eastern Queens survey as well as a direct comparison
between the two van rider survey datasets. This comparison is important because it highlights the
parallels between the van riders’ characteristics in Brooklyn and Eastern Queens, which may speak to
the success of commuter vans in these neighborhoods. Data from the American Community Survey
(2016) show that approximately 55% of the population in the study area were female, 50% were
immigrants who commuted to work, 43% commute to work via transit, 60% of the households
reported incomes over $50,000, and 81% of households owned at least one car. A comparison with
these census data indicates that van riders reflect the study area population in their immigrant status,
but are notably poorer than the general population, less likely to own a car, and more likely to ride
transit. Although these differences between van riders and the study area population likely reflect
reality, they may be exaggerated by the fact that our survey respondents were biased toward younger
commuter van riders. To the extent that younger adults have relatively lower incomes, are less likelyUrban Sci. 2019, 3, 24 7 of 18
to own a car, and are more likely to ride transit than older adults, our survey results may also be biased
in this way.
Table 1. A Comparison of Surveys.
Percent of Commuter Van Riders 2016 Eastern Queens Commuter 2013 Brooklyn Commuter Van
Who: Van Survey (N = 376) Survey [6] (N = 198)
Are Female 59% 63%
Are Immigrants 50% 56%
Own a Car 26% 30%
Report Household Incomes Above
21% 43%
$50,000/Wage Above $17 *
Regularly Use MTA Transit 74% 84%
Have a MetroCard 63% 76%
Have an Unlimited MetroCard 33% 31%
Regularly Ride Vans at Least Once
90% n/a
a Week
Ride Vans Because They:
Are Fast 62% 80%
Are Convenient 39% 50%
Are Cheap 52% 45%
Have Short Wait Times 39% 39%
Will Transfer to MTA Transit on
53% n/a
This Trip
Are Going Home on This Trip 18% n/a
Are Going to Work on This Trip 30% n/a
Are Going to School on This Trip 23% n/a
Are Going Shopping on This Trip 15% n/a
Note: Boldface font and shading are used to indicate statistical significance of differences in proportions between the
two surveys. * The Eastern Queens survey reports household incomes, while the Brooklyn survey reports individual
hourly wages. To convert these to (roughly) comparable metrics, we calculated the percentage of survey respondents
reporting incomes/wages above the approximate median household income and hourly wage in New York City at
the time of each survey. In both surveys, some respondents refused to provide income information, so the number
of valid responses to this question was 324 for the Eastern Queens survey and 146 for the Brooklyn survey.
Hypothesis tests indicate a statistically significant difference between the two van rider surveys for
the percentages shown in boldface and orange shading. There are many similarities between the van
riding populations in these two neighborhoods. The gender balance among riders, the fraction of riders
who are immigrants, and the percent who own cars are not statistically different between these two
samples. The fraction of riders who have MetroCards at all—the MTA official fare payment card—and
use MTA transit was significantly lower in Eastern Queens. This is not surprising because Eastern
Queens is located on the edge of New York City, whereas the Brooklyn van routes are more centrally
located. There were also significant differences in the fraction of van riders who responded that van
speed and convenience were key reasons why they chose the vans over MTA transit. This may reflect
real differences in relative speeds between vans and MTA buses in these different neighborhoods.
5. Results
5.1. How Many People Ride Commuter Vans in Eastern Queens?
Table 2 presents ridership tally results on five commuter van routes in Eastern Queens. The totals
represent the daily ridership of one commuter van excluding the researcher; the percentages of males
and females are provided as well. The capacity of the commuter vans on four of the routes was
13 seated passengers, and that of the Far Rockaway route was between 20 and 25 seated passengers.Urban Sci. 2019, 3, 24 8 of 18
Table 2. Commuter van male and female ridership tally results on individual routes.
Van Routes Thursday Friday Saturday Average
Male 31% 41% 45% 39%
Rosedale
Female 69% 59% 55% 61%
Total 163 178 144 162
Male 46% 41% 42% 43%
Far Rockaway
Female 54% 59% 58% 57%
Total 190 247 212 216
Male 48% 34% 37% 40%
Linden
Female 52% 66% 63% 60%
Total 232 104 161 166
Male 36% 44% 37% 39%
Green Acres
Female 64% 56% 63% 61%
Mall
Total 139 124 149 137
Cambria Male 44% 44% 39% 42%
Heights Female 56% 56% 61% 58%
Total 116 142 126 128
Average ridership across all commuter van routes in the study area was 161 people per day per
van in summer 2016. Interestingly, daily ridership was not appreciably different between weekdays
and weekend days. All commuter vans had higher female than male ridership—consistent with
our survey results—and this pattern was observed throughout the day. Transit safety has been
shown to be a defining factor for women’s transport mode choice [26]; high female ridership could
be evidence that commuter vans are perceived as a safe mode of transit in Eastern Queens. In fact,
survey respondents in this study selected comfort and safety as some of the positive traits of the
Eastern Queens commuter vans.
We used these tally numbers to estimate the total daily commuter van ridership in Eastern Queens
in the summer by simply multiplying by the number of vans on the streets. According to the President
of the New York Commuter Van Association, there were approximately 270 registered commuter vans
and 70 unregistered vans in the study area [25]. The total daily summer commuter van ridership in
the study area was therefore approximately 55,000. This tally may actually undercount annual van
ridership. During fieldwork, we heard from drivers that ridership is seasonal, and that van ridership
is highest in winter. This is both because people prefer not to stand in the cold waiting for the bus and
because the vans can maneuver better than buses in snowy conditions.
Putting our estimate of 55,000 van riders per day in context, MTA transit’s reported bus ridership
for 2016 was approximately 53,000 riders each weekday on the five parallel bus routes [27,28].
The commuter vans, then, are serving about half of the transit trips along these routes.
5.2. What Are the Socioeconomic Characteristics of Commuter Van Riders?
The Eastern Queens van rider survey collected four demographic characteristics of respondents:
household income, gender, immigrant status, and age category. Table 1 reports summary statistics on
the first three of these variables, illustrating that van riders are relatively low-income, include more
women than men, and are about half immigrants.
Table 3 provides a look at how these demographic characteristics are associated with four key
transportation choices that were also reported by survey respondents: whether a car was available
for the trip they were making on the commuter van at the time of the survey, possession of an
unlimited MetroCard, frequency of commuter van use, and whether their trip at the time of the survey
would have been free on MTA transit. The last of these occurs when van riders either possess an
MTA unlimited-ride MetroCard, or they are planning to transfer to an MTA bus or subway (MTA
transfers are free within a 2-hour time window). Chi-squared independence tests were performed toUrban Sci. 2019, 3, 24 9 of 18
identify the statistical significance of the differences between each demographic category and transport
choice, and Table 3 provides these test statistics for each pair of variables. Statistically significant
differences are indicated with asterisks, and those that meet standard statistical significance thresholds
(p-value < 0.05) are highlighted in bold font and orange table shading.
Table 3. Associations between demographics and respondent transport choices.
Car Available for Unlimited Use Van More Paying $2 Van Premium
This Trip MetroCard Than 1x/Week on This Trip
Pct. χ2 , N Pct. χ2 , N Pct. χ2 , N Pct. χ2 , N
Under
Annual 15% 21.96*** 33% 0.02 86% 0.90 64% 0.10
$50k
Income
$50k or
42% N=313 34% N=321 81% N=324 66% N=324
Greater
Gender Male 30% 7.93*** 39% 4.10** 82% 0.81 66% 0.52
Female 17% N=330 29% N=338 86% N=341 62% N=341
Age 18 – 30 14% 13.10*** 35% 5.12* 87% 60%
3.18 2.12
N=325 N=333 N=336 N=336
31 – 45 26% 37% 84% 69%
Over 45 37% 21% 77% 63%
Immigrant Yes 25% 1.70 31% 0.61 85% 0.56 65% 0.21
No 19% N=317 36% N=325 82% N=328 63% N=328
Note: Asterisks, boldface font, and shading used to indicate statistical significance of χ2 tests.
*** Indicates p-value < 0.01, ** Indicates p-value between 0.01 and 0.05, * Indicates p-value between 0.05 and
0.10. Darker shading and boldface font indicate standard statistical significance with p-values < 0.05. Light shading
indicates marginal statistical significance with p-values between 0.05 and 0.10.
The main finding from this analysis is that among van riders, these demographic characteristics
are not significantly associated with frequency of van use or paying a premium to ride the vans.
Household income, gender, and age are, however, associated with car access; higher-income, older,
and male van riders were more likely to have car access. Gender was also associated with possession
of an unlimited MetroCard, with men more likely to have the MTA passes than women.
5.3. Why Do Riders Choose the Commuter Vans over Public Buses?
Existing research on jitney-style transport services provides a variety of reasons why people
might choose to ride commuter vans. Cervero and Golub [29] describe these services as highly
flexible. King and Goldwyn [1] and Goldwyn [6] attribute the success of the New York dollar vans to
time savings, and low cost is often cited as an important characteristic of jitney-style transportation
services [29,30].
In Eastern Queens, the van riding experience differs from the bus riding experience.
Commuter vans are much smaller than MTA buses. In part because it is difficult to stand in a van,
van riders are almost always comfortably seated, whereas “standing room only” is common on
peak-hour buses. Buses pick up passengers only at designated stops, while vans pick up riders
anywhere along their routes, as long as there is an available seat. Buses do not deviate from their
assigned routes, while vans will go off-route to provide more direct service to individual passengers.
In the course of conducting fieldwork for this study, we observed several instances when the van
drivers went off the regular route to drop off kids at a daycare or drop off older passengers and those
with shopping bags or heavier loads at their doorsteps. Sometimes the drivers charged an extra dollar
or two for the service, but most commonly this was done simply as a favor to regular van customers.
Once, a passenger requested to be taken to the Long Island Railroad station several miles from the
last van stop and the driver charged $5 for the ride—less than a taxi or ride hailing service would
have cost.
The Eastern Queens van rider survey asked the question, “Why do you take dollar vans?”,
with the opportunity for respondents to choose multiple answers. Table 1 reports that 62% of Eastern
Queens survey respondents cited speed of travel as one reason that they chose the commuter vans
over the MTA bus, and 39% also reported that short wait times were an attractive feature of the vans.Urban Sci. 2019, 3, 24 10 of 18
To investigate the extent to which the vans are actually faster than the city buses in Eastern
Queens, we compared commuter van and bus trip times for a trip from one end of each commuter van
route to the other. Note that this comparison provides the maximum possible time savings provided
by the vans because some riders do not ride the entire route. Van riders, however, often do ride the
full length of the route—especially at peak hours.
During the tally exercise, the time spent on every trip was recorded. Separately, time spent on
MTA bus trips with the same origin and destination was recorded, although the routes followed were
not strictly identical. Metropolitan Transportation Authority bus ride times were recorded only once
through a round trip. Table 4 reports the average van ride duration during the tally, the observed MTA
bus trip duration, and the official MTA scheduled bus trip duration. Commuter van trips on all routes
in the study area are faster than trips on MTA buses along similar routes, and for some routes the
difference is large. When travelers choose to use a commuter van, then, they are buying time.
Table 4. Travel time comparison between commuter vans and city buses.
Commuter Van Observed MTA Official MTA Commuter Vans
City Buses Average Time Bus Trip Time Scheduled Trip on Parallel
(Minutes) (Minutes) Time (Minutes) Routes
Q5 29 49 42 Green Acres Mall
Q83 22 27 31 Cambria Heights
Q4 23 31 32 Linden
Q111 27 40 43 Rosedale
Q114, Q113 42 55 68 Far Rockaway
As indicated by the survey results, commuter van riders value time savings in both reduced ride
times and reduced wait times. We did not record the difference in wait times to provide a quantitative
comparison, but researcher observations revealed that wait times for vans in Eastern Queens are
usually shorter than wait times for the MTA buses. The reasons for the shorter van wait times are
structural. During peak times, demand for both buses and vans is high. The bus and van routes do
not begin at the same location, however, and often the buses are full even before they reach the van
route terminus. This means that peak van wait times at their terminus are clearly shorter than bus wait
times; the vans begin empty there, but passengers may have to wait for multiple MTA buses to pass
before one with available space arrives. At off-peak times, the bus headways are longer but the van
frequency remains high throughout the day. In addition, the fact that commuter vans are not bound by
strict schedules can often reduce their wait times.
Low cost was reported to be an attractive commuter van trait for 52% of van rider survey
respondents in Eastern Queens. For cost-sensitive residents who travel locally, the cost advantage of
commuter vans ($2 versus $2.75 for MTA buses in the summer of 2016) is indeed significant. As noted
earlier, however, many van riders actually pay a $2 premium to ride the vans because their rides on
MTA buses are effectively free—they have already paid for them.
We find that at least 63% of the Eastern Queens survey respondents are in this category, paying a $2
premium for their van rides. We cannot report the exact percentage due to an unfortunate oversight
in survey design. The Eastern Queens commuter van rider survey asked whether respondents were
going to transfer to MTA bus or subway transit from their commuter van ride, but did not ask whether
respondents had transferred from an MTA bus or subway to the commuter van. Sixty-three percent of
our respondents either had an unlimited-ride MetroCard or were planning to transfer to MTA transit
to complete their trips. We expect that additional respondents had transferred from MTA transit to the
commuter vans, but we do not know how many. For this reason, we report that at least 63% of the
survey respondents were paying a premium for their van rides.
This finding is remarkable, especially when considering the low-income profile of most van riders.
Table 3 indicates that a binary measure of income (over or under $50,000 annually) is not related to
whether a respondent paid a premium for his or her van ride. A more detailed look at the data revealUrban Sci. 2019, 3, 24 11 of 18
that at least 64% of riders in the lowest income category (less than $20,000 annual income) paid a van
premium, and at least 71% of riders in the second-lowest income category ($20,000–$30,000 annual
income) paid a van premium. We explored the choice to pay a van premium with multivariate analysis,
and found that paying a premium to ride the vans was not significantly explained by any of the rider
characteristics that we collected in our survey. This result suggests that regardless of income and other
demographic characteristics, van riders value the service quality of the commuter vans over the MTA
buses enough to pay an extra $2 to ride them.
We looked at the difference in the reporting of cost as a reason for riding the vans between
those survey respondents who would and would not save money on their current van trip
(see Table 5). We did find a difference, but it was surprisingly small and not statistically significant.
Fifty-seven percent of van riders who would save money on their trip by using the vans reported
the low cost of the vans as a reason they chose the van over the MTA bus, but this figure for riders
who were actually paying a premium for their van ride remained high at 49%. Perhaps these riders
considered $2 to be inexpensive for the premium in service that they receive when riding in the vans
compared with the city bus; they arrive faster and are perhaps more likely to get a seat. It may be,
however, that these riders were simply thinking that the base fare for the vans is lower than that of
MTA transit—even though for their particular ride at the time of the survey, MTA transit would have
been effectively free.
Table 5. Associations between respondent reasons for riding vans and transport choices.
Fast Convenient Cheap Short Wait
Pct. χ2 , N Pct. χ2 , N Pct. χ2 , N Pct. χ2 , N
Car Available 61% 0.04 44% 0.80 42% 3.98** 38% 0.08
Car Not Available 62% N=358 39% N=358 54% N=358 40% N=358
Unlimited MetroCard 70% 4.30** 43% 1.42 46% 3.13* 42% 0.44
No Unlimited MetroCard 58% N=368 37% N=368 56% N=368 38% N=368
Use Van 1x/Week or Less 49% 4.91** 41% 0.05 42% 2.62* 36% 0.36
Use Van More Than
64% N=371 39% N=371 54% N=371 40% N=371
1x/Week
Paying $2 Premium 64% 1.17 41% 1.21 49% 1.89 43% 3.64*
Saving Money 58% N=371 36% N=371 57% N=371 33% N=371
Note: Asterisks, boldface font, and shading used to indicate statistical significance of χ2 tests.
*** Indicates p-value < 0.01, ** Indicates p-value between 0.01 and 0.05, * Indicates p-value between 0.05 and
0.10. Darker shading and boldface font indicate standard statistical significance with p-values < 0.05. Light shading
indicates marginal statistical significance with I-values between 0.05 and 0.10.
Tables 5 and 6 illustrate additional associations between transport choices of van riders and their
reasons for riding the vans, and between the different transport choices made by van riders. Those who
have unlimited MetroCards overwhelmingly list speed as a key reason that they use the commuter
vans, and are less likely than those without unlimited MetroCards to specify the vans’ low cost as
a motivating factor. This makes sense, as these riders are among those paying a $2 premium to ride
the vans. Those who use the vans more than once a week are more likely to list both speed and low
cost as reasons that they use the vans, compared with those who use them once per week or less.
Higher frequency van riders were also less likely to own a car or have an unlimited-ride MetroCard.Urban Sci. 2019, 3, 24 12 of 18
Table 6. Associations between respondent transport choices.
Use Van More Than
Car Available for This Trip Unlimited MetroCard
1x/Week
Pct. χ2 , N Pct. χ2 , N Pct. χ2 , N
Unlimited MetroCard 19% 1.27
No Unlimited MetroCard 24% N=359
Use Van 1x/Week or Less 37% 9.02*** 49% 7.84***
Use Van More Than 1x/Week 19% N=362 30% N=372
Paying $2 Premium 21% 0.72 n/a n/a 84% 0.07
Saving Money 25% N=362 n/a n/a 85% N=376
Note: Asterisks, boldface font, and shading used to indicate statistical significance of χ2 tests.
*** Indicates p-value < 0.01, ** Indicates p-value between 0.01 and 0.05, * Indicates p-value between 0.05 and
0.10. Darker shading and boldface font indicate standard statistical significance with p-values < 0.05. Light shading
indicates marginal statistical significance with p-values between 0.05 and 0.10.
5.4. Do Vans Complement or Compete against MTA Transit Service?
Literature has shown that private jitney-style services can compete against formal transit,
complement formal transit, or, in cases where formal transit is absent, substitute for formal
transit [4,6,31]. Both King [4] and Goldwyn [6] argue strongly that Brooklyn’s commuter vans serve
as important complements to, occasional substitutes for, and minor competitors to formal transit.
Our research provides evidence that this is also true in Eastern Queens.
An important feature of the commuter van rider population is regular use of multiple transport
modes. The van rider survey asked riders to identify the transport modes they regularly use, and more
than three-quarters of the respondents checked the box next to two or more modes. The survey
also included a question about how respondents would make their current trip if the vans were not
available. Of the 368 survey respondents who answered this question, only seven of them (under 2%)
responded that they would not make the trip. The other 98% identified at least one alternative mode
that they could use. In particular, 78% of commuter van riders identified the MTA transit bus as an
alternative mode for the trip they were taking. This provides some evidence that the commuter vans
compete directly with neighborhood MTA buses for riders.
Nonetheless, the net financial impact of the commuter vans on the MTA is almost certainly positive.
As mentioned earlier, we estimate that commuter vans in Eastern Queens serve approximately the
same number of trips as the buses along parallel routes. If all of the van riders moved over to the
buses, then, the MTA would need to accommodate a doubling of ridership on routes whose buses are
currently full (i.e., standing room only, and sometimes even standing room is not available) at peak
hours. This would be expensive. Importantly, in doing so, the MTA would receive less than a 40%
increase in fare revenue. This is because more than 60% of commuter van riders would not have paid
extra to ride the MTA buses; they either held an unlimited-ride MetroCard or they were transferring to
the MTA for the next leg of their trip.
We conclude that the Eastern Queens commuter vans complement MTA transit service in two
important ways. First, the vans serve as a high-quality feeder route system for the MTA’s subway,
commuter rail, and express buses that connect Jamaica Center to other parts of the city and region.
Second, the vans relieve crowding on Eastern Queens MTA buses during peak hours, when buses
are often full. From the MTA’s point of view, this should be a win–win–win situation. The MTA gets
most of the fare revenue while providing only half of the feeder bus service along these relatively
low-density routes, the passengers on the vans enjoy (and are willing to pay for) the relatively fast van
service, and the commuter van drivers and owners are able to make a living.
In addition, the role of commuter vans as occasional substitutes to MTA transit during harsh
weather is apparent. For instance, even with New York City’s transportation system largely shut down
after Hurricane Sandy, privately operated “dollar vans” stayed in operation [9]. An MTA bus driver
quoted by Olean [32] said “[The vans] help us out in a lot of ways, when the weather gets bad or when
we’re overwhelmed during rush hour, they take [away] some of the burden.”Urban Sci. 2019, 3, 24 13 of 18
6. Discussion
Commuter vans are a rare example in the US context of a successful and sizable private collective
transport service. The industry has been operating for over 30 years, and along the Eastern Queens van
routes, our estimates suggest that the vans carry as many passengers as the MTA buses. This research
provides an initial picture of the Eastern Queens commuter vans and their riders, based on field
research conducted during the summer of 2016. We aimed to estimate van ridership, as well as identify
who rides the vans and why they do so despite the existing parallel MTA bus service. The answers to
these questions provide insight into the extent to which the commuter vans complement or compete
with MTA transit in this neighborhood—an important policy question, especially in the current era of
rapidly proliferating mobility services.
Commonly-held views—especially by those who do not use the commuter vans—are that the
vans are a cheaper and therefore inferior transport service compared to the MTA buses. It is true that
the base fare is lower on the vans—$2.00 versus $2.75 for a single ride in the summer of 2016. The fare
story is complicated by the fact that MTA offers free transfers between their buses and subways,
as well as unlimited ride passes and further discounts for children and seniors. Van fares do not vary,
van passes do not exist, and there are no transfers included in the van base fare. One of the most
remarkable findings from this study was that at least 63% of the van riders we surveyed were paying
a $2 premium to use the vans; their ride for the trip they were taking at the time of the survey would
have been free on an MTA bus. Most commuter van riders are relatively low-income, and the fact that
many of them are paying extra to ride the vans shows that even poor riders are willing and able to pay
for higher transport service quality.
Indeed, our data indicate that vans actually do provide a premium service. Most importantly,
they are substantially faster than MTA buses because they do not adhere to a schedule or stop at
pre-designated locations. Our data show that Eastern Queens vans are 28–38% faster than the MTA
buses for a trip that traverses the entire van route, corresponding to a potential time savings of between
9 and 26 minutes. Earlier work by Goldwyn [6] estimated that vans along Flatbush Avenue in Brooklyn
were 50% faster than parallel MTA buses. Vans also tend to have shorter wait times than the buses,
mainly because there are more of them on the streets, so their frequency is higher.
Although the vans clearly siphon riders away from MTA buses, our work suggests that
the net financial impact on the MTA is likely positive. The conclusion that commuter van-type
services complement formal public transit is not unique to New York. Cervero [30] pointed out the
complementary role played by jitney-style transport services in many cities around the world, and the
private commuter shuttles of San Francisco provide an example in yet another context. The executive
director of the San Francisco County Transportation Authority cited the importance of these shuttles,
admitting that “at the end of the day, [our formal transit] can’t meet the demand” [19].
Parallels between Commuter Vans and Other Private Mobility Services
The New York commuter van industry has shown resilience and adaptability throughout
multiple phases of regulation over decades. In their first decade of operation, the government
took a laissez faire approach, enabling the development of a market-driven business model to
provide flexible, adaptable, and affordable transport service. When TLC took over commuter van
regulation in 1993, they implemented regulations that limit commuter vans’ operations flexibility
and adaptability—fundamental components of their business model. This mismatch is attributed
by Goldwyn [6] (p. 31) to “a profound lack of communication and coordination between dollar van
interests and local officials”, stemming from TLC naivety about the vans they regulate. When the
New York City Council discussed the commuter vans as recently as 2017, one councilman argued
for increased regulation, while another argued for regulatory reforms that would better support the
commuter van industry [33].
This history of commuter van interaction with regulators bears a striking resemblance to the
current interactions playing out between cities and private ride hailing services like Uber and Lyft;Urban Sci. 2019, 3, 24 14 of 18
cities are now working toward regulating these services after a few years of largely unconstrained
operations. There is a recognition that these services fill a gap while at the same time a recognition
that they may have negative impacts on public transit, congestion, and safety. In a city like New York,
then, should the government seek to improve their transit system to fill the gaps that allow commuter
vans, Uber, and Lyft to thrive, or should it diversify transit to explicitly partner with private services?
While we do not answer this question, our evidence can help inform the ongoing debate on whether
the “positive” roles outweigh the negative ones for commuter vans.
It is important to note that New York is unique in the US in terms of its combination of
a well-developed public transit system, high population density, high car parking costs in commercial
districts, and high levels of traffic congestion. Together, these characteristics effectively encourage
New Yorkers to use transit—even if they have to transfer to a train from a feeder bus, van, or even
ride hail or taxi. Some lessons from this research, therefore, may not apply to cities that do not have
these characteristics.
7. Conclusions
The commuter vans of New York and similar services elsewhere serve a purpose that is important
for transportation planners to understand. Privately-owned shared modes are growing, and public
entities should identify opportunities to engage with them to ensure that benefits are widely and
equitably shared [13]. In the current regulatory environment in New York, the characteristics that
make commuter vans attractive are out of reach for MTA transit—they provide a premium service
at an affordable price without government subsidies. Although our data illustrate that commuter
vans in Eastern Queens likely have a positive net financial impact on the MTA, this conclusion is
highly context-dependent. As privately-owned shared transport modes proliferate across the globe,
continued research is needed to develop context-specific strategies to integrate them with formal
transit for the mutual benefit of cities, entrepreneurs, and most importantly, commuters.
Author Contributions: Individual contributions to this article are as follows: conceptualization, C.M. and D.S.;
methodology, C.M. and D.S.; fieldwork, C.M.; data curation, C.M.; Writing—Original Draft preparation, review,
and editing, C.M. and D.S.; supervision, D.S.; funding acquisition, C.M.
Funding: This research was funded by the Fulbright Scholar program. Additional travel and research expenses
were funded through a small grant from Arizona State University.
Conflicts of Interest: The authors declare no conflict of interest.
Appendix A Commuter Van Rider Survey
1. What is your regular mode of transportation? Check all that apply. (N=375)
Personal Vehicle (71)
Bus (214)
Subway (202)
Dollar van (316)
Bicycle (36)
Walking (38)
Other. Please specify (1) ________________________________
2. Do you have an MTA MetroCard? (N=373)
Yes, I have the 30-day unlimited ride MetroCard (71)
Yes, I have the 7-day unlimited ride MetroCard (46)
Yes, I have the pay-per-ride MetroCard (111)
I have the 7-day express bus pass (7)
No, I pay in cash (97)Urban Sci. 2019, 3, 24 15 of 18
No, I do not have a MetroCard (29)
No, I do not take the subway or city bus (13)
3. How often do you take dollar vans? (N=364)
Every day (51) Once a week (24)
6 days a week (45) Twice a month (14)
5 days a week (137) Once a month (7)
4 days a week (32) Less than once a month (13)
3 days a week (25) This is my first trip on a dollar van (1)
2 days a week (16)
4. Where are you going now? (N=362)
Home (66)
School (including College/University) (84)
Work (107)
Shopping (53)
Social/Church/Personal (48)
Other (please specify) (4) __________________________________
5. Do you have a car that you could have used to make this trip? (N=362)
Yes (81)
No (281)
6. Will you transfer to another bus or train on this trip to where you are going now? (N=360)
Yes, I will transfer to the city bus (60)
Yes, I will transfer to the subway (106)
Yes, I will transfer to another (Please specify) (25)
No (171)
7. If dollar vans were not available, how would you make this trip? (N=368)
Personal vehicle (49)
City bus (286)
Subway (73)
Bicycle (21)
Walk (15)
Not take the trip (9)
8. Why do you take dollar vans (Check all that apply)? (N= 371)
Flexible van route (72) Short wait time (145)
Fast (230) I know the driver (20)
Comfortable (59) Everyone rides dollar vans (2)
Cheap (193) My only option (0)
Safe (34) Other (0)
Convenient (102) Please specify_________________
9. Do you think dollar vans are important in your neighborhood? (N=365)
Yes (338)
No (5)
I don’t know (22)
10. In your opinion, what makes informal transportation thrive in your neighborhood?
_____________________________________________________________________________________Urban Sci. 2019, 3, 24 16 of 18
11. What is your gender? (N=341)
Male (139)
Female (202)
12. What is your age? (N = 336)
18-30 (150)
31-45 (126)
46-60 (52)
61 or more (8)
13. Which option below best describes your total annual household income? (325)
Under $20,000 (83)
$20,000 – $29,999 (69)
$30,000 – $39,999 (30)
$40,000 – $49,999 (75)
$50,000 – $59,999 (23)
$60,000 – $69,999 (24)
$70,000 – $79,999 (18)
$80,000 or greater (4)
14. Informal public transportation has been shown in previous studies to be prevalent in immigrant
communities in the US By answering this question you help test this conclusion. Are you an
immigrant? (330)
Yes (166)
No (166)
15. If so, which country did you come from? _______________________________________
References
1. King, D.A.; Goldwyn, E. Why do regulated jitney services often fail? Evidence from the New York City
group ride vehicle project. Transp. Policy 2014, 35, 186–192. [CrossRef]
2. Valley Metro. System Fact Sheet. 2018. Available online: https://www.valleymetro.org/fact-sheets
(accessed on 19 February 2019).
3. Metro Transit. Metro Transit Ridership Tops 82.6 Million in 2016. 2017. Available online: https://www.
metrotransit.org/metro-transit-ridership-tops-826-million-in-2016 (accessed on 15 February 2019).
4. King, D. Introduction to special section on paratransit. Transp. Land Use 2015, 8, 121–122. [CrossRef]
5. Reiss, A.; Lavey, N. New York’s Shadow Transit. 2014. Available online: http://projects.newyorker.com/
story/nyc-dollar-vans/ (accessed on 5 May 2016).
6. Goldwyn, E.L. An Informal Transit System Hiding in Plain Sight: Brooklyn’s Dollar Vans and Transportation
Planning and Policy in New York City. Ph.D. Thesis, Columbia University, New York, NY, USA, 20 January 2017.
7. Sperling, D.; Brown, A.; D’Agostino, M. How Ride-Hailing Could Improve Public Transportation Instead of
Undercutting it. 2018. Available online: https://theconversation.com/how-ride-hailing-could-improve-
public-transportation-instead-of-undercutting-it-96453 (accessed on 29 December 2018).
8. Hoffmann, K.; Ipeirotis, P.G.; Sundararajan, A. Ridesharing and the Use of Public Transportation.
In Proceedings of the Thirty Seventh International Conference on Information Systems, Dublin, Ireland,
11–14 December 2016; Curran Associates Inc.: New York, NY, USA, 2017.
9. Kaufman, S.; Qing, C.; Levenson, N.; Hanson, M. Transportation during and after Hurricane Sandy.
2012. Available online: https://wagner.nyu.edu/files/faculty/publications/sandytransportation.pdf
(accessed on 27 January 2017).Urban Sci. 2019, 3, 24 17 of 18
10. New Jersey Transportation Planning Authority (NJTPA). Hudson County Jitney Study. Final Report. 2011.
Available online: https://www.njtpa.org/getattachment/Archive/Completed-Regional-Studies-Archive/
Hudson-County-Jitney-Study/HudsonCountyJitneyStudy/Hudson-County-Jitney-Study-Final-Report.
pdf.aspx (accessed on 28 May 2017).
11. Wallsten, S. The Competitive Effects of the Sharing Economy: How is Uber Changing Taxis? 2015.
Available online: https://techpolicyinstitute.org/wp-content/uploads/2015/06/the-competitive-effects-
of-the-2007713.pdf (accessed on 15 May 2018).
12. Sen, C. What happens if Uber or Lyft Outcompetes Public Transit? 2017. Available online: http://
www.chicagotribune.com/news/opinion/commentary/ct-uber-lyft-public-transit-20170721-story.html
(accessed on 15 May 2018).
13. Feigon, S.; Colin, M. Broadening Understanding of the Interplay Among Public Transit, Shared Mobility,
and Personal Automobiles. 2018. Available online: http://www.trb.org/Main/Blurbs/177112.aspx
(accessed on 28 December 2018).
14. Rayle, L.; Dai, D.; Chan, N.; Cervero, R.; Shaheen, S. Just a better taxi? A survey-based comparison of taxis,
transit, and ridesourcing services in San Francisco. Transp. Policy 2016, 45, 168–178. [CrossRef]
15. Hall, J.D.; Palsson, C.; Price, J. Is Uber a substitute or complement for public transit? J. Urban Econ. 2018, 108, 36–50.
[CrossRef]
16. Clewlow, R.R.; Mishra, G.S. Disruptive Transportation: The Adoption, Utilization, and Impacts of Ride-Hailing
in the United States; Research Report UCD-ITS-RR-17-07; University of California, Davis, Institute of
Transportation Studies: Davis, CA, USA, 2017; Available online: https://itspubs.ucdavis.edu/index.php/
research/publications/publication-detail/?pub_id=2752 (accessed on 30 December 2018).
17. Jury, C.; Frassinelli, M. Jitney Minibuses Offer a Cheaper Option for N.J. Passengers, but Ride can Be Risky.
2010. Available online: http://www.nj.com/news/index.ssf/2010/07/jitney_minibuses_provide_a_che.
html (accessed on 1 July 2017).
18. McNulty, T. Pittsburgh Jitney Service Illegal, but Thriving. 2013. Available online: https://www.post-gazette.
com/news/transportation/2013/09/07/Pittsburgh-jitney-service-illegal-but-thriving/stories/201309070167
(accessed on 24 January 2019).
19. Nelson, L.J. Startups offer Bay Area Travelers Alternative to Crowded Bus System. 2015. Available online:
http://www.latimes.com/chi-startup-bus-system-20150410-story.html (accessed on 6 July 2017).
20. Nebhrajani, R. Watch and Learn: How to Ride Miami’s Jitney. 2017. Available online: https://thenewtropic.
com/jitney/ (accessed on 24 January 2019).
21. Valenzuela, A., Jr.; Schweitzer, L.; Robles, A. Camionetas: Informal travel among immigrants. Transp. Res.
Part A Policy Pract. 2005, 39, 895–911. [CrossRef]
22. United States Census Bureau. American Community Survey. 2015. Available online: https://factfinder.
census.gov/faces/nav/jsf/pages/index.xhtml (accessed on 28 May 2017).
23. New York City Business. Commuter Van Base. Available online: https://www1.nyc.gov/nycbusiness/
description/commuter-van-base (accessed on 25 January 2019).
24. New York City Taxi and Limousine Commission. Authorized Commuter Van Service Areas
Spreadsheet. 2016. Available online: https://www1.nyc.gov/site/tlc/businesses/para-commuter-van.
page (accessed on 19 February 2019).
25. Ricketts, H.; New York, NY, USA. CEO: Community Transportation Systems. Personal communication, July 2016.
26. Loukaitou-Sideris, A. Fear and safety in transit environments from the women’s perspective. Int. Secur.
2014, 27, 242–256. [CrossRef]
27. Metropolitan Transportation Authority (MTA). Average Weekday Bus Ridership. 2018. Available online:
http://web.mta.info/nyct/facts/ridership/ridership_bus.htm (accessed on 25 May 2018).
28. Metropolitan Transportation Authority (MTA). Average Weekday MTA Bus Ridership. 2018. Available online:
http://web.mta.info/nyct/facts/ridership/ridership_busMTA.htm (accessed on 25 May 2018).
29. Cervero, R.; Golub, A. Informal transport: A global perspective. Transp. Policy 2007, 14, 445–457. [CrossRef]
30. Cervero, R. Informal Transit: Learning from the Developing World. 2001. Available online: https://www.
accessmagazine.org/spring-2001/informal-transit-learning-developing-world (accessed on 27 January 2017).
31. Golub, A.; Balassiano, R.; Araújo, A.; Ferreira, E. Regulation of the informal transport sector in Rio de Janeiro,
Brazil: Welfare impacts and policy analysis. Transportation 2009, 36, 601–616. [CrossRef]You can also read