Does Quality Disclosure Improve Quality? Responses to the Introduction of Nursing Home Report Cards in Germany - Annika Herr, Thu-Van Nguyen ...
←
→
Page content transcription
If your browser does not render page correctly, please read the page content below
No 176

         Does Quality Disclosure
         Improve Quality?
         Responses to the
         Introduction of Nursing
         Home Report Cards in
         Germany

         Annika Herr,
         Thu-Van Nguyen,
         Hendrik Schmitz
         February 2015
IMPRINT DICE DISCUSSION PAPER Published by düsseldorf university press (dup) on behalf of Heinrich‐Heine‐Universität Düsseldorf, Faculty of Economics, Düsseldorf Institute for Competition Economics (DICE), Universitätsstraße 1, 40225 Düsseldorf, Germany www.dice.hhu.de Editor: Prof. Dr. Hans‐Theo Normann Düsseldorf Institute for Competition Economics (DICE) Phone: +49(0) 211‐81‐15125, e‐mail: normann@dice.hhu.de DICE DISCUSSION PAPER All rights reserved. Düsseldorf, Germany, 2015 ISSN 2190‐9938 (online) – ISBN 978‐3‐86304‐175‐5 The working papers published in the Series constitute work in progress circulated to stimulate discussion and critical comments. Views expressed represent exclusively the authors’ own opinions and do not necessarily reflect those of the editor.
Does Quality Disclosure Improve Quality? Responses to the
   Introduction of Nursing Home Report Cards in Germany∗

          Annika Herr†                    Thu-Van Nguyen‡                 Hendrik Schmitz§
      DICE, University of                 DICE, University of          University of Paderborn
     Düsseldorf & CINCH              Düsseldorf & CINCH                    CINCH & RWI

                                            February 2015

                                                Abstract

      Since 2009, German nursing homes have been evaluated regularly with quality report
      cards published online. We argue that most of the information in the report cards
      does not reliably measure quality of care, but a subset of seven measures does. Using
      a sample of more than 3,000 nursing homes with information on two waves, we find
      a significant improvement in the nursing home quality from the first to the second
      evaluation. Both indicators comprising either the two outcome quality measures or
      the seven measures indicating “risk factors” in the report cards improve. This can be
      interpreted as evidence that quality disclosure positively affects the (reported) quality
      in nursing homes.

      JEL Classification: L15, I11, I18

      Keywords: public reporting, quality, long-term care, information

   ∗ We thank Florian Heiß, Ulrich Heimeshoff, and Christian Pfarr as well as participants of the DICE
brown-bag seminar 2014, the CINCH Academy 2014 and the DIBOGS workshop in Fürth 2014 for valuable
comments. Financial support from the BMBF (Förderkennzeichen 01EH1102A) is gratefully acknowledged.
   † Email: herr@dice.hhu.de; Address: Universität Düsseldorf, Düsseldorf Institute for Competition Eco-

nomics (DICE), Universitätsstrasse 1, 40225 Düsseldorf, Germany. Tel: +49 211 81 15497, Fax: +49 211 81
15499
   ‡ Email: thu-van.nguyen@wiwinf.uni-due.de; Address: CINCH - Health Economics Research Center,

Edmund-Körner-Platz 2, 45127 Essen, Germany. Tel: +49 201 183 2539
   § University of Paderborn, Warburger Strasse 100, 33098 Paderborn, Germany, Tel.: +49 5251 603213,

E-mail: hendrik.schmitz@uni-paderborn.de

                                                    1
1 Introduction
In this paper we analyze the effect of mandatory quality disclosure on outcome quality in
the German nursing home market. After a series of public scandals regarding very bad
quality in some German nursing homes (Tscharnke, 2009), health insurance providers
and nursing home-owners took joint action to improve the transparency of nursing home
quality. According to the “care transparency agreement (CTA),” started in 2009, German
nursing homes are evaluated unannouncedly on a regular basis according to a standard-
ized list of criteria. Since then, the quality information has been published online in stan-
dardized report cards and can be easily accessed on central websites.
Theoretically, the public provision of quality information should serve as an incentive for
the quality improvement of nursing home providers. While, typically, there is an infor-
mation asymmetry between providers and consumers on the true quality of care, public
report cards reduce these asymmetries, giving consumers a higher bargaining and deci-
sion making power (Arrow, 1963). Good evaluations serve as a quality signal and conse-
quently lead to a higher purchase probability and to a more efficient allocation (Reinstein
and Snyder, 2005; Friberg and Grönqvist, 2012).
It has been empirically shown that public reporting increases quality in industries which
deal with information asymmetries such as food labeling (Nielsen, 2006) or law schools
(Stake, 2006). Regarding health care, some US and an Italian study find that public report-
ing leads to a quality improvement in hospitals (Laschober et al., 2007; Pham et al., 2006;
Dziuban et al., 1994; Renzi et al., 2012). Looking at German hospitals, Busse et al. (2009)
and Filistrucchi and Ozbugday (2012) identify an improvement in quality after public
reporting. Cutler et al. (2004) argue that for evaluating the quality development of the
hospital market, one potential problem could be the inaccuracy of data: better outcomes
after quality information may also be due to the physicians’ selection of healthier patients.
Thus, the question arises as to whether more information is always better (Dranove et al.,
2003).
Turning to the nursing care market in the US, selected quality measures improved at least
for subgroups of nursing homes following the introduction of the obligatory disclosure
policy in 2002 (Lu, 2012; Park and Werner, 2011; Mukamel et al., 2008; Grabowski and
Town, 2011). The policy was introduced by the Nursing Home Quality Initiative (NHQI)
1in order to facilitate the search for an appropriate nursing home for consumers, as the
US disclosure policy was not viewed as being sufficiently consumer-friendly (Stevenson,
2006; Kane and Kane, 2001). Werner et al. (2009b), who look at post-acute care, find that
two out of three measures improve after public reporting. Along these lines, Werner
et al. (2012) show that public reporting leads to improvements both in quality and in
consumers choosing better-performing nursing homes in the US from 2001 to 2003. How-
ever, some sorting mechanism could also be a consequence of public reporting: Werner
et al. (2011) show that high-risk patients tend to choose nursing homes that have achieved
better results, whereas low-risk individuals rather choose low-scoring nursing homes.
Several channels might lead to quality improvements: First, that individuals choose better-
performing nursing homes (”voting-by-feet”). The increased competition may lead to
better quality (Werner et al., 2012). Grabowski and Town (2011), show using NHC that
quality only increases in those nursing homes facing competitive pressure. However, a
recent study on English nursing homes finds that competition reduces prices and quality
(Forder and Allan, 2014). Competition is not the focus of this study.
Second, that nursing homes learn about their relative rank in terms of quality compared
to others and may thus feel the need to improve. Third, better nursing homes may be
able to attract more investors or to negotiate higher prices with the nursing care funds
that may, again, increase quality. However, other mechanisms may be at work, too. In
Germany, bad quality nursing homes are evaluated more frequently, possibly increasing
the pressure to improve quality. Finally, reported quality might improve due to ”teaching
to the test” effects. Since nursing homes know the questions, they can prepare to score
in exactly these aspects. Lu (2012) shows that unobserved quality measures may not im-
prove, which gives rise to the ”multitasking theory.” If resources are scarce and mainly
put into the reported quality outcomes, less resources are left for the unobserved qual-
ity. Analogously, Werner et al. (2009a) provide some evidence for the improvement of
reported quality, whereas they, too, state that the effect on unreported measures may be
unclear. Lastly, in the US, the construction that residents only enter the quality measures
in NHC after a minimum length of stay leads to a higher number of rehospitalizations of
high-risk individuals before that threshold (Konetzka et al., 2013). Public reporting may
thus lead to selection.
2Quality increases also affect positively the financial performance of the improving nurs-
ing homes, independent of the former level (Park et al. (2011) using the 2002 NHC scores).
Looking at prices, Clement et al. (2012) find price and quality increases after NHC for low-
quality nursing homes only, while –using the new Five-Star-Rating– Hirth and Huang
(2014) show that the well-rated nursing homes increase prices more than low-level nurs-
ing homes after public reporting. They conclude that consumers are responsive to public
reporting, which can indeed enhance market efficiency.
In 2009, the Five-Star-Rating-System was introduced in the US and – similar to the Ger-
man CTA – aims at higher transparency and facilitation of the decision making process of
potential residents. Three aspects are included in the rating: health inspections, staffing,
and quality measures. However, the rating system has been under debate recently, since
only the health inspections are performed by the government, whereas the other two
are reported by the nursing homes themselves.1 This may lead to an overvaluation, as
the self-indicated reports are not audited by an external institution. In contrast to the
US system, the evaluation process of the German disclosure policy is carried out by an
independent institution. More detailed information can be found in Section 2.
Literature on nursing home quality in Germany is rather scarce. Some studies have ex-
amined the relationship between nursing home prices and quality (Mennicken, 2013; Re-
ichert and Stroka, 2014) or have investigated the remuneration rates in nursing homes
(Mennicken et al., 2014). Schmitz and Stroka (2014) analyze how consumers react to nurs-
ing home quality. The effect of higher transparency due to public reporting on nursing
home quality in Germany has not been analyzed yet.
We use a sample of more than 3,000 German nursing homes which had been evaluated at
least twice between 2009 and 2013. In analyzing the change in quality we focus on only
two to seven of the 64 quality indicators in the report cards – the two that measure out-
come quality and five more that are assumed to capture the “risk factors” shown below.
The remaining ones mainly measure processes and services and are arguably uninforma-
tive about quality. We find that nursing homes indeed perform significantly better in the
second wave than in the first.
1 Compare for a discussion, for example, New York Times, Oct. 2014, http://www.nytimes.com/
2014/10/07/business/medicare-alters-its-nursing-home-rating-system.html?_r=1
or http://www.medicare.gov/NursingHomeCompare/About/Ratings.html for more detailed
information.
3This paper contributes to the literature in the following ways: it is the first study that
measures the impact of higher transparency on the quality of German nursing homes
and hereby exploits the panel structure of the German quality reports for the first time. In
contrast to other studies, our constructed quality measures are mainly objective, do not
depend on supply-side or demand-side characteristics, and are based on evaluations by
an external institution (see discussion in Dranove et al., 2003 or Cutler et al., 2004).
This paper is organized as follows: Section 2 provides some information on the institu-
tional background of the German nursing care market and the introduction of the report
cards. Section 3 presents the data used. Section 4 analyzes changes in quality due to the
report cards while robustness checks are reported in Section 5. Section 6 concludes.
2 Institutional background and quality assessments
The organization of long-term care is a self-administrative issue. Contracts between
providers of the approximately 12,000 nursing homes and residents in need of care are
individually agreed on. In principle, there is no regulated upper limit for the price that
nursing homes may charge and nursing homes are to a large extent independent. How-
ever, prices cannot be set freely but result from a bargaining process between providers
and sickness funds (see Schmitz and Stroka, 2014). Nursing homes are mostly run by
non-profit (55%) or private (40%) institutions, while only 5% were public in 2009.
To ensure that all those in need can afford long-term care, the German long-term care
insurance is obligatory and directly linked to the health insurance system, implying that
almost everybody is covered by long-term care insurance (around 90 percent in the public
and 10 percent in the private system). Formal care is partly financed by the health plan
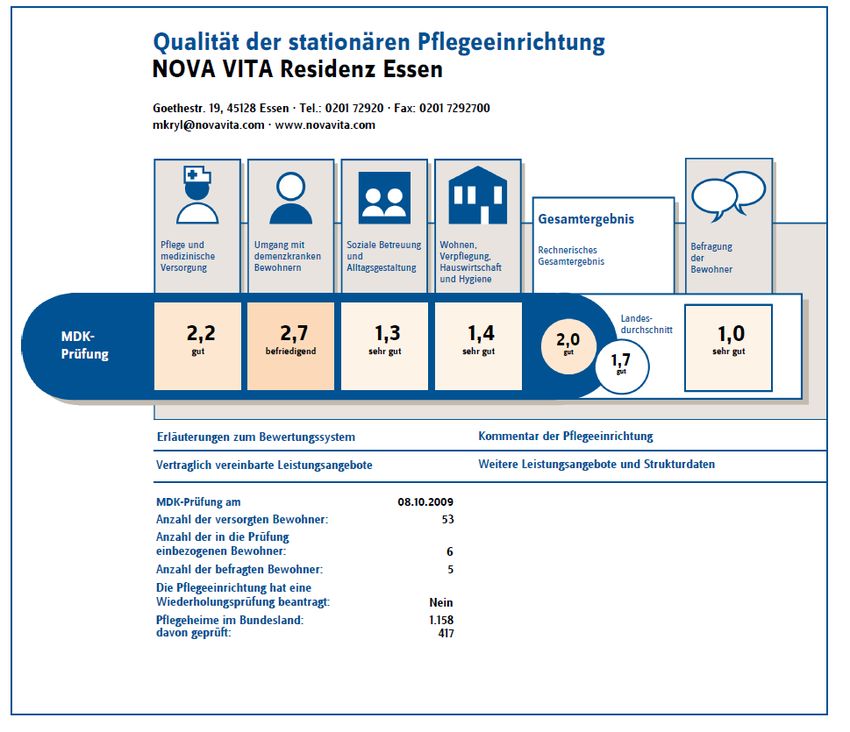
and partly out-of-pocket. For example, for the exemplary home in Figure A1 residents
have to pay an additional e1,252 (care level I) or e1,845 (care level III) per month on
top of the health plan’s coverage of e1,023 or e1,550, respectively, plus for any possible
further special services or wishes (for a deeper analysis compare Section 5).
42.1 Quality assessment in German nursing homes
The Medical Review Board of the German Statutory Health Insurance (MRB) is respon-
sible for monitoring quality in nursing homes, and as such serves as an external control
body. Prior to 2008, the social long-term care system did not address the issue of quality
reporting, as quality issues were dealt with bilaterally between the insurance and the ser-
vice provider. The flaws of this approach were: that 1) unannounced quality evaluations
by the MRB were not mandatory; and 2) the information was very difficult for the public
to access.
Since 2008, the “care transparency agreement (CTA)” (Pflege-Transparenzvereinbarung)2
has been helping individuals in need of nursing home care to make a more informed
nursing home choice. Comparability of nursing homes is guaranteed because the same
64 criteria are tested in all nursing homes and reporting of the results is standardized.
The results of each evaluation are published not only in online report cards3 but are also
displayed in the nursing homes.
Furthermore, as before, the implementation of the negotiated quality standards is obliga-
tory: nursing homes are supposed to be punished should they not meet the requirements.
However, the procedures are now more structured and follow specific guidelines. In this
new setting, for instance, nursing homes may be forced to improve their failed standards
until a repeated evaluation in the near future, where the fact that the nursing home had
been evaluated again due to issues in the first evaluation will also be marked on the up-
dated report card. We drop the two homes with replaced report cards from our data.
The evaluation is unannounced and undertaken by trained inspectors of the respective
regional MRB. All German nursing homes were finally tested at least once by the year
2011, followed by regular updates thereafter.
2 The public report cards were jointly set up by umbrella organizations of both health and long-term care
insurances and owners of nursing homes (Bundesarbeitsgemeinschaft der überörtlichen Träger der Sozialhilfe,
Bundesvereinigung der kommunalen Spitzenverbände, Vereinigung der Träger der Pflegeeinrichtungen and GKV-
Spitzenverband)(Central Organization of Care Insurance Funds, Associations of Care Institutions Sponsors
at Federal Level, Federal Working Group of the Non-Local Sponsors of Social Benefits, and the Federal
Association of Local Authority Central Organizations).
3 For instance, at www.pflegenoten.de, www.bkk-pflegefinder.de, or www.aok-pflegeheimnavigator.de.
52.2 Criteria and average grades in the report cards
The criteria of the report cards comprise a wide range of aspects such as quality of care,
handling of residents with dementia, quality of board and lodging, hygiene, as well as
cultural offers. The full list of questions is reported in Table A1 in the Appendix. Con-
sider, as an example, the most important criterion “Is the liquidity status of the resident
appropriate?.” The inspectors test on a subgroup of residents in the nursing home, say 10
people, whether this criterion is fulfilled and calculate the percentage of individuals for
whom it holds true. Then, the percentage value is translated into a grade according to the
German system of school grades from 1.0 (= excellent) to 5.0 (= inadequate or failed) (see
Table A2 in the Appendix for the mapping). The grades, not the exact percentage values,
are then published. Many criteria are actually comprised by binary indicators (e.g. “Is
there a systematic pain assessment?”, where 1.0 stands for yes and 5.0 for no).
Since comparisons over 64 grades is rather difficult, an overall grade of the nursing home
is generated by calculating an average of all single grades. Compare Figure A1 in the
Appendix for a showcase report card which includes the overall grade and grades of four
subgroups.
While there is no doubt that aggregation strongly facilitates the comparison, the aggre-
gation method is subject to a great deal of critique among nursing scientists (see, e.g.,
Hasseler and Wolf-Ostermann, 2010). First, the mapping into school grades is arbitrary.
It is highly disputable that fulfilling a criterion which is supposed to be standard for good
quality only in, say, 75 per cent of all cases is a “good” quality (grade of 2.3, which repre-
sents a “good” in the German system). This obviously reflects the fact that the mapping
is the result of an extensive bargaining process between the MRB and the nursing home
owners before the care transparency agreement became effective. Second, averaging all
64 grades into the overall grade is problematic. More important criteria like outcome
quality measures get the same weight as arguably less decisive factors like the offer of
cultural activities in the nursing home. Apart from that, there is the critique that too
much process and structural quality is measured but too little outcome quality (Hasseler
and Wolf-Ostermann, 2010). Thus, we are sceptical of the content of the officially aggre-
gated grades. That being said, we are nevertheless confident that the reports include a
6lot of information on the quality of nursing homes, which we exploit to construct grades
that reflect the true quality of care.
2.3 Extracting quality information from the report cards
In order to assess true quality improvement, we construct two quality indicators using
single items from the reports. In defining our main quality indicator we use the only two
outcome quality criteria among the 64 grades. These are the following (questions 15 and
18 in the report cards, see Table A1, own translations from German):
1. Is the nutritional status appropriate given the conditions set by the institution?
2. Is the supply of fluids appropriate given the conditions set by the institution?
In addition, we acknowledge that only a grade of 1.0 (excellent) implies that the criterion
is fulfilled for all residents, truly reflecting a good quality of care. Therefore, we define
binary indicators q j for criterion j equaling one if and only if the criterion is fulfilled for all
tested residents (grade 1.0) and zero if the grade is worse, meaning that it is not fulfilled
for at least some residents:
1 if grade = 1.0
j
qk =
0 if grade > 1.0
j
We then define the quality indicator as
2
1
Outcome quality =
2 ∑ qj j = 1, 2
j =1
Among all grades we consider Nutritional and liquid status as most important for the qual-
ity of care in a nursing home. Moreover, we argue that these are not easily manipulated
in the short run for the mere purpose of an evaluation. We thereby address the poten-
tial issue that nursing homes might rather improve simple or cheap aspects which are,
however, irrelevant for care quality, to increase the grade average.
In addition, we define a second indicator, measuring general quality of care. For this we
follow the definition of Hasseler and Wolf-Ostermann (2010) and only use the seven “risk
7criteria” instead of the full number of available grades to define an aggregate measure of
quality of care in a nursing home:4
1. Is the nutritional status appropriate given the conditions set by the institution?
2. Is the supply of fluids appropriate given the conditions set by the institution?
3. Are documents regarding the treatment of chronic wounds or bedsores analyzed
and, if necessary, the measures adjusted?
4. Are systematic pain assessments conducted?
5. Are individual risks and resources of residents with incontinence or a bladder catheter
assessed?
6. Is the individual risk of contracture collected?
7. Do measures restricting the individual freedom require consent?
According to Hasseler and Wolf-Ostermann (2010), risk criteria are “factors that, when
left unattended, affect the health and quality of life of individuals independent of the
affliction.” (own translation of their originally German definition). We use a second indi-
cator spanning all seven risk criteria, defined as
1 7
Care quality = ∑ qk k = 1, . . . , 7
7 k =1
which is the share of ones among all seven criteria and called Care quality5 .
While we do believe in the content of Care quality, it might be problematic as some of the
indicators could be quickly improved without actually improving the true quality. Hence,
Outcome quality is the preferred measure of quality.
4 These are criteria 11, 15, 18, 20, 22, 27, 29 (order changed here). Note that 15 and 18 are the two outcome
quality indicators also previously used. The care transparency agreement of December 17, 2008 scheduled
a scientific evaluation of the report cards. An advisory board mainly composed of nursing and health
scientists lead by Martina Hasseler and Karin Wolf-Ostermann was in charge of critically evaluating the
report cards and making suggestions for improvement in future years. We follow some of their arguments
published in the final report (Hasseler and Wolf-Ostermann, 2010).
5 In order to avoid potential bias due to missing values, Care quality is redefined, as question numbers
11 and 29 have a high number of missing values: for the first wave, question 11 has about 1,255 missing
values and question 29 has 674. For the second wave, there are 1,434 (question 11) and 801 (question 29)
missing values. Therefore, if one or both of them is a missing value, the share accordingly reduces to
( 60 ; 16 ; . . . ; 56 ; 66 ) and ( 05 ; 51 ; . . . ; 55 ), respectively. These outcomes are then mapped on the original scale to the
closest neighboring value.
83 Data and descriptive statistics
3.1 Report cards
The unit of observation is the nursing home. We merge three data sets: the report cards
of German nursing homes, additional pricing information for 2009, and regional infor-
mation at county level. The report cards are available online for all nursing homes in
Germany, which amount to about 12,000. However, for the first wave, we only have ac-
cess to a random sample of roughly 5,000 nursing homes and no price information. We
thus add the latter from the nursing database PAULA (Pflege Angebot und Leistungsan-
bieter (2010), data of the BKK Bundesverband). We exclude nursing homes only provid-
ing short-term and out-patient care and care for children and disabled individuals. We
also exclude nursing homes that are specialized in only treating residents suffering from
dementia. Various special homes such as care for residents with apallic conditions, mul-
tiple sclerosis, or stroke residents are also dropped. Finally, we exclude nursing homes
with less than 10 residents. Thus, we only focus on general long-term care. As we want to
exploit the panel structure, we only include homes that were observed in both waves. In
total, we end up with 6,176 nursing home-year observations, 3,088 observations for each
wave. The nursing homes have been evaluated at different points in time: 2,769 in 2009
and 319 in 2010 in the first wave, 135 in 2011, 2,670 in 2012, and 283 in 2013 in the second
wave (see Figure 1).
Figure 1: Number of observations at quarter of evaluation
1st evaluation 2nd evaluation
1000
900
# Obs. Nursing Homes
800
700
600
500
400
300
200
100
0
2009 q1
2009 q3
2010 q1
2010 q3
2011 q1
2011 q3
2012 q1
2012 q3
2013 q1
Quarter of Evaluation
9Table 1 reports the descriptive statistics of the two quality measures in the first and the
second wave separately. In both cases it can be seen that nursing homes have improved
over time.
Table 1: Descriptives: Constructed quality measures in 1st and 2nd evaluation
Variable Mean Std. Dev. Min. Max.
1st Evaluation Outcome Quality 0.799 0.328 0 1
Care Quality 0.582 0.257 0 1
2nd Evaluation Outcome Quality 0.912 0.216 0 1
Care Quality 0.739 0.219 0 1
Number of observations: 3,088 each wave. Sources: Care quality and outcome quality: own
calculations using data from the transparency reports.
In the first evaluation, only 80 percent of the nursing homes manage to fulfil both, the
provision with sufficient nutrition and with liquids, of all selected inhabitants. Care qual-
ity can also be considered as moderate in the first evaluation, as roughly 58 percent of the
seven relevant criteria are fulfilled, and only 347 out of a total of 3,088 nursing homes ful-
fil all care quality criteria (not shown in the table). In the second wave, the nursing homes
achieve better results across all criteria: outcome quality increases to 91 percent and the
number of nursing homes which fulfil all seven care quality criteria more than doubles
to 750. On average, nursing homes now fulfil 74 percent of the care criteria, which is
equivalent to meeting five of the seven requirements.
3.2 Regional characteristics at county level
Socio-economic control variables measured at the county level are taken from the Fed-
eral Office for Building and Regional Planning (INKAR) for the years 2009 to 2011 (only
these two years are available) and we match the first wave to 2009 and the second to 2011.
Descriptive statistics in Table 2 show that in our sample, on average, net household in-
come amounts to roughly e1,530 per month. Furthermore, population and nursing-care
specific factors are included, such as the share of elderly above 65 years old, the ratio of
care benefit receivers to people in need of care, and the amount of the average pension
payment per month. The average pension payment per month of men (e1,073) is almost
twice as high as the women’s pensions (e566). Finally, the percentage of a particular
10county defined as rural as well as federal state dummies are also included in our main
regressions.
Table 2: Descriptives: Regional characteristics
Variable Mean Std. Dev. Min. Max.
Household income [in 1,000 EUR] 1.51 0.199 1.082 2.45
Share of population 65+ 0.209 0.023 0.15 0.285
Ppl in need of care [per 10,000 inhab.] 302.189 61.324 154.8 542.6
Recipients LTC allowance per ppl in need 0.457 0.064 0.275 0.692
Pension Payment (m) [in 1,000 EUR] 1.047 0.08 0.829 1.332
Pension Payment (f) [in 1,000 EUR] 0.558 0.1 0.37 0.796
Share of county defined as rural 0.205 0.251 0 1
Physicians per 10,000 inhab. 16.658 5.2 8.239 39.185
Land price [EUR/m ] 2 156.201 143.563 4.748 1076.682
Number of observations: 6,176. Source: Information on county level from INKAR, years 2009
and 2011. Euro values deflated to base year 2009.
4 Quality responses to the transparency reform
4.1 Estimation strategy
We postulate that the transparency reform, especially public reporting, has a positive
impact on the suppliers’ behavior, incentivizing them to put more effort into improving
quality. Thus, in our empirical analysis, we are mostly interested in the change in qual-
ity measures between the first and the second wave of published report cards. As the
transparency reform is applied to all German nursing homes, the analysis is essentially a
before-and-after comparison. We assume that the first evaluation measures the baseline
quality that would have also been prevalent – but not measured and published – without
the report cards. Reactions to the publications should be visible in the second evaluation.
We estimate the following linear model:
qualityit = β 0 + β 1 2nd evaluationit + Xit δ + τt + λ FSi + ε it (1)
where qualityit is either Outcome quality or Care quality. The main explanatory variable
of interest is 2nd evaluation which is a dummy variable equalling one in the second wave
11and zero in the first. As we also include year fixed effects τt , β 1 measures the discontin-
uous jump in quality between both waves. The year fixed effects are supposed to mainly
capture the learning effects of the evaluators over time. The results below do not change
if a linear trend or no time trend at all are included instead. Xit is a vector containing
the information on county level shown in Table 2 and λ FSi contains 15 federal state fixed
effects. Standard errors are clustered on nursing home level.
To identify the effects of the reform on quality, we need two main assumptions.
1. Without public reporting, the nursing homes would not have changed their quality.
2. The indicator qualityit indeed measures the quality of nursing homes. That is,
changes in the outcome variable reflect true quality changes.
4.2 Results
Table 3 reports the regression results. At the second evaluation, nursing homes have, on
average, improved their outcome quality (sufficient provision with liquids and nutrition)
by 0.125. This is equivalent to the case where 12.5 percent of all nursing homes did not
satisfy the sufficient nutritional and liquid requirements during the first evaluation and
changed this in the meantime. Regarding care quality, the transparency reform led to
an improvement by 13.5 percentage points, which is equal to roughly one additionally
fulfilled criterion out of seven per nursing home (since 1/7 = 0.143). Considering the
fact that about 350 nursing homes had fulfilled all criteria in the first wave, this number
even more than doubled at the second evaluation to 750. Nursing homes seem to have
improved in several aspects, as the number of those fulfilling none of the seven crite-
ria decreased from 74 to merely six in the course of the transparency reform, whereas
the number of nursing homes fulfilling six out of seven criteria increased from 452 (1st
evaluation) to 856 (2nd evaluation).
The coefficient of the indicator for year 2010 (Year 2010) is significantly positive, which
means that within the first wave nursing homes which were evaluated first perform
worse than nursing homes which were evaluated later. This pattern does not occur for
the second wave.
12Table 3: Regression results
(1) (2)
Outcome Quality Care quality
2nd evaluation 0.123∗∗∗ 0.133∗∗∗
(0.016) (0.017)
Evaluated in 2010 0.066∗∗∗ 0.056∗∗∗
(0.017) (0.013)
Evaluated in 2012 -0.017 0.009
(0.015) (0.017)
Evaluated in 2013 0.012 0.049∗∗
(0.019) (0.021)
Household income [in 1,000 EUR] 0.002 -0.006
(0.030) (0.025)
Share of population 65+ 0.342 0.400∗∗
(0.224) (0.195)
Recipients LTC allowance per ppl in need 0.066 0.296∗∗∗
(0.089) (0.076)
Pension Payment (m) [in 1,000 EUR] -0.123 -0.233∗∗∗
(0.076) (0.063)
Pension Payment (f) [in 1,000 EUR] -0.082 0.028
(0.105) (0.087)
Share of county defined as rural -0.004 -0.054∗∗∗
(0.024) (0.021)
Constant 0.895∗∗∗ 0.599∗∗∗
(0.102) (0.083)
Federal States FE Yes Yes
N 6176 6176
R2 0.10 0.24
Significance levels: ∗ pThe regional characteristics do not explain much of the variation in nursing home quality,
especially as federal state fixed effects are included. A higher quality can be found in
counties with a higher share of elderly and of benefit receivers and with lower pension
payment for men given the household income and only looking at care quality.
Summing up, both grades show a significant improvement between both waves. Hence,
nursing homes react to the once-experienced unannounced evaluation by offering better
quality. Certainly, it is not clear whether the effect stems from some kind of “teaching
to the test” phenomenon, such that nursing homes only improve in exactly those criteria
which they know will be checked (Lu, 2012). However, we argue that even if this were
the case, this would still be an improvement in very important quality criteria (seven
risk factors and in particular the nutritional and liquid status of residents) and, therefore,
beneficial to residents. Public reporting, therefore, may serve as an instrument in order
to steer care providers toward investing in better quality, as they do react to the public
provision of quality information.
5 Robustness checks
5.1 Accounting for the size and the price of a nursing home
Potentially, the quality of a nursing home also depends on its size and its price level.
However, these two variables are possibly endogenous due to reversed causality (prices
and demand, thus, size in the long run, depend on the nursing home’s quality). In prin-
ciple it is, therefore, preferred to leave them out of the regression model as long as both
potentially endogenous variables are uncorrelated with the main explanatory variable.
In a robustness check, we include both price and size in the linear regression and estimate
IV models where both are instrumented separately. Note, however, that the indicator for
the second evaluation is not instrumented as this is unlikely to be endogenous. The main
aim of this analysis is to test whether the results from the previous section are robust to
including these two variables.
Table A3 in the Appendix shows descriptive statistics of the endogenous variables. The
number of residents is around 80 on average (ranging from 10 to 812). Depending on
14the care level, the social LTC insurance covers only part of the total care costs. Thus, we
include the personal contribution of the price individuals have to pay out-of-pocket, since
this is the relevant price from the demanders’ point of view. The long-term care insurance
covers, for example in North-Rhine Westphalia in 2013, between e1,023 (care level I) and
e1,550 (care level III) per month. Individuals have to pay additionally roughly e1,095 on
average out-of-pocket, with a minimum of e142 and a maximum amount of e2,285 per
month. Although prices depend on the resident’s care level, we use simple mean prices
per home instead, as we do not have information on the distribution of the various care
levels in each nursing home.
Here, we drop all 319 nursing homes evaluated in 2010 and 783 in total due to missing
price information. Prices are deflated, using 2009 as the base year.
To account for possible reverse causality, we instrument the number of residents and
the out-of-pocket price separately by two instruments: the number of physicians per
10,000 inhabitants and the average land price in the respective county. Physician den-
sity is strongly correlated with the number of residents and the nursing home price, since
physicians are more likely to settle in higher populated areas and it is more attractive
and more expensive to live in urban than in rural areas. However, there should not be a
direct effect of the number of physicians on nursing home quality. The same applies to
land price, which is highly correlated with the nursing home prices and the number of
residents, as more popular areas are generally more expensive and more attractive, but
land price should not have a direct effect on nursing home quality.
Table 4 summarizes the results for both quality measures. The first column (1) repeats the
main results from Table 3. Columns (2) to (4) show the extended models, (2) including
the endogenous variables without instrumenting them, (3) instrumenting the number of
residents and excluding price information, and finally (4) instrumenting price, excluding
the number of residents. The same estimations are performed for care quality. As can be
seen, the positive effects of the second evaluation do not differ much in terms of mag-
nitude and significance, and thereby remain robust throughout all estimation strategies.
The full estimation results in Table A4 report that size and prices are not significant once
they are instrumented.
15Table 4: Overview of main results (OLS) versus three robustness checks
(1) (2) (3) (4)
OLS w/o OLS including IV including IV including
size and price size and price size price
Outcome quality
2nd evaluation 0.123∗∗∗ 0.108∗∗∗ 0.111∗∗∗ 0.116∗∗∗
(0.016) (0.016) (0.018) (0.020)
F-test 1st stage - - 18.52 29.74
Care quality
2nd evaluation 0.133∗∗∗ 0.122∗∗∗ 0.125∗∗∗ 0.122∗∗∗
(0.017) (0.017) (0.020) (0.021)
F-test 1st stage - - 18.52 29.74
County level controls yes yes yes yes
Year and federal state FE yes yes yes yes
Number of observations in each regression: 6,176 (3,088 each wave). Significance levels: ∗ pGerman nursing homes. We use a random sample of more than 3,000 German nursing
homes evaluated twice between 2009 and 2013. Our results show that the higher trans-
parency indeed has a positive impact on the reported quality of nursing homes. The
evaluated nursing homes, on average, increased their performance by one out of seven
grade units from the first to the second evaluation.
This can be seen as a positive effect of the transparency reform. However, it remains
unclear whether this is just a “teaching to the test” effect or not. We argue that, even if
this were the case, it is an indication of the reform’s success as improvements in the two
outcome quality indicators are certainly beneficial for the residents. This holds as long as
nursing homes do not shift resources away from other important but not tested outcomes.
Similar to the US, the evaluation process is subject to current debates, as the average
grades could be misleading due to a potential overvaluation. However, the reasons for the
debates in the two countries differ. While the Five Star Rating suffers from self-reporting,
the German averages may hide specific quality issues. The most important single indi-
cators are reported but hard to identify in the report cards and individuals looking for
suitable nursing homes may focus on the easy to interpret overall grade. Moreover, the
chosen increments of each grade, which reflect the result of a bargaining process between
insurance companies and nursing homes, are too good, on average (see the discussion
in Section 2). Hence, several adjustments still need to be made. We argue that the vast
majority of indicators cannot be used to measure quality – only seven indicators can.
Note, however, that we do not make any statement about the current level of the quality
in German nursing homes, only on changes.
Therefore, the report cards should be strongly revised to include many more outcome
quality indicators and indicators of quality of life of the residents. Moreover, the mapping
from indicators to grades should be more realistic, meaning that poor quality should not
be labelled “good” or even “very good.” The results of this study allow us to infer that
such a reform would most likely lead to quality improvements in the German nursing
home sector.
17References
Arrow, J. (1963). Uncertainty and the welfare economics of medical care. American Eco-
nomic Review, 53(5):941–973.
Baum, C. F., Schaffer, M. E., and Stillman, S. (2002). IVREG2: Stata module for extended
instrumental variables/2SLS and GMM estimation. Statistical Software Components,
Boston College Department of Economics.
Busse, R., Nimptsch, U., and Mansky, T. (2009). Measuring, monitoring, and managing
quality in Germany’s hospitals. Health Affairs, 28(2):294–304.
Clement, J. P., Bazzoli, G. J., and Zhao, M. (2012). Nursing home price and quality re-
sponses to publicly reported quality information. Health Services Research, 47(1pt1):86–
105.
Cutler, D. M., Ilckman, R. S., and Landrum, M. B. (2004). The role of information in med-
ical markets: An analysis of publicly reported outcomes in cardiac surgery. American
Economic Review, 94(2):342–346.
Dranove, D., Kessler, D., Mcclellan, M., and Satterthwaite, M. (2003). Is more information
better? The effects of report cards on health care providers. The Journal of Political
Economy, pages 555–588.
Dziuban, S. W., McIlduff, J. B., Miller, S. J., and Col, R. H. (1994). How a New York cardiac
surgery program uses outcomes data. The Annals of Thoracic Surgery, 58(6):1871–1876.
Thirty-first Annual Meeting of The Society of Thoracic Surgeons.
Filistrucchi, L. and Ozbugday, F. (2012). Mandatory quality disclosure and quality sup-
ply: Evidence from German hospitals. Discussion Paper 2012-031, Tilburg University,
Tilburg Law and Economic Center.
Forder, J. and Allan, S. (2014). The impact of competition on quality and prices in the
English care homes market. Journal of Health Economics, 34:73–83.
Friberg, R. and Grönqvist, E. (2012). Do expert reviews affect the demand for wine?
American Economic Journal: Applied Economics, 4(1):193–211.
18Grabowski, D. C. and Town, R. J. (2011). Does information matter? Competition, quality,
and the impact of nursing home report cards. Health Services Research, 46(6pt1):1698–
1719.
Hasseler, M. and Wolf-Ostermann, K. (2010). Stärken und Schwächen. Pflege-
Transparenzvereinbarung. Altenheim, 49(9):30–33.
Hirth, R. A. and Huang, S. S. (Oct. 2014). Quality rating and private prices: Evidence
from the nursing home industry. mimeo.
Kane, R. L. and Kane, R. A. (2001). What older people want from long-term care, and
how they can get it. Health Affairs, 20(6):114–127.
Konetzka, R. T., Polsky, D., and Werner, R. M. (2013). Shipping out instead of shaping
up: Rehospitalization from nursing homes as an unintended effect of public reporting.
Journal of Health Economics, 32(2):341 – 352.
Laschober, M., Maxfield, M., Felt-Lisk, S., and Miranda, D. J. (2007). Hospital response to
public reporting of quality indicators. Health Care Financing Review, 28(3):61–76.
Lu, S. F. (2012). Multitasking, information disclosure, and product quality: Evidence from
nursing homes. Journal of Economics & Management Strategy, 21(3):673–705.
Mennicken, R. (2013). Prices and quality in nursing homes - first empirical results for
Germany. Gesundheitswesen, 75(2):99–101.
Mennicken, R., Augurzky, B., Rothgang, H., and Wasem, J. (2014). Explaining differ-
ences in remuneration rates of nursing homes in Germany. European Journal of Health
Economics, 15:401–410.
Mukamel, D. B., Weimer, D. L., Spector, W. D., Ladd, H., and Zinn, J. S. (2008). Publica-
tion of quality report cards and trends in reported quality measures in nursing homes.
Health Services Research, 43(4):1244 – 1262.
Nielsen, K. (2006). Is the quality and cost of food affected if industrially produced trans
fatty acids are removed? Atherosclerosis Supplements, 7(2):61–62. First International
Symposium on Trans Fatty Acids and Health Rungstedgaard, Rungsted Kyst, Den-
mark.
19Park, J., Konetzka, R. T., and Werner, R. M. (2011). Performing well on nursing home
report cards: Does it pay off? Health Services Research, 46(2):531–554.
Park, J. and Werner, R. M. (2011). Changes in the relationship between nursing home
financial performance and quality of care under public reporting. Health Economics,
20(7):783–801.
Pham, H. H., Coughlan, J., and O’Malley, A. S. (2006). The impact of quality-reporting
programs on hospital operations. Health Affairs, 25(5):1412–1422.
Reichert, A. R. and Stroka, M. A. (2014). Nursing home prices and quality of care: Evi-
dence from administrative data. Ruhr Economic Papers 470, RWI, Essen.
Reinstein, D. A. and Snyder, C. M. (2005). The influence of expert reviews on consumer
demand for experience goods: A case study of movie critics. The Journal of Industrial
Economics, 53(1):27–51.
Renzi, C., Sorge, C., Fusco, D., Agabiti, N., Davoli, M., and Perucci, C. A. (2012). Reporting
of quality indicators and improvement in hospital performance: The p.re.val.e. regional
outcome evaluation program. Health Services Research, 47(5):1880–1901.
Schmitz, H. and Stroka, M. A. (2014). Do elderly choose nursing homes by quality, price
or location? Ruhr Economic Papers No. 495.
Stake, J. E. (2006). The interplay between law school rankings, reputations, and resource
allocation: Ways rankings mislead. Indiana Law Journal, Symposium on the Next Genera-
tion of Law School Rankings, 81(5):229.
Stevenson, D. G. (2006). Is a public reporting approach appropriate for nursing home
care? Journal of Health Politics, Policy and Law, 31(4):773–810.
Tscharnke, K. (2009). Pflegeskandal: Diakonie um Schadensbegrenzung bemüht.
http://www.merkur-online.de/aktuelles/bayern/mm-pflegeskandal-diakonie-
schadensbegrenzung-bemueht-304025.html. Merkur-Online, May 19 2009.
Werner, R. M., Konetzka, R. T., and Kruse, G. B. (2009a). Impact of public reporting on
unreported quality of care. Health Services Research, 44(2p1):379–398.
20Werner, R. M., Konetzka, R. T., Stuart, E. A., Norton, E. C., Polsky, D., and Park, J.
(2009b). Impact of public reporting on quality of postacute care. Health Services Re-
search, 44(4):1169–1187.
Werner, R. M., Konetzka, R. T., Stuart, E. A., and Polsky, D. (2011). Changes in patient sort-
ing to nursing homes under public reporting: Improved patient matching or provider
gaming? Health Services Research, 46(2):555–571.
Werner, R. M., Norton, E. C., Konetzka, R. T., and Polsky, D. (2012). Do consumers re-
spond to publicly reported quality information? Evidence from nursing homes. Journal
of Health Economics, 31(1):50–61.
21Appendix
Figure A1: Example of a report card (first page)
Quality of nursing home
Overall result
Social care
Treatment and the Board and Patient
Care and of patients arrangement lodging, questio-
medical care with of the daily hygiene nnaire
dementia routine
State
average
good excellent
Evaluation satisfactory excellent excellent good
good
Source: www.pflegenoten.de. Own translations to English. Only the first page
is shown. The remaining pages include all 64 single criteria.
22Table A1: Full list of report card questions
Area 1: Nursing and medical care
[1] Is an active communication with a physician comprehensible if required?
[2] Does the application of the nursing treatments correspond to the physician’s orders?
[3] Does the supply of medicines correspond to the physician’s orders?
[4] Is the use of medicines appropriate?
[5] Are compression stockings put on properly?
[6] Is the individual pressure sore risk being assessed?
[7] Are pressure ulcer prevention measures being applied?
[8] Are place and time at which the chronic wound/pressure ulcer occurred verifiable?
[9] Is a differentiated documentation in case of chronic wounds or pressure ulcer being carried out
(in terms of actuality, verifiability of development, size, position, depth)?
[10] Are the applied measures to treat chronic wounds or pressure ulcer based on state-of-the-art
knowledge?
[11] Are documents regarding the treatment of chronic wounds or bedsores analyzed and, if necessary,
the measures adjusted?
[12] Do residents with chronic pains receive the prescribed medication?
[13] Are individual nutritional resources and risks documented?
[14] Are necessary measures taken in case of restrictions regarding independent supply of food?
[15] Is the nutritional status appropriate given the conditions set by the institution?
[16] Are individual resources and risks regarding the supply of fluids documented?
[17] Are necessary measures taken in case of restrictions regarding independent supply of fluids?
[18] Is the supply of fluids appropriate given the conditions set by the institution?
[19] Is the sense of taste of residents with feeding tubes being stimulated?
[20] Are systematic pain assessments conducted?
[21] Does the nursing home cooperate closely with the treating physician?
[22] Are individual risks and resources of residents with incontinence or a bladder catheter assessed?
[23] Are necessary measures for residents with incontinence or a bladder catheter taken?
[24] Is the individual risk of falling assessed?
[25] Are fall incidents being documented?
[26] Are necessary prophylaxes against fall incidents taken?
[27] Is the individual risk of contracture collected?
[28] Are necessary contracture prophylaxes taken?
[29] Do measures restricting the individual freedom require consent?
[30] Is the necessity of freedom restricting measures checked regularly?
[31] Are individual needs and habits of the residents regarding personal hygiene taken into account
and being carried out accordingly?
[32] Are individual needs and habits of the residents regarding oral and dental hygiene taken into
account and being carried out accordingly?
[33] Is nursing care usually being carried out by the same nurse?
[34] Are workers regularly trained regarding First Aid and emergency measures?
[35] Do written procedural instructions regarding First Aid and emergency measures exist?
Area 2: Care of residents suffering dementia
[36] Is the biography of residents suffering dementia taken into account and being considered when
planning daily activities?
[37] Are accompanying and caring persons of residents suffering dementia incorporated into the nurs-
ing and caring process?
[38] Is self-determinantion of residents suffering dementia taken into account in the nursing and car-
ing process?
[39] Is well-being of residents suffering dementia determined and documented, and appropriate mea-
sures for improvement deducted from that information?
Continued on next page
23Table A1 – Continued
[40] Do suitable exercise and recreational areas for particular target groups exist (at night time also) ?
[41] Do secured recreational areas outside exist?
[42] Do identification facilitating arrangements regarding design of surroundings exist in rooms and
recreation rooms?
[43] Are individual guidance measures, e.g. photographs, used?
[44] Are residents suffering dementia offered adequate activities, e.g. regarding exercise, communica-
tion, or perception?
[45] Are residents suffering dementia offered suitable food?
Area 3:Social care and the arrangement of the daily routine
[46] As part of social care, is group counseling available?
[47] As part of social care, is individual counseling available?
[48] Does the nursing home have annual celebrations?
[49] Are there activities together with the local community?
[50] Are there measures to promote contact with relatives?
[51] Are the social care measures justified by the residents’ composition and needs?
[52] Is assistance or information provided to familiarize new residents with the nursing facility (e.g.,
contact person, support during the orientation, assessment interviews after six weeks)?
[53] Is the orientation phase systematically evaluated?
[54] Are there guidelines with respect to the provision of terminal care?
[55] Does the nursing facility have a system for managing complaints?
Area 4: Accommodation, provision, household management, and hygiene
[56] Are residents allowed to decorate and design their rooms with their own furniture, personal
effects, and memorabilia?
[57] Do residents have a say in the design and decoration of the communal areas?
[58] Does the facility give a good overall impression in terms of cleanliness and hygiene? For example,
does it appear clean? Is it in order? Are there unpleasant odors?
[59] Within a specified time slot, are residents free to choose when to eat?
[60] Is appropriate food provided for people with special dietary requirements (e.g., residents with
diabetes)?
[61] Is the food plan made available to the residents in a legible format?
[62] Is the presentation of food and drinks tailored to the needs of each individual resident? For
example, to facilitate eating and digestion, some residents require food to be precut into smaller
pieces or pureed.
[63] Are the portions tailored to the preferences of the residents?
[64] Are the food and drinks for the residents provided in a pleasant environment and relaxing atmo-
sphere?
Note: Outcome and risk criteria highlighted.
24Table A2: Mapping of grades
Category Grade Percentage range Category Grade Percentage range
1.0 97.4 - 100.0 3.5 57.6 - 58.9
excellent 1.1 94.8 - 97.3 3.6 56.2 - 57.5
quality 1.2 92.2 - 94.7 3.7 54.8 - 56.1
(sehr 1.3 89.6 - 92.1 poor 3.8 53.4 - 54.7
gut) 1.4 87.0 - 89.5 quality 3.9 52.0 - 53.3
4.0 50.6 - 51.9
1.5 85.6 - 86.9 4.1 49.2 - 50.5
1.6 84.2 - 85.5 4.2 47.8 - 49.1
1.7 82.8 - 84.1 4.3 46.4 - 47.7
good 1.8 81.4 - 82.7 4.4 45.0 - 46.3
quality 1.9 80.0 - 81.3
2.0 78.6 - 79.9 4.5 43.6 - 44.9
2.1 77.2 - 78.5 4.6 42.2 - 43.5
2.2 75.8 - 77.1 failed 4.7 40.8 - 42.1
2.3 74.4 - 75.7 4.8 39.4 - 40.7
2.4 73.0 - 74.3 4.9 38.0 - 39.3
5.0 0.0 - 37.9
2.5 71.6 - 72.9
2.6 70.2 - 71.5
2.7 68.8 - 70.1
2.8 67.4 - 68.7
fair 2.9 66.0 - 67.3
quality 3.0 64.6 - 65.9
3.1 63.2 - 64.5
3.2 61.8 - 63.1
3.3 60.4 - 61.7
3.4 59.0 - 60.3
Source: Pflege-Transparenzvereinbarung, Appendix 2. http://www.
vdek.com/vertragspartner/Pflegeversicherung/grundlagen/
transparenzvereinbarung.html. Own translation into English.
Table A3: Descriptives: endogenous explanatory variables:
Variable Mean Std. Dev. Min. Max.
1st Evaluation Personal Contribution 1081.728 311.628 150.14 3574.375
Overall NH Fees 2339.061 311.628 1407.473 4831.708
# Residents 81.901 46.606 10 811
N 2,505
2nd Evaluation Personal Contribution 1114.153 344.075 141.761 4214.230
Overall NH Fees 2330.402 344.446 1349.164 5431.292
# Residents 83.337 46.559 10 812
N 2,888
Source: Transparency reports. Information given on nursing home level. Prices are deflated.
Base year = 2009. Overall nursing home fees reported for completeness but not used in the
regression analysis.
25Table A4: Effect on outcome quality and care quality: Possibly endogenous factors instrumented
(1) (2) (3) (4) (5) (6)
Outcome qual. Outcome qual. Outcome qual. Care qual. Care qual. Care qual.
2nd evaluation 0.108∗∗∗ 0.111∗∗∗ 0.116∗∗∗ 0.122∗∗∗ 0.125∗∗∗ 0.122∗∗∗
(0.018) (0.018) (0.020) (0.020) (0.020) (0.021)
Log(Personal Contribution) 0.057∗∗∗ -0.118 0.077∗∗∗ 0.051
(0.020) (0.171) (0.017) (0.140)
Log(# residents) -0.054∗∗∗ -0.046 -0.059∗∗∗ 0.025
(0.006) (0.068) (0.006) (0.058)
Evaluated in 2012 -0.003 -0.004 -0.008 0.017 0.012 0.013
(0.017) (0.018) (0.017) (0.020) (0.020) (0.020)
Evaluated in 2013 0.024 0.024 0.023 0.054∗∗ 0.053∗∗ 0.053∗∗
(0.021) (0.020) (0.021) (0.024) (0.024) (0.023)
Household income [in 1,000 EUR] -0.007 0.001 0.023 -0.016 0.011 -0.000
(0.032) (0.035) (0.037) (0.026) (0.029) (0.031)
Share of population 65+ 0.570∗∗ 0.486 ∗∗ 0.298 0.682∗∗∗ 0.528 ∗∗ 0.613∗∗
(0.227) (0.228) (0.330) (0.198) (0.209) (0.279)
Recipients LTC allowance 0.078 0.098 0.131 0.291∗∗∗ 0.298 ∗∗∗ 0.285∗∗∗
26
per ppl in need (0.094) (0.095) (0.117) (0.079) (0.083) (0.097)
Pension Payment (m) [in 1,000 EUR] -0.113 -0.115 -0.127 -0.200∗∗∗ -0.227∗∗∗ -0.220∗∗∗
(0.080) (0.083) (0.081) (0.066) (0.072) (0.068)
Pension Payment (f) [in 1,000 EUR] 0.035 0.061 0.068 0.104 0.017 0.023
(0.106) (0.148) (0.157) (0.087) (0.126) (0.126)
Share of county defined as rural -0.006 -0.007 -0.007 -0.054∗∗ -0.047 ∗∗ -0.048∗∗
(0.024) (0.026) (0.026) (0.021) (0.023) (0.022)
Constant 0.622∗∗∗ 0.981∗∗∗ 1.630 0.194 0.444 ∗∗ 0.177
(0.173) (0.250) (1.170) (0.143) (0.210) (0.960)
Federal States FE Yes Yes Yes Yes Yes Yes
N 5391 5391 5391 5391 5391 5391
R2 0.11 0.11 0.09 0.27 0.24 0.25
F first stage 18.52 29.74 18.54 29.74
Significance levels: ∗ p< 0.1, ∗∗ p< 0.05, ∗∗∗ p< 0.01. Standard errors clustered on nursing home level. Outcome quality: (1) OLS with both endog
vars, (2) IV for residents, (3) IV for price. Care quality: (4) OLS with both endog vars, (5) IV for residents, (6) IV for price. Instruments: land price
and physician density per 10,000 inhabitants. IV regressions: using the ivreg2 command for Stata (Baum et al., 2002). Evaluated in 2010 dropped
due to missing price information.You can also read