FUTURE OF COFFEE Agriculture and Food Authority A
←
→
Page content transcription
If your browser does not render page correctly, please read the page content below
Agriculture and Food Authority A)

                   FUTURE OF COFFEE

        “Strategies to Promote Domestic Coffee
                 Consumption in Africa
                    Case Study: Kenya

                            Presentation during
                  AFCA SPECIALTY PROGRAMME
                                  At
                   Sea Cliff Resort & Spa, Zanzibar
                        28-31 October 2019
                                  By
BENSON APUOYO, MANAGER MARKET RESEARCH & PRODUCT DEVELOPMENT,
                      COFFEE DIRECTORATE                        1
OUTLINE
Background
Trade in Africa
Kenya’s Case Study
The Kenya Government Big 4 Agenda
The Manufacturing Pillar
Key drivers of domestic coffee consumption in Kenya
Number of coffee houses & stakeholders in value addition in
Kenya
Marketing and promotion of domestic coffee consumption
Areas of support and partnerships
Conclusion
2
BACKGROUND
Africa consume very little coffee of what they produce with
most of it exported to the global market outside the
continent.
Countries in Africa which have registered increase in
domestic coffee consumption:
1. Ethiopia
- believed to be origin of coffee
- deeply rooted coffee drinking culture
2. South Africa
- multiracial facet
- increased middle level income
- entry of new2coffee houses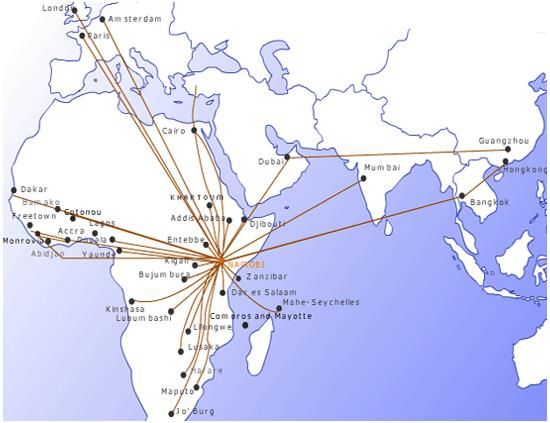
BACKGROUND
3. Nigeria
Young middle class
Population size
Effect of international exposure- young graduates coming back from
studies abroad
Examples: Café Neo Coffee Shop in the lead have revolutionized coffee
drinking culture in Nigeria
4. Kenya
- Government deliberate effort to promote domestic coffee consumption (youth in
Kenyan universities & tertiary institutions-target)
- Increased disposable income of the middle class
- Love for coffee
- Increased investment in coffee outlets
Consumption: 70 g per person per year
- 5% of national production 2
BACKGROUND
 5. Cameroon
       - Government deliberate effort to promote domestic
consumption of own coffee
       - Festicoffee- a platform for the promotion and trade of
coffee from Cameroon
        - coffee tasting day
  6. Uganda
       -With effort of UCDA – campaigns were launched for
domestic coffee consumption with some level of success

                           2
TRADE IN AFRICA
Africa is one of the most resilient, innovative and creative business
people in the world.
Africa has more entrepreneurs with a strong private sector.
Coffee - A classic example of the primary commodity and mono-crop
dependency of many sub –Saharan African countries.
This makes coffee producing countries susceptible to a number of
exogenous factors like:
- unfair trade competition with the western world (Visa refusal is one
strong form on Non- Tariff Barrier),
- Global price fluctuations.
Over 90 % of coffee is produced in developing countries (Southern
hemisphere), yet most of the consumption takes place in the developed
countries (Northern hemisphere).
2
TRADE IN AFRICA
According to World Trade Organization (WTO), intra – African trade accounts for
less than 10% of total trade.
Trade Barriers
Kinds of NTBs that are seldom mentioned in policy meetings or documented in any
meaningful way and yet remain big barriers to trade for African exporters and
entrepreneurs:
(i) Visa refusal by the granting authority- violation on freedom of movement
(ii) Restriction on international movement of people through difficult entry visa
procedures.
(iii) Entrenched negative perception about the continent.
(iv) “Trust deficit”
(v) The cost of market entry
(vi) “Knowledge deficit” that many exporters face when seeking market entry
(vii) Attitude and perception-ripe in Africa: The effects of xenophobia. Negativity breeds
Xenophobia
(viii) The constant shifting of the technical goal post regarding- packaging, labelling,
certifications. 2
TRADE IN AFRICA
Undocumented Barriers
These are perseverance and adaptability barriers that undermine the efforts of many
African entrepreneurs to undertake international trade.
The build up to this market exposed Coffee Directorate to many challenges of a start-
up export business and the realities of trading on other continents.
Where as Trade between African countries stands at less than 10% of the region’s
total trade. In comparison, 40% of North America’s trade is with regional partner.
The rate soars to 63% in Western Europe.
Intra-Comesa trade stands at 7%.
Africa is viewed as:
Economy of underutilization
Economy of scarcity of consumer goods
Economy of low wages.
2
COFFEE CONSUMPTION IN KENYA

       CASE STUDY

              2
Part I: Facts About Kenya
Kenya’s geo-strategic location offers it preferential access to regional
                      and international markets

The Nairobi Airport (JKIA) connects Africa to
Europe, Asia and currently to the USA

Kenya has secured Category 1 status,
granting it direct flights to the US.

The Port of Mombasa is gateway to East and
Central Africa region

Main transport hub to most of the African
countries in the region with great
developments in infrastructure; highways and
SGR.
Area 582,646 km2
Kenya: Country profile… Population 48 million
GDP at current US$ 77.9 billion
GDP per capita US$ 1,700
FDI Flows 2015 US$ 1.4 billion in 2015-UNCTAD
GDP Growth Rates 5.8% in 2016 and
5.2% projection in 2017 (WB)
Credit rating Standard & Poor's; B+ (stable)
Fitch: B+ (Stable)
Moody’s: B2 (Stable)
FDI Growth Rate 98.0% in 2013;
92.4% in 2014;
45.3% in 2015
Inflation Rate 7.1% - 2017
% GDP Growth
4.6% 4.7% 5.3% 5.7% 5.8%
2012 2013 2014 2015 2016Structure of Kenya’s Economy
Mining share of GDP in
Kenya is very low:
-Mining is an infant
industry that is
predominantly in the
exploration stage
-Opportunity for early
adopters and first
moversKenya’s international trade is remarkably skewed Leading destinations for exports are: • Africa 42% • Western Europe 23% • Asia 22% Leading sources of imports into Kenya are : • Asia (mainly China) 62% • Western Europe 17% Immense opportunities exist for increased trade between Kenya and Other African countries (below 10%)
Aligned to SDG 9 – Industry, Innovation
          and Infrastructure
PROBLEM STATEMENT
OVER RELIANCE ON EXPORT OF GREEN COFFEE IN KENYA
LOW DOMESTIC COFFEE CONSUMPTION IN THE COUNTRY
a) Over 95% of the Kenyan coffee production
is exported to various international markets
as green coffee
b) Domestic market absorption currently is at
5%
c) The country has a potential to consume
between 20-30% of the national production
2COFFEE EXPORT BY DESTINATION
FOR 2017/2018
NUMBER OF
NO DESTINATION BAGS(60KG) NET WEIGHT-KG
1GERMANY 113,637 6,818,217.40
2UNITED STATES 113,422 6,805,306.80
3BELGIUM 101,235 6,074,113.00
4KOREA, REPUBLIC OF 87,111 5,226,660.00
5SWEDEN 58,824 3,529,429.80
6AUSTRALIA 25,278 1,516,682.00
7FINLAND 23,076 1,384,560.00
8NORWAY 18,344 1,100,630.00
9UNITED KINGDOM 17,223 1,033,379.00
10OTHERS 163,344 9,800,637.31
TOTAL 721,494 43,289,615.31DOMESTIC COFFEE CONSUMPTION TREND
YEAR LOCAL CONSUMPTION NO. BAGS
MT (GREEN BEAN)
2009/10 509.90 8,498
2010/11 566.60 9,443
2011/12 629.50 10,492
2012/13 716.00 11,931
2013/14 744.00 12,405
2014/15 756.00 12,591
2015/16 771.00 12,842
2016/17 1,050.20 17,520
2017/18 1,576.70 26,278KENYA’S COFFEE SHOPS ATTRIBUTES
In the Kenyan specialty coffee industry, it is
imperative for specialty coffee
entrepreneurs to understand the important
attributes that motivate consumers to
patronize specialty coffee shops so as to
have a competitive advantage and sustain
their businesses.
Before, there was no existing published work
on domestic coffee consumption,
particularly in the Kenyan context based on
empirical evidence
21COFFEE SHOPS ATTRIBUTES
Coffee Directorate (Coffee Board of Kenya)
undertook a study in the year 2011/12 in
this area to understand the factors that
could help enhance domestic coffee
consumption in Kenya.
The study adopted both qualitative and
quantitative approaches in an exploratory
sequential mixed research design to explore
and identify attributes used by Kenyan
specialty coffee consumers when selecting
specialty coffee shops.
22COFFEE SHOPS ATTRIBUTES
The findings from the qualitative approach
were used to develop the survey
questionnaire.
Based on purposive sampling, responses from
450 respondents were analyzed using
exploratory factor analysis.
23COFFEE SHOPS ATTRIBUTES
All the survey statements were measured
using a 5- point Likert type scale ranging
from 1- Very unimportant, 2- Unimportant,
3-Neutral, 4-Important, 5- Very Important.
Exploratory Factor Analysis (EFA) using SPSS
version 20 was used.
Factors with eigenvalues greater than 1 are
considered sufficient.
Factors loading in the range of ±0.30 to ±0.40
are sufficient to meet the minimum level of
interpretation (Hair 24
et al.,2006).COFFEE SHOPS ATTRIBUTES
i. The Coffee Directorate study used a
factor loading cut-off point of 0.40 for
retaining items in the factor analysis
ii. From the initial list of 61, a total of 9
items were factor again with the items
loading onto nine factors
iii. The nine factors were extracted using
principal component analysis with promox
rotation
25COFFEE SHOPS ATTRIBUTES Nine factors were labelled: i. The youth leverage ii. Tangibles iii. Quality coffee iv. Service quality by staff v. Brand preference vi. Promotional activities vii. Social responsibility and recreation viii. Food & drinks selection ix. Other amenities 26
The first factor. The value of youth leverage had 12 items:
Factor loading: From 0.532 to 0.857

                                  Fresh
                  Open and     perspective
                   Frank                      Adaptable

          Future

                            The
        Managers /                                      Enthusiastic
         Leaders

        At ease
          with
                          Value of                             Fast
                                                           learners of

                           Youth
                                                               new
        changes
                                                          technologies

             Able to                                 More aware
               build                                  of new
           partnerships                                tools
                            More
                                       Transfer of
                          Computer
                                        ICT Skills
                           Literate

                                                                         27
The second factor: Tangibles: Had 11 items: FL ranging from 0.422 to
0.810
Friendly
staff
Quiet Helpful
atmosphere staff
Reasonable
Courteous price with
staff quality
service
Adequate
Tangibles Reasonable
spacing price with
between quality
tables coffee
Reasonable
Easy to read
price with
menus
Clean portion size
restrooms
28The third factor. Coffee Quality had 10 items: FL from
0.508 to 0.886
Coffee with
quality
Coffee with beans Coffee with
consistent freshly
quality roasted
beans
Coffee
Coffee
Customized brewed
coffee using right
skills
Coffee with
quality Freshly
brewed
the right coffee all
temperature the time
Coffee with Coffee with
preferred preferred
aroma taste
29The fourth factor. Service Quality Staff had 6 items: FL
from 0.516 to 0.729
Staff performs
service right
the first time
Staff attentive Staff offers
Service
to order individual
attention
quality
Staff attentive
to specific
needs
staff Staff
knowledgeable
about the
product
Staff gives
prompt service
30The fifth factor. Brand preference had 4 items: FL from
0.621 to 0.852
Frequently visit
a particular
coffeehouse
familiar with
Brand
Frequently visit
a particular Frequently visit
coffeehouse for a trusted a
preference
the quality of its particular
products it coffeehouse
serves
Frequently visit
a particular
coffee house
for its ambience
31The sixth factor. Promotional activities had 4 items
FL from 0,503 to 0.737
Free testing of
coffee and
food items
Availability of
wall screen Tvs Promotional Availability of
merchandised
for news &
entertainment Activities items
Availability of
private rooms
32The seventh factor. Social responsibility and recreation
had 4 items. FL from 0.422 to 0.726
Environmentally
friendly coffee
house
Social Place to relax
Place with
warm lighting responsibilities during leisure
times
& recreation
Place to meet
potential clients
33The Eighth factor. Food and drinks
had 2 items. FL of 0.710
Variety of
drinks
(Other than
coffee)
Food &
Drinks
Variety of
food
34The Ninth factor. Other Amenities had I item:
FL 0.834
Other Smoking
amenities area
35The exploratory factor analysis
Factors with eigenvalues greater than 1 are considered
significant (Hair et al.,2006).
The Eigenvalues for the nine variables were greater than 1.
Youth leverage = 12.27
Tangibles = 3.08
Coffee quality = 2.69
Service quality by staff =1.82
Brand preference = 1.53
Promotional activities =1.34
Social responsibility & recreation =1.22
Food & drinks selection = 1.15
Other amenities = 1.08
36The nine factor solutions
Nine factors explained 59.1% of the total variance
Youth leverage = 18.07%
Tangibles = 13.10%
Coffee quality =6.85%
Service quality by staff =5.99%
Brand preference = 4.05%
Promotional activities =3.41%
Social responsibility & recreation =2.98%
Food & drinks selection = 2.71%
Other amenities = 1.94
37COFFEE HOUSES OWNERSHIP
Java House 53 outlets
Art Café 14 outlets
Avant Group 8 outlets
Big Square 7 outlets
Others 149 outlets
3
8NUMBER OF COFFEE HOUSES
No County City/Town No of Coffee Houses %
1 Nairobi Nairobi 128 40%
2 Mombasa Mombasa 21 8%
3 Kilifi Kilif (12), Malindi(5), Watamu (1) 18 7%
4 Nakuru Nakuru (12), Naivasha (6) 18 7%
5 Kisumu Ksumu 16 6%
6 Kwale Ukunda/Diani 10 4%
7 Uasin Gishu Eldoret 9 4%
8 Narok Narok 7 3%
9 Kiambu Kiambu (2), Thika (4) 6 2%
10 Meru Meru 6 2%
11 Nyeri Nyeri (4), Karatina (1), Othaya (1) 6 2%
12 Embu Embu 5 2%
13 Liakipia Nanyuki 5 2%
14 Machakos Machakos (4), Mua Hills (1) 4 2%
15 Taita Taveta Taveta (3), Voi (1) 4 2%
16 Trans Nzoia Kitale 4 2%
17 Kisii Kisii 2 2%
18 Busia Busia 2 1%
19 Homa- Bay Homa- Bay 2 1%
20 Kakamega Kakamega 2 1%
21 Kirinyaga Kerugoya 1 0%
Total 278 100%COFFEE PRICES
City/Town Serving Cup Size in ml Price in Ksh
Diani/ Ukunda Café Latte 200 250
Cappuccino 220 220
Espresso 100 150
House coffee 120 180
Macchiato 220 200
Kisumu Café Latte 200 400
Cappuccino 220 220
Espresso 100 150
House coffee 120 180
Macchiato 220 200
Nairobi Café Latte 200 250
Cappuccino 220 200
Espresso 100 100
House coffee 120 200
40
Macchiato 220 250POPULAR COFFEE DRINKS
No Type Percentage
1 Cappuccino 49%
2 House coffee 29%
3 Café Latte 10%
4 Black coffee 5%
5 Espresso 4%
6 Americano 2%
7 Medicinal coffee 0%
8 Mocha 0%
Total 100%
4
1DOMESTIC COFFEE CONSUMPTION TREND
YEAR LOCAL NO. BAGS
CONSUMPTION
MT (GREEN BEAN)
2009/10 509.90 8,498
2010/11 566.60 9,443
2011/12 629.50 10,492
2012/13 716.00 11,931
2013/14 744.00 12,405
2014/15 756.00 12,591
2015/16 771.00 12,842
2016/17 1,050.20 17,520
2017/18 1,576.70 26,278COFFEE PRODUCTION,VALUE ADDITION
AND CONSUMPTION IN KENYA
Year 2009/10 2010/11 2011/12 2012/13 2013/14 2014/15 2015/16 2016/1 2017/18
7
National 42,000 46,629 49,960 39,865 49,475 42,038 46,121 38,620 41,375
coffee
production
in MT
Domestic 510 566 629 716 744 756 771 1,050 1,577
consumpti
on of
coffee in
MT
Percentage 1.21% 1.21% 1.26% 1.79% 1.50% 1.8% 1.67% 2.75% 3.81%
2DOMESTIC CONSUMPTION TRENDS IN KENYA
QUANTITY(GBE) MT
1800
1576.7
1600
1400
1200 1051.2
1000
716 744 756 771
800 629.5
600 509.9 566.6
400
200
0
44NUMBER OF COFFEE HOUSE IN KENYA IN 2017/18
NO OF COFFEE HOUSES 1977-2017
300
250 249
219
200
187
150
100 101
50 44
30
6 9 16
0
> 40 YRS 30 TO 40 YRS 20 TO 25 YRS 15 TO 20 YRS 10 TO 15 YRS 5 TO 10 YRS 3 TO 5 YRS 1 TO 2 YRS 0 TO 1 YRS
4
525- SOME STAKEHOLDERS CURRENTLY IN VALUE
ADDITION IN KENYA
Dormans coffee International Beverages Ltd
Sasini coffee Java House
Cafe’ Dela Duka Najasha Coffee
SuperGibs Meru farmers union
Africa Tea & Coffee M.A Pandit & Co. Ltd
Goldrock International African Coffee Roasters
Kenya Nut Company ltd Fair To Good
Bekas Systems Ltd Rockbern Co. Ltd
Muramuki FCS Kensam Estate
Mutira FCS Vava Coffee
Othaya FCS Kenya Planters Co-operative
Dedan Kimathi University Union (KPCU)
Kenya Co-operative Coffee Gusii Farmers Union
Dealers 4
625- THE NUMBER OF STAKEHOLDERS CURRENTLY IN
VALUE ADDITION
S/No Category Number of players
1 Farmers’ based organizations 6
2 Coffee dealers 19
3 Coffee houses 249
4 Universities 4
Total 278
47CONSUMPTION DRIVE THROUGH UNIVERSITIES
Critical success factors with universities
i. Tyranny of numbers (Student population)-
Market is about numbers
ii. Younger affluent consumers
iii. Hope, dream & image
iv. View coffee consumption as an experience
v. Dating culture
vi. The dons culture
vii. Health benefits
viii. Revenue generation
48PROMOTION OF KENYAN COFFEE IN
UNIVERSITIES
University students sampling Kenyan coffee during one of the campaignsKEY DRIVERS OF DOMESTIC CONSUMPTION IN KENYA
1) Youths in universities and institutions of higher learning
(Versatile customers)
2) Growth of supermarket chains and retail outlets in major
towns within Kenya for shelves space
3) Growth of coffee shops chains in urban centres in Kenya-
“café culture”
4) Budgetary allocation for generic promotion and marketing
value added coffee
5) Availability of different brands of coffee in the local market
targeting different economic classes
6) Vibrant informal coffee vending outlets-hawkers
7) User friendly policies, rules and regulations governing the
coffee industry in the country
5
8) International organizations (ICO, IACO, SCA, AFCA, etc)
0
supportUNIVERSITIES WITH FULLY FLEDGED COFFEE HOUSES
No Name of Status County
University
1 Dedan Kimathi Public Nyeri
University of
Technology
2 United States Private Nairobi
International
University- Africa
3 Strathmore Private Nairobi
University
51COFFEE HOUSES AT UNIVERSITIES –
AWAITING LUANCH
Coffee Directorate has purchased coffee
brewing equipment for the following
No Name of Status County
University
1 Egerton University Public Nakuru
2 University of Public Eldoret
Eldoret
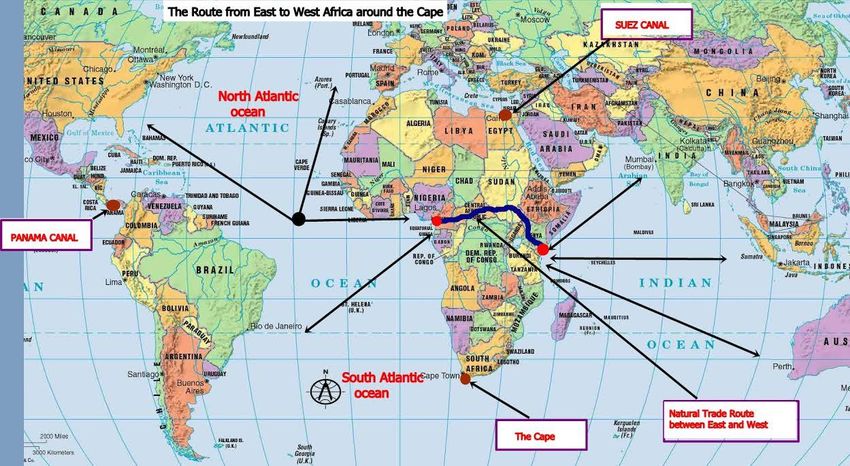
52CONCLUSION 1) Coffee for consumption in Africa, Kenya included, is growing and will be more than the production by African coffee producing countries in the year 2040. It needs to be harnessed. 2) Intra Africa trade is only 10% compared to the potential of 80%. The potential needs to be tapped. 3) There is need for sustainable support programme to derive the course of coffee consumption in Africa. 4) Domestic coffee consumption is less susceptible to non trade barriers now common in the competitive global coffee trade.
DRINK COFFEE KENYA
    Thank you

                     54
You can also read