An evaluation of business process model techniques, using Moody's quality criterion for a good diagram
←
→
Page content transcription
If your browser does not render page correctly, please read the page content below
An evaluation of business process model techniques,
    using Moody’s quality criterion for a good diagram

                Lars-Olof Johansson1, Magnus Wärja2 and Sven Carlsson2
                  1
                  Halmstad University, Box 823, 301 18 Halmstad, Sweden
                                  Lars-olof.johansson@hh.se
    2
     Lund University, Institutionen för informatik, Ole Römers väg 6, 223 63 Lund, Sweden
                         {magnus.warja ans sven.carlsson}@ics.lu.se

       Abstract. Complex processes have become more common and include, for
       example, knowledge workers ie people who work with more complex and
       problematic tasks. Our interest is to better understand how a problematic and
       complex situation in an organization should be model. Four major process
       oriented modeling techniques has been analyzed using Moody’s quality
       criterion for what makes a good model. The findings indicate that there are only
       one candidate, BPMN, that meets some of Moody’s quality criterion, but there
       are also weaknesses in BPMN, such as for the criterions; expressiveness and
       emphasis.
       Keywords: Business processes model evaluation, Business process model
       quality criterion.

1 Introduction

Modelling has always been an essential part of organizational design as well as
information systems development. Models enable decision makers to filter out the
complexity of the real world; so that efforts can be directed toward the most important
parts of the system can be studied. [1].
   Processes on the overall levels are considered more complex and more difficult to
analyze because they are at a higher abstraction level. Complex processes have
become more common and include, for example, knowledge workers i.e. people who
work with more complex and problematic tasks. When the activities of the processes
to be described will become more complex the demands on the modelling technique
to be used increases [2].
   Various different models/diagrams have long been used for developing information
systems. Nevertheless, it is little research focusing on how to produce "good"
graphical models [3]. According to Moody [3], the design of models using a graphical
notation is both ad hoc and unscientific. The modeller chooses conventions based on
personal taste rather than scientific evidence. Existing notations [3], uses a very
limited graphic vocabulary and thus they fail to communicate their message. Moody
[3] has found nine key elements / principles in order to produce "good" diagram.
According to Moody a good model is characterized by effective communication
between the graphical model and its stakeholders [3].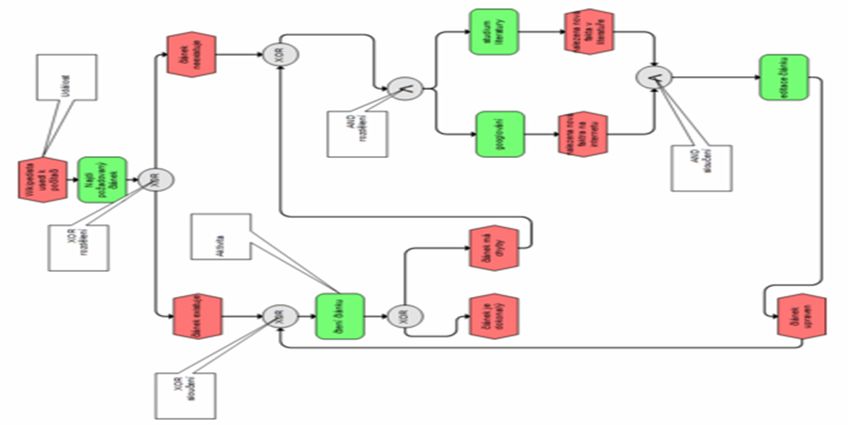
We are interested in business process modeling techniques and addressed the
question: what constitutes a “good” graphical modeling technique according to
Moody’s quality criterion? One major reason is our interest to better understand how
a problematic and complex situation in an organization could be modeled.
   Hence the research question addressed is: Which are the relevant graphical
business process modelling techniques to be used when modelling a problematic and
complex situation? The research approach is evaluation research. In this article we
will:
1. identify relevant graphical modelling techniques
2. identify relevant quality criterion for evaluation of graphical modelling techniques
3. evaluate graphical relevant modelling techniques, using the identified quality
   criterion

One of the main motives behind the research is that graphical diagrams are believed
to be more effective than text in communication between end users and/or domain
practitioners [3].
   The research started with a literature review with the aim to identify relevant
graphical modeling techniques that could be useful when producing a business
process model. We started by reviewing well known articles about graphical
modelling techniques and identified references in order to distinguish the most
prominent graphical business process modelling techniques that could be used for a a
problematic and complex situation. Since our major focus is process modeling
techniques we choose to exclude non process oriented graphical modelling
techniques. We found four candidates: 1) Flowchart/nodemaps, 2) Business Process
Modeling Notation (BPMN), 3) Event Driven Process Chains (EPC), and 4) UML-
activity diagrams. These four process oriented modeling techniques vill be evaluated
based by Moodys quality criterions.
   The paper is organized as follows. In the next section we will briefly present the
identified graphical modeling techniques relevant our research question.
   In Section 3 we provide an overview of quality criterions related to business
process modelling techniques. In Section 4 we will provide our empirical data. In
Section 5 an analysis of the modeling techniques is presented. We conclude by a
discussion and identification of future research.

2. Four major business process modeling techniques

This section aims to present some major business process modeling techniques
presented in the ISD-literature. The proposed modeling techniques are characterized
as process oriented modeling techniques. The motive for the choice of the four
process modeling techniques is that they are widely used in describing problematic
and complex situations in organizations.
   Event-driven process chains (EPC), business process modeling notation (BPMN)
[4, 5], UML-activity diagrams [5], and flowcharts are all examples of process
oriented modeling techniques. In process-oriented modeling techniques there is
always a starting point (input) and an end point (output) [6, 7]. Petri nets and YAWL
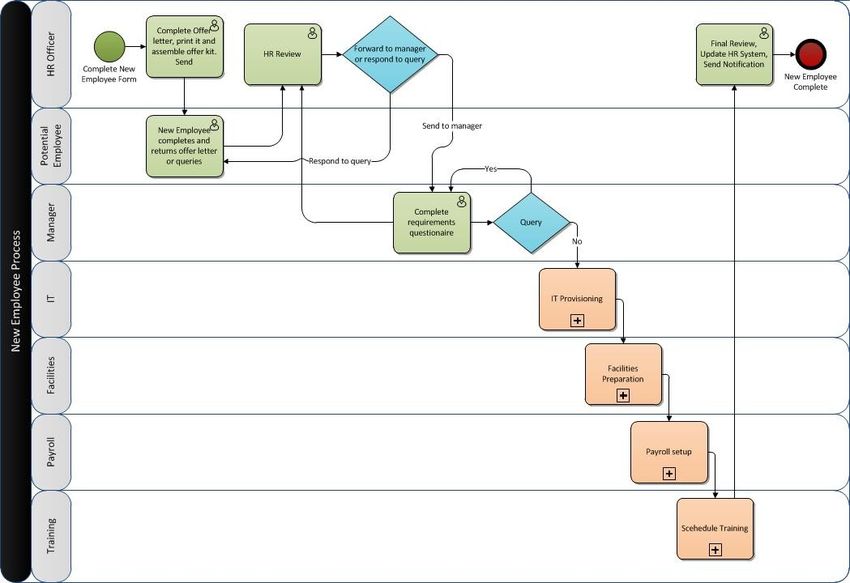
(Yet Another Workflow Language) are also examples of graphical modelling techniques that have gained a lot attention in the research community. These two graphical modelling techniques are mostly used at a lower abstraction level and are therefore not discussed in this paper. The four proposed graphical modelling techniques are commonly used by both practitioners and researchers when it comes to modelling and describing an environment (people and organizations) of a computerized system. From our literature review we have identified four graphical process oriented modeling techniques: BPMN; UML-activity diagram; EPC and flowchart/node-maps. As described by Miller and Mukerji [8], graphical modeling techniques that should be used in creating at a high abstraction level should be directed to organizational/business aspects and also be used by, in first hand, the domain practitioners/end-users. A problem is that the process oriented modeling techniques has a notation with quite high formalism. Symbols are described (boxes, circles, diamonds) and different type of arrows (filled, dotted, double arrows ets) are also described. In order to use the process-oriented modeling techniques the domain practitioners need training and education about the notation [9]. BPMN has attracted considerable attention in the IS research field as a convenient description technique for documenting and re-engineering processes [4]. Figure 1. Examples of BPMN [11] BPMN consists of the following basic building blocks (Figure 1) [10]. Flow objects: events (circles), activities (rectangles with rounded corners), and gateways (diamonds)
Connecting objects: mainly comprising arrows, these indicate sequence flow (filled arrows), message flow (dashed arrows), and associations Swimlanes: pools (graphic container) and lanes (sub-partition of the pool) Artifacts: data objects, groups, and annotations UML-activity diagrams are typically used for business process modeling, for modeling the logic or for modeling the detailed logic of a business rule (Figure 2). In many ways UML activity diagrams are the object-oriented equivalent of flow charts [12, 13]. Figure 2: Example of UML-activity diagram The main reason for the popularity of EPC is that it is a component in the SAP Reference Model [14, 15]. The SAP Reference Model is a set of information models that is utilized to guide the configuration and implementation of SAP-systems. The SAP Reference Model contains almost 10000 individual models with 3000 of them being EPCs [15]. A major part of these models is business process models represented in the Event driven Process Chains (EPC) notation.. EPC comprises the following elements (Figure 3) [14]:
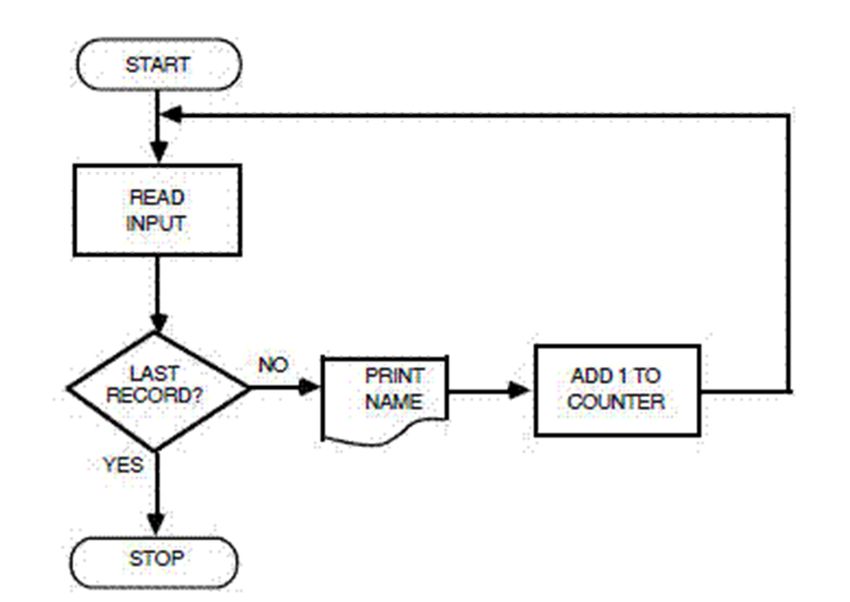
Functions: these building blocks correspond to an activity (task, process, or step) that needs to be executed. Events: these describe the situation before and/or after a function has been executed; functions are linked by events. Logical connectors: these can be used to connect functions and events to specify the control flow; there are three types of connectors: Λ (and), XOR (exclusive or), and ν (or). Figure 3: Example of EPC A flowchart is a type of diagram that represents an algorithm or process, showing the steps as boxes of various kinds, and their order by connecting these with arrows. This diagrammatic representation can give a step-by-step solution to a given problem. Figure 4: Flowchart
Process operations are represented in these boxes (Figure 4), and arrows connecting them represent flow of control. Data flows are not typically represented in a flowchart, in contrast with data flow diagrams; rather, they are implied by the sequencing of operations. Flowcharts are used in analyzing, designing, documenting or managing a process or program in various fields [16]. 3. Moody’s quality criterions Graphical diagrams are believed to be more effective then text in the communication between end-users and/or domain practitioners [3]. Communication effectiveness can be measured by speed, ease, and accuracy in which the information can be understood. According to Moody the design of graphical models in information systems development (ISD) has been based on personal taste, intuition, consensus rather than scientific theory and evidence [3]. The same graphical symbols – variants of boxes and arrows – are used over and over again while other attributes such as colours, size, spatial layout and value are seldom used. Many graphical notations in ISD are not consistent with principles of graphical design (visual appearance or form). The importance of diagrams have been understated by ISD researchers. For example, the details of a graphical syntax (how to visually represent these constructs) are treated as being of little or no consequence. Even slight changes in graphical representation can have dramatic impact on understanding and problem solving performance. This suggests that the form of diagrams is just as important – if not more – than their content. Moody [3] presents nine principles for graphical modelling: discriminability, perceptual and cognitive limits, emphasis, cognitive integration, perceptual directness, structure, identification, expressiveness, and simplicity. Moody does not use these nine principles when discussing different notations of graphical modelling techniques instead he uses the principles to discuss benefits and drawbacks of a specific model (created with the help of a modelling technique). Discriminability means easy to see and to differentiate from one another. It discusses the elements of a diagram. Moody distinguish between absolute and relative discriminability: Absolute discriminability: the ability to see diagram elements and separate them from the background. It is determined by three primary factors: size, contrast, and proximity. Relative discriminability: the ability to differentiate between different types of diagram elements. It is determined by the number and size of differences between symbols used to represent different constructs. The greater the perceptual variation between symbols used to represent different constructs, the faster and more accurately they will be recognised. Human beings have both perceptual and cognitive limits. One of the most common mistakes in ISD diagramming practice is to show too much information on a single
diagram. This results in a diagram that acts as a barrier instead of a communicative aid. Perceptual limits: the ability to visually discriminate between diagram elements decreases with their number and proximity. In general, the difficulty of discerning diagram elements increases quadratically with diagram size. Cognitive limits: the number of diagram elements that can be comprehended at a specific moment is limited by working memory capacity, which is believed to be “seven plus or minus two” concepts at a specific moment. When this is exceeded, a state of cognitive overload ensues and comprehension degrades. One of the most effective ways of reducing complexity is to divide them into smaller parts, decomposition or modularisation. In most ISD diagrams, all elements look the same: there is no way of telling which are the most important. The most important concepts should be emphasized (highlighted) to bring them to the readers’ attention, while less important or background elements should be de-emphasized (lowlighted). It is very common in ISD diagramming to use multiple diagrams. Many developers use for instance UML which consists of 13 different modeling notations. The notation should provide an explicit mechanism to support cognitive integration: Conceptual integration: enabling the reader to integrate information from separate diagrams into a coherent mental representation of the problem. Perceptual integration: providing perceptual cues (orienting, contextual and directional information) to aid navigation between diagrams. Perceptually direct representations are representations whose interpretation is spontaneous or natural, in that their meaning can be extracted automatically by the perceptual system. Representation of constructs: icons are symbols which perceptually resemble the objects they represent. Using icons to represent constructs reduces cognitive load. Representation of relationships: perceptual directness also applies to representation of relationships among diagram elements. Certain spatial configurations of diagram elements predispose a person towards a particular interpretation even before the meaning of the elements is understood. Organizing diagram elements by a structure into perceptual groups expands the number of elements that can be shown on each diagram without exceeding cognitive limits. Moody divides the concept of identification into external identification and internal identification. External identification defines the correspondence between the diagram and the represented world. Diagram elements (both nodes and links) should be clearly labeled, using terminology familiar to domain experts to help trigger domain knowledge. Internal identification defines the correspondence between graphical conventions and their meaning. A key should be used summarizing the graphical convention. Most graphical modelling techniques in ISD use a very limited graphical vocabulary (boxes and arrows) which implies a low expressiveness. We could use the
full range of visual variables such as shape, colors, size, value, orientation and texture. The number of graphical conventions used in a notation should be limited (use visual variables instead). Keep it simple, let simplicity rule. 4 Evaluation The evaluation is based on the important findings in the quality criterion presented by Moody [3], experiences from research projects and educational settings related to business process modeling. We evaluated each of the four identified modelling techniques according to Moody quality criterion. We used a three graded scale: , and . = +1, = 0 and = -1. The analysis started with a discussion about how to interpret and use the scale. We focused on the contrast between the different values in the scale. In order to give the reader a more thorough understanding of the analysis (and the use of the scale) we will present two examples from our discussion and analysis. The first example relates to the researchers’ understanding of the concept discriminability in the process-oriented modeling techniques. If we have a model with boxes and connecting arrows/lines (frequently used in ISD) we looked on the arrows to see if there was a description on the arrow and a direction ( = +1), if the arrow did not have the description but had a direction ( = 0), or if the arrow did not have both a description and a direction ( = -1). The second example relates to the researchers’ understanding of the concept perceptual and cognitive limits in the process-oriented modeling techniques. This started with the question: How well does the modelling technique support decomposition and modularisation? If the modelling technique supports decomposition and modularisation ( = +1), if the modeling technique partially supports decomposition and modularisation e.g. splitting and merging ( = 0), or if the model does not support decomposition and modularisation ( = -1). Our analysis followed the logic in the described examples. Three researchers did the analysis and classification independently. The outcomes were compared. There was more than an 80% agreement between the three outcomes, which is an acceptable inter coder reliability [17]. Where non-agreement existed, the three researchers discussed the evaluations and final classification and evaluation decision was made. The result from the analysis is presented in Table 1. The rows in the table are of the nine criterions presented by Moody and the columns are the four process-oriented modelling techniques.
Flowcharts BPMN EPC UML-activity diagram Discriminability Perceptual and cognitive limits Emphasis Cognitive integration Perceptual directness Structure Identification Expressiveness Simplicity Sum: -4 +2 -3 -2 Table 1: Results of the analysis 5 Discussion The discussion will be structured according to our results presented in Table 1. The maximum sum that could be reached for the process-oriented modelling technique was 9 and the minimum was -9. Most notable is that only one of the modelling techniques (BPMN) has a positive sum (+2). The other three modelling techniques have a negative sum. Based on the used quality criterion, this indicates that there are problems to be solved when it comes to modelling techniques. BPMN reached the highest sum (+2), but it is far from the maximum sum which indicates that even BPMN could be improved. All four process modelling techniques have a negative value () on emphasis and expresivness, a neutral value () on perceptual directness and identification, and a positive value () on simplicity. These findings indicate that we need to rethink process modelling techniques as a tool for computer independent models is neeeded. First and foremost, process-oriented modelling techniques must start using visual variables to reach a higher expressiveness and emphasis (as described in Section 2). The different process-oriented modelling techniques used more or less the same graphical symbols (variants of boxes and arrows) over and over again and there is no way of telling which are the most important objects/processes in a model. During the literature review we were also surprised by the fact that: issues of semantics and content (what constructs to include in a notation) are treated as matters of substance, but details of graphical syntax (how to visually represent these constructs) are treated with no or little consequences, Many graphical notations in ISD are not consistent with principles of graphical design (visual appearance or form). Graphical models are treated as standalone artifacts.
6. Conclusion and future research

When we started the research process the underlying research question was: Which
are the relevant graphical business process modeling techniques to be used when
modeling a problematic and complex situation? The answer to that question is that we
had four candidates of process-oriented modeling techniques: flowcharts, BPMN,
EPC, and UML-activity diagrams. They satisfy (to some extent) the seven
demands/requirements put forward by OMG. Using Moody’s quality criterions to
anlyze the models, only BPMN reached an acceptable level.
   There are strong indications that business process models should benefit from not
only to be discussed from issues of semantics and content (what constructs to include
in a notation) but also details of graphical syntax (how to visually represent these
constructs) and how well they serve as communication catalyst in the modeling
process. One major reason behind this statement is that process models at a high
abstraction levels should first and foremost be used by domain practitioners as a
communicative tool and for these models the principles of good graphical design
should be applied.

References

1. Giaglis, G.M., A taxonomy of business process modeling and information systems modeling
   techniques. International Journal of Flexible Manufacturing Systems, 2001. 13(2): p. 209-
   228.
2. Harmon, P., Business process change: a manager's guide to improving, redesigning, and
   automating processes2003: Morgan Kaufmann.
3. Moody, D., What makes a good diagram? improving the cognitive effectiveness of diagrams
   in is development. Advances in Information Systems Development, 2007: p. 481-492.
4. Recker, J.C., et al., How good is BPMN really? Insights from theory and practice. 2006.
5. Recker, J.C., Towards an understanding of process model quality. methodological
   considerations. 2006.
6. Mathiassen, L., et al., Object-oriented analysis & design2000: Studentlitteratur.
7. Vidgen, R. and B. Wood, Developing web information systems: from strategy to
   implementation2002: Butterworth-Heinemann.
8. Miller, J. and J. Mukerji, MDA Guide Version 1.0. 1. Object Management Group, 2003.
   234: p. 51.
9. Shneiderman, B., Designing the user interface. 3 ed1998: Addison Wesley Longman.
10.White, S.A., Introduction to BPMN. IBM Cooperation, 2004: p. 2008-029.
11.White, S.A. Introduction to BPMN. 2004                    [cited 2006; Available from:
   http://www.bpmn.org/Documents/Introduction to BPMN.pdf.
12.Ambler, S.W., Introduction to the Diagrams of UML 2.0. Agile Modeling Retrieved, 2008:
   p. 03-10.
13.Ambler, S.W., The object primer: agile modeling-driven development with UML 2.02004:
   Cambridge Univ Pr.
14.van der Aalst, W.M.P., Formalization and verification of event-driven process chains.
   Information and Software Technology, 1999. 41(10): p. 639-650.
15.Mendling, J., et al., Errors in the SAP reference model. BPTrends, June, 2006.
16.SEVOCAB: Software and Systems Engineering Vocabulary. Available from:
   http://pascal.computer.org/sev_display/search.action.
17.Lewis-Beck, M.S., A. Bryman, and T.F. Liao, The Sage encyclopedia of social science
   research methods. Vol. 1. 2004: Sage Publications, Inc.
You can also read