DTI Fiber Tract-Oriented Quantitative and Visual Analysis of White Matter Integrity
←
→
Page content transcription
If your browser does not render page correctly, please read the page content below
DTI Fiber Tract-Oriented Quantitative and
     Visual Analysis of White Matter Integrity ?

                      Xuwei Liang, Ning Cao, and Jun Zhang

Department of Computer Science, University of Kentucky, USA, jzhang@cs.uky.edu.

        Abstract. A new fiber tract-oriented quantitative and visual analysis
        scheme using diffusion tensor imaging (DTI) is developed to study the
        regional micro structural white matter changes along major fiber bun-
        dles which may not be effectively revealed by existing methods due to
        the curved spatial nature of neuronal paths. Our technique is based on
        DTI tractography and geodesic path mapping, which establishes corre-
        spondences to allow cross-subject evaluation of diffusion properties by
        parameterizing the fiber pathways as a function of geodesic distance. A
        novel isonodes visualization scheme is proposed to render regional sta-
        tistical features along the fiber pathways. Assessment of the technique
        reveals specific anatomical locations along the genu of the corpus cal-
        losum paths with significant diffusion property changes in the amnestic
        mild cognitive impairment subjects. The experimental results show that
        this approach is promising and may provide a sensitive technique to study
        the integrity of neuronal connectivity in human brain.

1     Introduction

The diffusion tensor imaging (DTI) technique has raised hopes to assess brain
disorders by detecting white matter (WM) changes through monitoring the
change of diffusion properties. The fractional anisotropy (FA), a quantitative
measure of the degree of anisotropy, can be used to probe the integrity of the
brain WM [1]. The mean diffusivity (MD) value is a quantitative measure of the
bulk mean motion of water and is used to study pathological changes in cerebral
tissue [2].
    Region-of-interest (ROI) [3] and voxel based morphometric (VBM) [4] have
been used in medical literatures with DTI. But there are known limitations with
these approaches [5]. DTI based tractography enables selective reconstruction
of specific neuronal pathways [6, 7] and can be used to represent and measure
the structural connectivity in human brains. However, due to the curved spa-
tial nature of the fiber tracts, most approaches proposed so far do not evaluate
regional diffusion property changes along the fiber bundles. Neither were inter-
active visualization techniques used to aid understanding of WM abnormalities.
Human brain neuronal paths represent comparable structural connectivity and
?
    Technical Report CMIDA-HiPSCCS 002-08, Department of Computer Science, Uni-
    versity of Kentucky, Lexington, KY, 2008.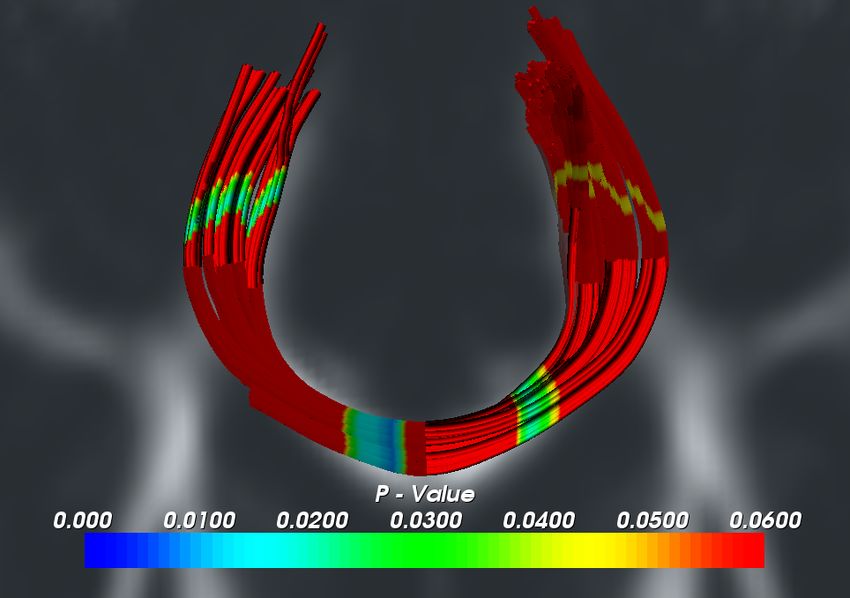
exhibit a variety of geospatial information across subjects. ROI based method-
ology usually samples only one or more intersections along the fiber bundles.
Operator-introduced errors are inherent due to the manual placements of ROIs.
VBM is based on correspondences of voxels indices and does not sufficiently take
the aforementioned geospatial variations into account. This motivates the need
for a new analysis method.
    The main goals of this study were twofold: 1) to develop an effective method
to measure the regional micro structural WM changes along the major fiber
bundles; and 2) to interactively visualize hidden regional statistical features in
vivo for better understanding. Our approach is based on DTI tractography and
geodesic path mapping, which establishes correspondences to allow direct cross-
subject evaluation of diffusion properties along the tractography-extracted fiber
tracts by parameterizing the space of the computed pathways as isonodes, a
function of the geodesic distance. The second objective was achieved by employ-
ing our proposed isonodes visualization scheme. An experiment was conducted
to assess this new technique.

2     Methodology

2.1   DTI Data Calculation and Fiber Tracking

We used our home-developed software package to process the DTI data and
track fibers. The tensor calculation is based on the Stejskal-Tanner equation.
The diffusion properties, FA, MD and eigenvectors of the diffusion tensor, were
calculated and saved as image files.
    In this study, the genu of the corpus callosum (GCC) paths were recon-
structed using the backward streamline tractography technique [8]. This ap-
proach treats the entire brain as the tracking source region and only those recon-
structed fiber tracts which pass through the predefined ROI (target) are counted.
Therefore, one voxel may have more than one fiber tracts passing through and
the tracking results are significantly improved [8, 9]. A fixed size ROI, worked as
the target region of the fiber tracking, was manually placed in the center area of
GCC to minimize the misregistration effect. In this way, voxels that were around
the ventricles and at the edge of a fiber bundle were then excluded. FA indexed
color maps were employed to validate the reconstructed fiber tracts. Figure 1
shows the GCC fiber tracts based on a tensor averaged image from all subjects.

2.2   Geodesics and Geodesic Path Mapping

Fiber tracts extracted from each individual subject were stored as sets of curvi-
linear polylines. One fiber tract is a 3D curve r(s) on a Riemannian manifold Ω.
The tangent space τ on a Riemannian manifold is equivalent to the vector space
of the primary eigenvectors → −
                              e = (e1 , e2 , e3 )T . To obtain a distance between two
points of a connected Riemannian manifold, we simply have to take the mini-
mum length among the smooth curves joining these points. The curves satisfying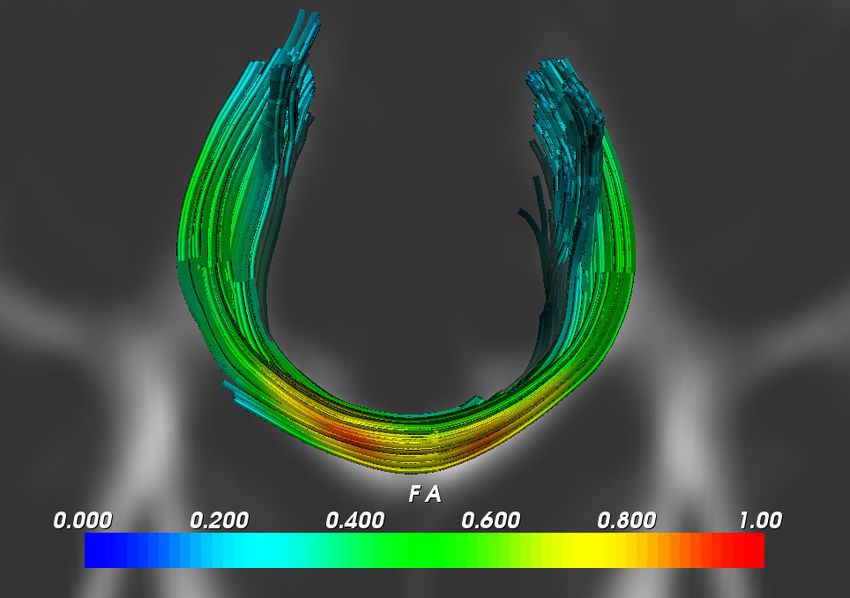
Fig. 1. The reconstructed GCC fiber tracts overlapped on a tensor averaged FA map
of all subjects. The left-hand and right-hand side subfigures are in sagittal and axial
views respectively.

this minimum for any two points of the manifold are called geodesics. Geodesic
distance of two points c1 and c2 on a fiber r(s) is obtained by integrating −
                                                                            →
                                                                            e (s)
along r
                                               Z   s2
                            Dist(c1 , c2 ) =            −
                                                        →
                                                        e (s)ds.                   (1)
                                               s1

    Let I = [a, b] be an interval on a fiber curve r(s), which is defined as a
natural sequence of points r(s) = (x(s), y(s), z(s)) or a sequence of point vectors
of a moving point on the image set r(I) of curve r. With these definitions, we
can now map a fiber r(s) : Ω 7→ [a, b] by equation (1). After this mapping, two
distinct points on two distinct fibers my share one common geodesic distance
Dist(s).
    In the implementation, for each fiber bundle (a set of fiber tracts), we set
up common starting points and parameterized each fiber by a fixed geodesic
arc-length. These common starting points and fixed arc-length geodesic path
parameterizations establish correspondences across subjects as well as individual
fiber tracts.

2.3   Isonodes

To facilitate the use of visual analysis techniques in our research, here we define
a new concept, isonodes. Isonodes are a three-dimensional analog of a collection
of nodes. They are a group of points of a constant geodesic arc-length within
a volume space of fiber tracts. Similar to isosurface, they form a level set of
a continuous function of geodesic distance whose domain is three-dimensional
space.
    Isonodes are rendered quickly since they can be displayed as simple points or
polygons. They can be used in tractography related volume dataset visualization
schemes in medical imaging, allowing researchers to study inherently associated
local features along major fiber bundles.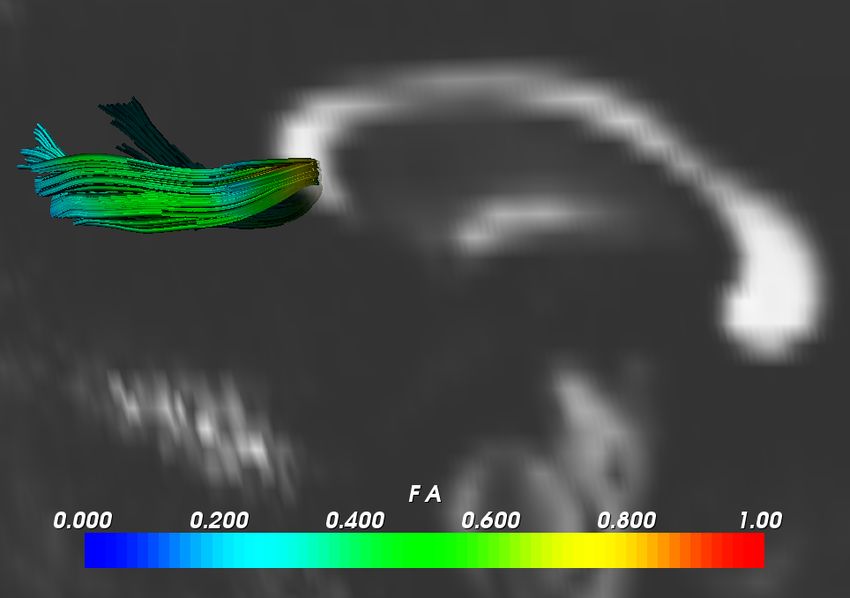
2.4    Local Diffusion Property Calculation

Fig. 2. Isonodes association. In the left-hand side subfigure, a group of isonodes are
assigned one distinct color and circled. The bottom starting point plane is blue. The
right-hand side subfigure depicts the parameterized GCC paths from fiber tracts in
Figure 1. Fiber tracts are in red and a series of isonodes are in yellow. The middle
blue plane represents the common starting points. Geodesic distances were calculated
bi-directionally originating from the starting point plane. To distinguish these two
directions, isonodes on the left-hand and right-hand sides of the starting point plane
were negatively and positively indexed by geodesic arc-length.

     Equipped with the above techniques, we modeled a set of fiber bundles
from N subjects as B = (F1 , . . . , Fk , . . . , FN ), with the k-th fiber bundle Fk =
(f1 , . . . , fi , . . . , fn ) and the i-th fiber fi = (d1 , . . . , dj , . . . , dm ), where dj is the
j-th node’s geodesic distance on the i-th fiber curve from its starting point. In
our analysis, diffusion properties were carried as attributes on each node [9].
Then the local diffusion property calculation becomes straightforward by simply
associating the previous defined isonodes. This is depicted in Figure 2.
     Let Ψi be attribute values on the i-th fiber pathway and dj the geodesic
distance of the j-th node in the curvilinear structure. Then the geodesic path
for the k-th fiber bundle with average attribute Φ¯k is computed as
                                              n
                                        1X
                             Φk (dj ) =       Ψi (dj ), j = 1, ..., m.
                                        n i=1
   We adopted the same scheme of coalescing fiber bundles among subjects for
the purpose of group comparisons. The mean attribute values Φ(dj ) across N
subjects at the j-th node is
                                          N
                                        1 X
                             Φ(dj ) =       Φk (dj ), j = 1, ..., m.
                                        N
                                            k=1

2.5    Quantitative Analysis
A non-paired student t-test was employed to evaluate the group difference in MD
and FA between mild cognitive impairment (MCI) participants and controls for
the entire region of the computed WM pathways. The integrity of these white
matter fiber tracts was further evaluated by performing a non-paired student t-
tests on isonodes across subjects along the geodesic paths. Since two comparisons
(FA and MD)were performed for each of the DTI data set, Bonferroni corrected
p values ≤ 0.025 were considered as statistically significant in this study.
2.6 Isonodes Visualization Scheme
Each group of isonodes can be associated with their distinct local statistical
feature in addition to their inherent attribute, a unique geodesic arc-length. We
rendered all the calculated isonodes overlapped on the reconstructed fiber paths.
In the process, each set of isonodes are positioned by its geodesic distance along
the fiber bundles and are color coded by their discovered statistical features.
Different color schemes and thresholds can be interactively selected by a user
depending on applications and confidence levels to obtain better understanding
of the diffusion property changes along the neuronal path.
3 Experiment and Result
3.1 Subjects and Data Acquisition
Thirty-four subjects (17 MCI participants, 17 healthy elderly adults) underwent
MRI-based DTI. Patient information and DTI data acquisition procedures are
detailed in a previous work [4]. Possible effects of gender and age have been
previously tested and excluded. Four control and two MCI subjects were removed
from the experiment since their reconstructed GCC tracts were not long enough
to reach the GCC forceps.
3.2 Group Difference in FA and MD Values
Group differences of mean FA and MD values between the MCI and control
subject groups for the entire computed GCC pathways are listed in Table 1. We
found significantly reduced FA and elevated MD in the MCI subject groups.
Table 1. Mean (± SD) values for the FA and MD measures for computed GCC path-
ways for MCI and normal control groups. The unit of MD is (106 mm2 /sec).
GCC tracts Normal Control MCI p-value df
FA 0.56 ± 0.05 0.51 ± 0.05 0.009 26
MD 844 ± 62 921 ± 88 0.014 26
The scatter plots in Figure 3 depict the distributions of the FA and MD
value of the entire region of the GCC paths in normal control and amnestic MCI
subjects separately.0.70
0.00115
0.65
0.00110
0.60
0.00105
0.55
0.00100
0.50
FA
0.00095
MD
0.45 0.00090
0.00085
0.40
0.00080
0.35
0.00075
0.30
Control MCI Control MCI
Fig. 3. Scatter plots of the FA (left) and MD (right) values of the entire region of GCC
in normal control and amnestic MCI subjects. The unit of MD is (mm2 /sec).
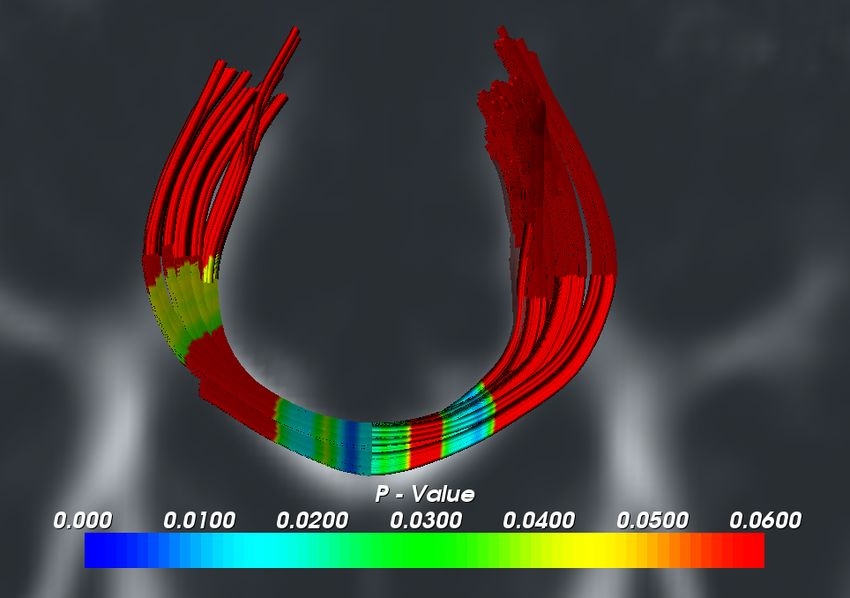
3.3 Micro Structural WM Changes along GCC Bundle
We also found specific anatomical locations along the GCC paths with signifi-
cantly reduced FA and elevated MD in the MCI subjects. The results are plotted
in Figure 4. Figure 5 visualizes the computed isonodes color indexed by their p-
values of the aforementioned comparison overlapped on the reconstructed GCC
paths.
4 Discussion
A novel fiber tract-oriented visual analysis technique is presented to inspect
and visualize the regional micro structural WM alterations along major fiber
bundles which may not be effectively revealed by existing ROI and VBM methods
due to the curved spatial nature of the fiber tracts. This method minimizes
the ROI technique’s shortcomings by representing the whole neuronal paths of
interest with the automatically extracted fiber tracts. As opposed to VBM, it
associates the fiber tract geospatial information by establishing correspondences
on geodesic distance mapping. Evaluating this approach on the GCC paths,
we found significantly reduced FA and elevated MD measures for the entire
computed pathways between the amnestic MCI and control subject groups. In
this method, we treat each individual subject’s GCC as a specific common ROI
(neuronal path of interest) based on the assumption that they represent the
same functional connectivity and hence are comparable even though they may
have different geospatial orientation. Furthermore, the regional micro structural
alterations of WM integrity along the GCC bundles in MCI participants were
effectively explored and visualized in vivo.
There are a number of limitations with this method. This technique is depen-
dent on the validation of extracted fiber tracts which is an ongoing research area.
The reconstructed fiber tracts for all individual subjects need to be validated0.9
Control
1.0
0.8 MCI
0.8
0.7
0.6
p-value
0.6
FA
0.4
0.5
0.4 0.2
0.3 0.0
-100 -50 0 50 100 -100 -50 0 50 100
Geodesic Distance Geodesic Distance
1.0
0.00120 Control
0.00115 MCI
0.8
0.00110
0.00105
0.6
p-value
0.00100
MD
0.00095
0.4
0.00090
0.00085 0.2
0.00080
0.00075 0.0
0.00070
-100 -50 0 50 100 -100 -50 0 50 100
Geodesic Distance Geodesic Distance
Fig. 4. Statistical analysis of regional micro structural FA and MD alterations along
the GCC paths. Negative and positive geodesic indices are in accordance with the left
and right parts of the starting point plane (indexed by 0) in Figure 2’s right-hand side
subfigure. The geodesic distance unit is 0.3mm. The unit of MD is (mm2 /sec).
by experts before any statistical analysis is performed. It requires that every
subject’s fiber tracts be extracted with approximately the same length, as we
can only analyze the common section of fiber tracts among all subjects. This will
prevent us from probing the whole neuronal paths in small sampled experiments.
One solution to mitigate this situation is to collect a relatively large number of
samples, so excluding some of the samples from the experiment will not affect
the statistical analysis results. Another approach is to explore improved fiber
tracking algorithms. Furthermore, it is appropriate to apply this method in fiber
bundles rather than fast dispersing fibers.
Experimental results of this study are in agreement with previous amnestic
MCI findings [4]. This shows that this new analysis method is promising and may
provide a sensitive approach to determining the integrity of neuronal traffics in
amnestic MCI.Fig. 5. Visualizations of regional micro structural FA (left) and MD (right) alterations
along the GCC tracts. p values greater than 0.06 were rendered as 0.06 for simplicity.
5 Acknowledgements
The research work of J. Zhang was supported in part by the US National Science
Foundation under grant CCF-0527967 and CCF-0727600, in part by the National
Institutes of Health under grant 1R01HL086644-01, in part by the Kentucky
Science and Engineering Foundation under grant KSEF-148-502-06-186, and in
part by the Alzheimer’s Association under grant NIRG-06-25460.
References
[1] Basser, P., Jones, D.: Diffusion-tensor MRI: Theory, experimental design and data
analysis- a technical review. NMR in Biomedicine 15(7-8) (2002) 456–467
[2] Le Bihan, D., Mangin, J., Poupon, C., Clark, C., Pappata, S., Molko, N., Chabriat,
H.: Diffusion tensor imaging: Concepts and applications. Journal of Magnetic
Resonance Imaging 13(4) (2001) 534–546
[3] Zhang, Y., Schuff, N., Jahng, G.H., Bayne, W., Mori, S., Schad, L., Mueller, S., Du,
A.T., Kramer, J., Yaffe, K., Chui, H., Jagust, W., Miller, B., Weiner, M.: Diffusion
tensor imaging of cingulum fibers in mild cognitive impairment and Alzheimer
disease. Neurology 68(1) (2007) 13–19
[4] Rose, S., McMahon, K., Janke, A., O’dowd, B., Zubicaray, G.d., Strudwick, M.,
Chalk, J.: MRI diffusion indices and neuropsychological performance in amnestic
mild cognitive impairment. Journal of Neurology, Neurosurgery, and Psychiatry
77 (2006) 1122–1128
[5] Smith, S., Jenkinson, M., Johansen-Berg, H., Rueckert, D., Nichols, T., Mackay, C.,
Watkins, K., Ciccarelli, O., Cader, M., Matthews, P., et al.: Tract-based spatial
statistics: Voxelwise analysis of multi-subject diffusion data. Neuroimage 31(4)
(2006) 1487–1505
[6] Zhang, J., Kang, N., Rose, S.: Approximating anatomical brain connectivity with
diffusion tensor MRI using kernel-based diffusion simulations. In: Proceedings of
Information Processing in Medical Imaging. Volume 19., Springer (2005) 64–75
[7] Kang, N., Zhang, J., Carlson, E., Gembris, D.: White matter fiber tractography
via anisotropic diffusion simulation in the human brain. IEEE Transactions on
Medical Imaging 24(9) (2005) 1127–1137[8] Mori, S., Crain, B., Chacko, V., van Zijl, P.: Three-dimensional tracking of axonal
projections in the brain by magnetic resonance imaging. Annals of Neurology 45(2)
(1999) 265–269
[9] Fillard, P., Gilmore, J., Lin, W., Gerig, G.: Quantitative analysis of white matter
fiber properties along geodesic paths. In: Proceedings of Medical Image Computing
and Computer-Assisted Intervention. Lecture Notes in Computer Science. Volume
2879., Springer (2003) 16–23You can also read