Dublin Industrial and Logistics Market - Savills
←
→
Page content transcription
If your browser does not render page correctly, please read the page content below
Savills Research – Market Review and Outlook 2022

MARKET
   IN                Dublin Industrial
                   and Logistics Market
MINUTES
Savills Research

                    Macro view     •   Market activity    •   Outlook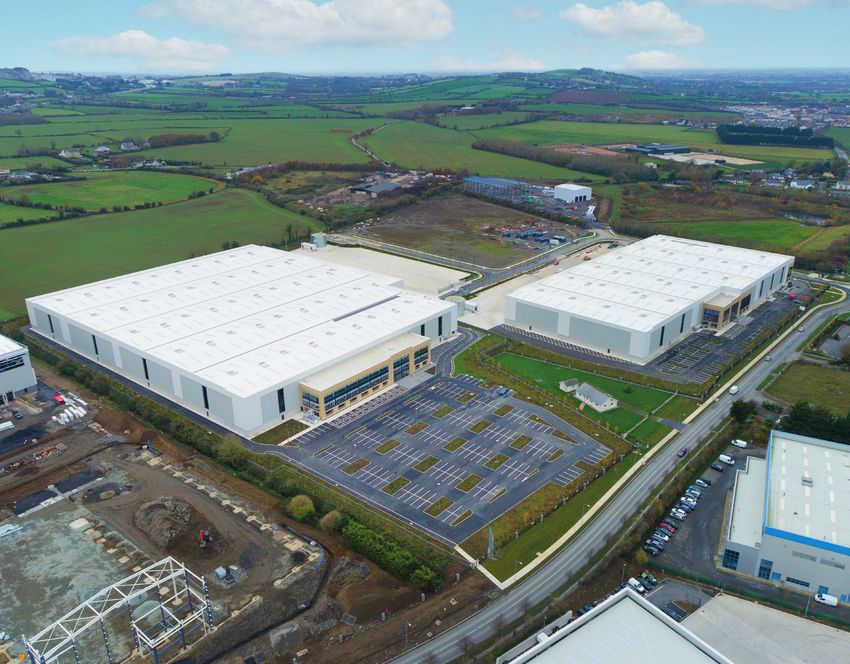
Dublin Industrial and Logistics Market Review and Outlook 2022

                                           Outlook for 2022
                                         2022 will see a quantum amount of new                  we do not forecast any slippage into 2023.

                       1                 delivery come on stream with 2.2m sq ft due
                                         to be completed. This represents a doubling
                                                                                                While the headline delivery number is high,
                                                                                                two-thirds of it is already committed, meaning
                                         of last year's new supply, which was a record          further commencements are required to meet
                      Spike in           year in itself. It is worth noting that because        prevailing occupier demand.
                       supply            all of this projected delivery is already on-site,

                                                    2
                                                     Pivot to
                                                    the north

             Historically, the south of Dublin has dominated the north              a result, 2022 is likely to be the last year where we see
             of the county in terms of take-up, in particular along the             take-up in the south – where 69% of 2022 new delivery is
             south-west corridor. Development has clustered here                    due – exceed that in the north. In fact, just 25% of the new
             due to its access to the cities of Cork, Limerick, Kilkenny            delivery pipeline beyond 2023 is currently expected to be
             and Waterford. The schemes here include Greenogue,                     delivered in the south. As a result, the north will be the focal
             Mountpark Baldonnell as well as Aerodrome. However,                    point of market activity in the coming years, thus growing
             capacity for further development in this location is tight,            in scale as an industrial and logistics cluster. For the south,
             with limited remaining land available for further expansion.           the restriction on new supply is likely to result in a scarcity
             Planning here is also restrictive, which is limiting the               rental premium for the remaining development pipeline due
             potential for future delivery through greenfield sites. As             to come on stream here.

             Figure 1: Take-up split and forecast share of delivery by location

                       South Dublin         North Dublin

                100%

                 80%

                 60%

                 40%

                 20%

                      0%
                           2016   2017       2018       2019   2020     2021    2022(f) 2023(f) 2024(f) 2025(f) 2026(f) 2027(f) 2028(f)

                                                                                                                             Source: Savills Research

savills.ie/research                                                             2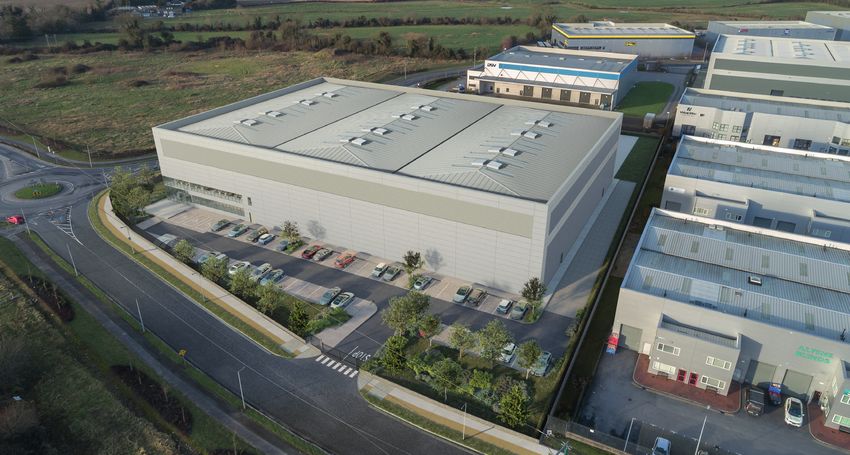
Dublin Industrial and Logistics Market Review and Outlook 2022

                      3
                              Lettings
                          outweighing sales

             The share of take-up accounted for by sales – as opposed                Figure 2: Sales share of take-up
             to lettings – fell to 14% in 2021, which represented its lowest
             level on record and down from 66% in 2014. This steady                   80%
             decline is a consequence of the shortage of space across the
             market. Traditionally, selling rather than letting was the easier        70%
             route for owners to dispose of a vacant holding. Lettings
             generally took more time and involved greater risk. However,             60%
             the progressive tightening of available space witnessed
             in recent years has changed this. Owners are now leasing                 50%
             vacant space and selling it as an investment, thus realising
             a higher end value. In effect, they are opting to take on the
                                                                                      40%
             tenancy risk themselves, leasing the assets to the large pool
             of occupiers who need space, and then selling on the assets
                                                                                      30%
             to institutional and private equity funds rather than to owner-
             occupiers. This decline in the share of owner-occupiers is
                                                                                      20%
             likely to continue because of the depth of demand from
             both occupiers and investors. Furthermore, occupiers are
                                                                                       10%
             increasingly willing to take longer leases on assets, helping
             the stability of income streams and, in turn, opening up
                                                                                        0%
             the sector to larger pools of capital. As a result, with such
             a weight of capital seeking industrial assets, it’s becoming                    2014 2015 2016 2017 2018 2019 2020 2021
             harder for occupiers to purchase premises for occupation.
                                                                                                                           Source: Savills Research

                                                                                                    4
                                                                                                       Forward funding
                                                                                                     structures taking off

            With investors increasingly finding it difficult to access           BTR sector, but industrial and logistics assets are now
            suitable stock, some are seeking to use forward funding              displaying similar characteristics of tightening yields
            structures in collaboration with Irish developers to obtain          and strong demand, making these funding types more
            assets. These structures allow investors to enter a tight            attractive. In 2021, these structures were used to fund a
            market while giving developers cost and exit certainty.              speculative development by an Irish investor comprising
            Forward funding has been more prevalent in the Irish                 of three units at Greenogue Business Park for €50m.

savills.ie/research                                                              3
Dublin Industrial and Logistics Market Review and Outlook 2022

                                                   5
                         Investors are
                           pricing in
                         further rental
                          appreciation

             Given the deep pool of capital targeting industrial assets,                                                                           buyers pricing in prime rents of €13.00 psf to be achieved
             entry yields have tightened on all asset qualities over 2021.                                                                         in the coming years in order to hit their return profiles on
             Given these underlying market conditions, investors are                                                                               exit. This would represent an increase of 16% on current
             increasingly factoring in aggressive rental growth to hit                                                                             prime rents of €11.25 psf, highlighting the strength of
             target IRRs. Based on the profiles of investors participating                                                                         occupier demand and expected low vacancy rates in the
             in the market and their required returns, we are seeing                                                                               medium-term.

             Figure 3: Historic rental growth and investor expectations

                             Prime rents                                Market expectations

                        14

                        12

                        10

                        8
                € psf

                        6

                        4

                        2

                        0
                                                                                                                                                                                                                       Q2 2021

                                                                                                                                                                                                                                 Q4 2021

                                                                                                                                                                                                                                           Q2 2022(f)

                                                                                                                                                                                                                                                        Q4 2022(f)

                                                                                                                                                                                                                                                                     Q2 2023(f)

                                                                                                                                                                                                                                                                                  Q4 2023(f)
                                                                                                                                                 Q4 2017
                                                                                                                                                           Q2 2018

                                                                                                                                                                     Q4 2018

                                                                                                                                                                               Q2 2019

                                                                                                                                                                                         Q4 2019

                                                                                                                                                                                                   Q2 2020

                                                                                                                                                                                                             Q4 2020
                                         Q4 2012

                                                   Q2 2013

                                                             Q4 2013

                                                                       Q2 2014

                                                                                 Q4 2014
                                                                                           Q2 2015

                                                                                                     Q4 2015
                                                                                                               Q2 2016

                                                                                                                         Q4 2016

                                                                                                                                   Q2 2017
                               Q2 2012

                                                                                                                                                                                                                                           Source: Savills Research

savills.ie/research                                                                                                                          4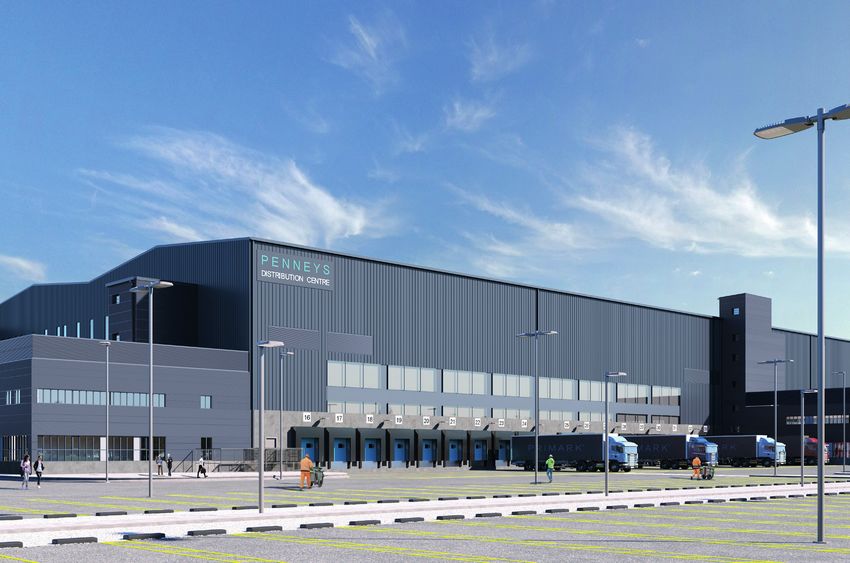
Dublin Industrial and Logistics Market Review and Outlook 2022

                             Macro view
                             Figure 4: World Container Index

                                                                 $10,000
                               Freight rate - 40 ft containers

                                                                 $8,000

 2.3 million
    sq ft
                                                                 $6,000

   of take-up transacted                                         $4,000
          in 2021

                                                                 $2,000

                                                                        $0
                                                                                Q4 2019

                                                                                          Q1 2020

                                                                                                        Q2 2020

                                                                                                                         Q3 2020

                                                                                                                                     Q4 2020

                                                                                                                                                Q1 2021

                                                                                                                                                             Q2 2021

                                                                                                                                                                              Q3 2021

                                                                                                                                                                                            Q4 2021
                                                                                                                                                          Source: Drewry Supply Chain Advisors

           48%               Disruption to global supply chains has been one
                             of the most visible economic consequences of the
                                                                                                                                   labour shortages and issues around quarantining
                                                                                                                                   requirements, delaying the normal ship docking
      of take-up was for
                             pandemic, impacting manufacturing and logistics                                                       process. More generally, lockdowns and labour
          new stock
                             costs. For example, the World Container Index                                                         shortages have created asymmetries in supply and
                             – a weighted cost measure of eight major east-                                                        demand, leaving ships stranded empty in some
                             west trading routes – has quadrupled since the                                                        locations while goods accumulate in other parts of
                             pandemic’s start. Ports remain congested due to                                                       the world.

                             Figure 5: Imports and exports as a share of GDP

           66%                                                     Ireland imports        Ireland exports                  European Union imports               European Union exports

    of stock due in 2022
                                                                 140%
      is let or reserved

                                                                 120%

                                                                 100%
                                 Share of GDP

                                                                 80%

                                                                 60%

                                                                 40%

          1.2%                                                   20%
     vacancy rate at the
        end of 2021                                               0%
                                                                             2014         2015                    2016             2017          2018                  2019              2020

                                                                                                                                                                                    Source: World Bank

savills.ie/research                                                                                 5
Dublin Industrial and Logistics Market Review and Outlook 2022
While high freight costs impact the trade of all nations, as a small, open,
island economy, Ireland is disproportionately affected by this disruption.
While high freight costs impact the trade of all nations, as a small, Over the longer-term, if consumers experience significant delays
open, island economy, Ireland is disproportionately affected by in product deliveries, companies offering improved delivery times
this disruption. Imports of goods and services were worth 109% may gain a competitive advantage in the market. To achieve this,
of Irish GDP in 2020 while exports were worth 131%, compared to companies may increasingly choose to hold more stock to facilitate
41% and 44% for the European Union as a whole. The industrial and quick deliveries or minimise the impact of any future supply shocks.
logistics sector is impacted by these elevated costs and disruption In this way, short-term disruption may lead to a long-term uplift in
as products move through the existing logistics supply chain to demand for industrial and logistics space.
storage centres.
This supply shock may influence longer-term supply and pricing
strategies. With global supply chains generally operating on a
just-in-time basis in order to fulfil orders, large spikes in demand
have collided with a sector in Ireland running very tight vacancy
levels. This could increase demand for space in the short-term, as 109%
the industry tries to adapt to a supply chain that’s intricate balance Imports of goods and services were worth
remains out of kilter. These tight conditions favour the absorption
of secondary stock that would otherwise have remained vacant for
109% of Irish GDP, while exports were
some time. worth 131%
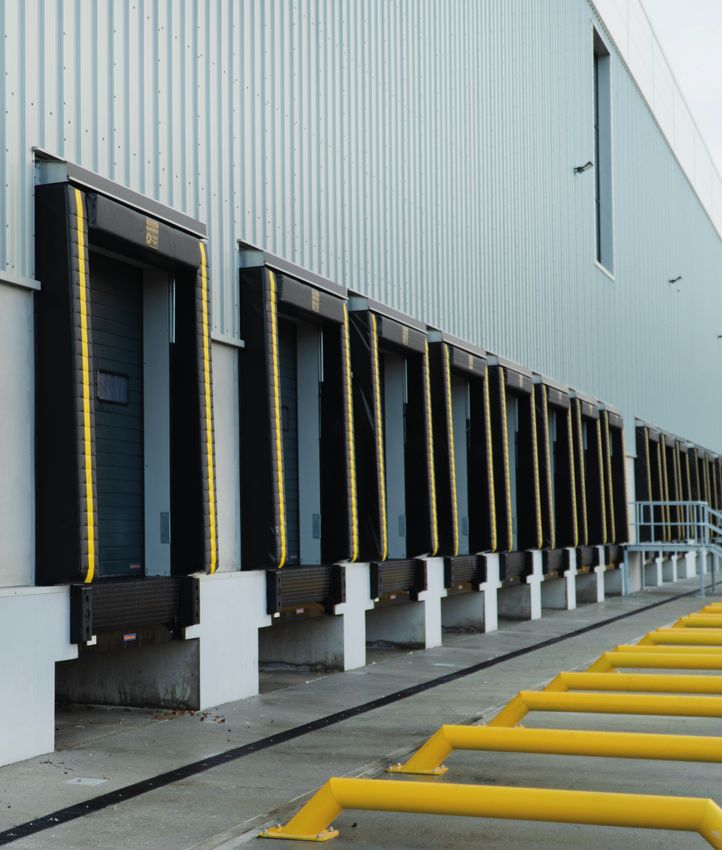
Greenogue Logistics Park, Rathcoole, Co. Dublin
savills.ie/research 6Dublin Industrial and Logistics Market Review and Outlook 2022
Market activity
Take-up totalled 2.3m sq ft in 2021, representing a decline of 31% of 29,900 sq ft, emphasising that it was the number of deals that
compared to 2020 and 20% below the five-year average. Driving took place rather than the nature of those deals that drove take-
this was a fall in the number of deals done, with the 79 transactions up lower. Activity was muted in Q1 2021, due to the lockdown, as
completed the lowest on record. This forms a part of wider trend, approximately 431,000 sq ft transacted. Take-up picked up after
with an average of 85 deals completed over the last three years, the more stringent restrictions were lifted, with 676,000 sq ft
compared to an average of 112 over the previous five. The average transacting in Q2, followed by 630,000 sq ft and 566,000 sq ft in
deal size was 29,000 sq ft in 2021, in-line with the five-year average Q3 and Q4, respectively.
Figure 6: Annual take-up
4,500,000
4,000,000
3,500,000
3,000,000
Sq ft
2,500,000
2,000,000
1,500,000
1,000,000
500,000
0
2014 2015 2016 2017 2018 2019 2020 2021
Source: Savills Research
2020
2021
2018
2015
2019
2016
2014
2017
Source: Savills Research
Northwest Logistics Park, Ballycoolin, Co. Dublin
savills.ie/research 7Dublin Industrial and Logistics Market Review and Outlook 2022
Demand for larger units remains steady
The largest deal of the year was the lease of 200,000 sq ft in the 15 big-box units larger than 50,000 sq ft transacted in 2021,
former Lufthansa building in Baldonnell Business Park in Q3. ahead of 2020 levels, and just one less than 2019. Take-up was down
Logistics firm Kuehne and Nagel’s pre-let of 165,000 sq ft in Unit 2, compared to the five-year average in all five size categories in 2021,
Horizon Logistics Park, in Q2 was the second-largest deal of the with the exception of the 50,000 to 100,000 sq ft range, which
year. The fourth-largest deal of the year for Unit A02 in The Hub provided support for average deal size. There is an assumption that
Logistics Park also transacted in Q2, with the unit only finishing average deal sizes are rising, as larger occupiers have entered the
construction in Q4. Q4 saw the third and fifth largest deals of the market. We have seen no material gain in average deal size between
year: Unit G in Aerodrome Business Park and Unit 2 in Quantum 2015 and 2021. This could be driven by a lack of availability in larger
Distribution Park. Harvey Norman’s pre-let of Unit 2, Quantum box sizes, as there has been no vacancy upon completion in stock
Distribution Park, which will not finish construction until Q3 2023, between 50,000 sq ft to 100,000 sq ft built in this cycle. If more stock
demonstrates the forward-looking stance occupiers have adopted to of this size were developed, we would expect it to be swiftly absorbed,
obtain suitable stock. providing support for the average deal size.
Table 1: Top deals
Quarter Status Property District Sq ft Tenant
Lufthansa Technik Airmotive Ireland, Baldonnell
Q3 Standing Stock SW 200,000 P&C
Business Park, Dublin 24
Kuehne and
Q2 New Build Unit D8, Horizon Logistics Park, Co. Dublin NE 165,000
Nagle
Q4 New Build Unit G, Aerodrome Business Park, Dublin 24 SW 120,000 Lifestyle Sports
Q2 New Build Unit A02, The Hub Logistics Park, Co. Dublin NW 111,000 Primeline
Q4 New Build Unit 2, Quantum Distribution Park, Kilshane Cross, Dublin 11 NE 92,000 Harvey Norman
Source: Savills Research
savills.ie/research 8Dublin Industrial and Logistics Market Review and Outlook 2022
Figure 7: Take-up by deal size
5-10,000 sq ft 10-20,000 sq ft 20-50,000 sq ft 50-100,000 sq ft >100,000 sq ft
100%
90%
80%
70%
60%
50%
40%
30%
20%
10%
0%
2014 2015 2016 2017 2018 2019 2020 2021
Source: Savills Research
New stock is driving take-up
Further reinforcing what our agents are reporting, take-up has either looking further up the pipeline for modern stock or settling
been increasingly dependent on new builds. Leases of new stock for older lower quality stock, with no middle ground.
accounted for 48% of take-up in 2021, despite accounting for just 1%
of stock.
A further 22% of take-up was in units built in the 2000s,
with pre-2000’s stock making up the remaining 30%. With no 48%
availability in stock built in the 2010s occupiers face the choice of of take-up was for brand new stock
Figure 8: New builds as a percentage of take-up
50%
45%
40%
35%
30%
25%
20%
15%
10%
5%
0%
2016 2017 2018 2019 2020 2021
Source: Savills Research
savills.ie/research
4,500,000 9Dublin Industrial and Logistics Market Review and Outlook 2022
Diverse occupier base active
While the tech sector primarily drives Dublin’s office market, the 1st party logistics typically takes the form of large retailers taking
industrial and logistics market is characterised by a diverse range logistics space to facilitate management and distribution of their
of occupiers. A mixture of demand from 1st party logistics spurred inventory between locations. These firms accounted for 43%
on by strong retail sales, 3 rd party logistics (3PLs) benefiting from of deals in 2021. Expansions from Homestore & More, Harvey
the booming e-commerce market, and industrial firms active Norman and Amazon, who have been particularly active since
in Ireland’s pharmaceutical and life science sectors bolstered 2020, have led this growth.
activity in 2021.
Crane House, Dublin Airport Logistics Park
3PL firms active in the year included Kuehne and Nagle’s Turning to industrial occupiers, Thermo Fisher pre-let 51,000 sq
previously discussed lease of 165,000 sq ft and Tradeway’s ft in Dublin Airport Logistics Park in Q1. Tosca, a firm specialising
lease of just over 17,000 sq ft in Westgate Business Park. 3PLs in sanitising trays to stringent food safety standards, leased
accounted for 25% of take-up. We may see a bump in this segment Building 1A in Greenogue Logistics Park in Q3. While Q4 saw life
in 2022, which will see several firms already operating in Dublin sciences firm Avantor leasing 69,000 sq ft in Cardinal House in
expanding their footprint. DB Schenker has reserved 133,000 sq Dublin Airport Logistics Park in the same quarter it completed.
ft in Mountpark Baldonnell and Zeus Packaging has committed to
an additional 95,000 sq ft in Greenogue Logistics Park, with both
units set for completion in 2022.
Logistics occupiers took 68% of space in 2021, with industrial tenants
taking 32%.
savills.ie/research 10Dublin Industrial and Logistics Market Review and Outlook 2022
South West Suburbs North East Suburbs North West Suburbs South East Suburbs
South-west continues to Figure 9: Take-up by location
dominate take-up
The South-west continues to account for the majority of North-east
activity, making-up 53% of take-up in 2021, which is in-line South-west 21%
with the location’s annual average. Similarly, take-up is spread 53%
between the North-west (24%) and North-east (21%) almost
exactly in-line with their average share of take-up over the
previous five years.
Central Dublin has seen little to no activity in recent years
with no development of scale taking place in the city. While
last-mile logistics has come into focus in many markets, Dublin
is yet to see this. This may be because of Dublin’s relatively
small size compared to other capital cities, which would reduce 2021
the need for more expensive centrally located hubs.
The South-west continues to account for
North-west
the majority of activity, making-up 53% 24%
South-east
of take-up in 2021. 2%
Source: Savills Research
Primark Distribution Centre, Newbridge, Kildare
South West Sub
South East Sub
North West Sub
North East Sub
savills.ie/research 11Dublin Industrial and Logistics Market Review and Outlook 2022
Case study: How Amazon is fueling take-up in the UK
Amazon's new fulfilment centre and supporting share of take-up is typically driven by large boxes rather
infrastructure accounted for more than 1.1 million sq ft of than high deal numbers there has also been an uptick in the
take-up in Dublin over the last two years. In the process, number of deals signed, growing from 6 in 2019 to 30 last
it has accounted for 19% of take-up as the company year. Finally, it is worth noting that Amazon also dominates
builds-out its operations in Ireland. Looking to the more the share of take-up accounted for by online retailers,
established UK market, we see that Amazon has accounted having a 73% market share since 2016. This expansion by
for a large share of take-up over a prolonged period of time. online retailers, accelerated by the pandemic, is likely to be
Specifically, it has accounted for 20% of growth since 2016, a long-term structural trend with Amazon expected to be at
with the last two years seeing the highest market shares the forefront of this change in Dublin for years to come.
recorded (24% in 2021 and 25% in 2020). While Amazon’s
Figure 10: UK take-up and Amazon's market share
Total Sq ft Amazon % share
60,000,000 30%
Total market take-up (sq ft)
Amazon's market share
50,000,000 25%
40,000,000 20%
30,000,000 15%
20,000,000 10%
10,000,000 5%
0 0%
2008 2009 2010 2011 2012 2013 2014 2015 2016 2017 2018 2019 2020 2021
Source: Savills Research
Amazon's new fulfilment centre and supporting infrastructure accounted for
more than 1.1 million sq ft of take-up in the last two years.
€12
Figure
€10 11: UK on-line retailers take-up and Amazon's market share
Sq ft
€8 Online retailer take up sq ft Amazon share of market %
20,000,000
€6 100%
18,000,000 90%
Take-up by on-line retailers
Q3 2021market share
€4
16,000,000 80%
14,000,000
€2 70%
12,000,000 60%
€0
10,000,000 50%
Q1 2011
Q3 2011
Q1 2012
Q3 2012
Q1 2013
Q3 2013
Q1 2014
Q3 2014
Q1 2015
Q3 2015
Q1 2016
Q3 2016
Q1 2017
Q3 2017
Q1 2018
Q3 2018
Q1 2019
Q3 2019
Q1 2020
Q3 2020
Q1 2021
Amazon's
8,000,000 40%
6,000,000 30%
Total Sq ft Amazon % share
4,000,000 20%
2,000,000 10%
0 0%
2008 2009 2010 2011 2012 2013 2014 2015 2016 2017 2018 2019 2020 2021
Source: Savills Research
savills.ie/research 12Dublin Industrial and Logistics Market Review and Outlook 2022
Supply
Record highs of new construction expected
Q4 saw eight schemes totalling 820,000 sq ft reaching practical With take-up increasingly driven by new stock during the year,
completion bringing total annual completions to 981,000 sq ft. we may see a rise in take-up in the latter half of the year as this
This is the largest quantity of space completed in a single year stock comes to the market. There is a further 2.4m sq ft of space,
since the GFC. in various stages of planning and construction, that is forecast to
While the market is now responding to rising rents with complete in 2023. Savills are aware of a further 3.2 million sq ft
an expansion in pipeline supply, completions in 2021 were due between 2024 and 2028, but this figure is likely to rise as more
just a fraction of Dublin’s overall market (1.2% of total stock). schemes enter the pipeline.
Interruptions to construction during the lockdowns have only
exacerbated the situation. Prior to the first lockdown in Q1,
we had anticipated total completions of 1.4 million sq ft. This
equates to a decline in output of 30% relative to what eventually
981,000 sq ft
finished construction.
There is 2.2 million sq ft of space on-site that will reach
practical completion in 2022, 66% of which is pre-let or reserved.
This leaves just 770,000 sq ft of pipeline space across 11 schemes worth of completions in 2021, with 2.2 million
available this year, most of which should complete in Q4 2022. sq ft forecast for 2022.
Figure 12: Construction pipeline
2,500,000
2,000,000
Sq ft
1,500,000
1,000,000
500,000
0
2021 2022(f) 2023(f) 2024(f)
Source: Savills Research
savills.ie/research 13Dublin Industrial and Logistics Market Review and Outlook 2022
1.2%
Figure 13: Vacancy rate
Q4 2021 saw an increase in the vacancy
3.0%
rate to 1.2%
2.5%
Vacancy rate edges upwards
After a steady decline over the last two years, the vacancy rate fell 2.0%
from 1.2% in Q4 2020 to 0.7% in Q3 2021 – a series low. Q4 2021 saw an
increase in the vacancy rate to 1.2%, primarily due to the completion 1.5%
of Building 2, Greenogue Business Park. When put in contrast with an
estimated vacancy rate of 15% pre-GFC, the extent of the decline in
availability is clear. The South-west has had an average vacancy rate of 1.0%
1.5% over the last four quarters with lower rates of 0.9% in the North-
east and 0.6% in the North-west. Vacancy has declined in the North-
0.5%
east and the South-west during 2021 and has risen in the North-west.
There are only two buildings built in the last ten years currently
available and less than 100,000 sq ft built since 2000. Stock 0.0%
constructed between 1970 and 2000 accounts for 57% of the vacant
Q2 2018
Q3 2018
Q4 2018
Q1 2019
Q2 2019
Q3 2019
Q4 2019
Q1 2020
Q2 2020
Q3 2020
Q4 2020
Q1 2021
Q2 2021
Q3 2021
Q4 2021
stock. Occupiers are increasingly opting to take older low-spec stock
on short term contracts and looking further along the pipeline to
obtain suitable stock. Provided they're weatherproof, even the poorest
quality units can achieve short-term leases.
Source: Savills Research
Occupiers face pressure to commit to longer leases for new builds to secure
accommodation, with minimum term certains now at least 10 years and increasing.
Rents and lease lengths continue to rise
With the pipeline well contained and limited standing stock, we have stock becoming increasingly rare, the secondary market is acting
seen upward pressure on rents: rents for prime stock have increased as a pressure release valve for demand, pushing rents from €6.50 to
from €10.50 to €11.25 over the last year, representing an increase of €8.00 in 2021, an increase of 23.0%. While occupiers may seek to find
7.6%. Occupiers face pressure to commit to longer leases for new secondary stock with a break at five years, lease lengths for secondary
builds to secure accommodation, with minimum term certains now stock are growing.
at least 10 years and increasing. With availability amongst modern
Figure 14: Prime and secondary rents
Prime rents Secondary rents
12
10
€ psf per annum
8
6
4
2
0
Q1 2014
Q2 2014
Q3 2014
Q4 2014
Q1 2015
Q2 2015
Q3 2015
Q4 2015
Q1 2016
Q2 2016
Q3 2016
Q4 2016
Q1 2017
Q2 2017
Q3 2017
Q4 2017
Q1 2018
Q2 2018
Q3 2018
Q4 2018
Q1 2019
Q2 2019
Q3 2019
Q4 2019
Q1 2020
Q2 2020
Q3 2020
Q4 2020
Q1 2021
Q2 2021
Q3 2021
Q4 2021
Source: Savills Research
savills.ie/research 14Dublin Industrial and Logistics Market Review and Outlook 2022
Savills team Gavin Butler
Director, Industrial and Logistics
Hugh Herity
Surveyor, Industrial and Logistics
Will Heffernan
Surveyor, Industrial and Logistics
Please contact us for +353 (0) 1 618 1340 +353 (0) 1 618 1743 +353 (0) 1 618 1409
further information gavin.butler@savills.ie hugh.herity@savills.ie will.heffernan@savills.ie
Tom Cadell John Ring Andrew Blennerhassett
Junior Surveyor, Industrial and Logistics Director, Research Research Analyst
+353 (0) 1 968 2012 +353 (0) 1 618 1431 +353 (0) 1 618 1705
tom.cadell@savills.ie john.ring@savills.ie andrew.blennerhassett@savills.ie
savills.ie/research 15You can also read