EARLYBIRD DYSLEXIA AND EARLY LITERACY SCREENER TECHNICAL MANUAL - JUNE 2021 - PSYARXIV
←
→
Page content transcription
If your browser does not render page correctly, please read the page content below
EarlyBird Dyslexia and Early
     Literacy Screener

     Technical Manual
           June 2021
Table of Contents

Chapter 1: Introduction……………………….…………………….………6
     Description of EarlyBird

Chapter 2: Subtest Information………………………….…………………8
     Descriptions
     Phonemic/Phonological Awareness
     Oral Language
     Sound/Symbol Correspondence
     Rapid Automatized Naming
     Word Reading

Chapter 3: Score Definitions……………………………………………….10
     Potential for Word Reading
     Dyslexia Risk Flag
     Subset Score Percentiles

Chapter 4: Psychometric Approaches.…………….……...……….………11
     Item Response Theory
     Computer Adaptive Testing
     Guidelines for Retaining Items
     Marginal Reliability
     Test-Retest Reliability
     Construct Validity
     Predictive Validity
     Classification Accuracy
     Technical Documentation

Chapter 5: Technical Documentation Part I - NCII Reliability,
Classification Accuracy, Validity
Results…………………………………………………………………………18
      Model Based Marginal Reliability
      Fall/Winter Classification Accuracy Dyslexia Risk
      Fall/Winter Classification Accuracy PWR
      Spring Classification Accuracy PWR
      Fall/Winter Predictive Validity Dyslexia Risk
      Fall/Winter Predictive Validity PWR
      Spring Concurrent Validity PWR
      Winter/Spring Construct Validity

Chapter 6 Technical Documentation Part II - Dyslexia Risk
Screener………………………………………………….……………....…...22

                    .         © 2021 EarlyBird Education ½ Technical Manual ½ 2
Procedures
         Psychometric Results
               Classical Test Theory Results
               Multiple Group Item Response Modeling
               Differential Item Functioning
         Score Validity
               Correlations and Predictive Validity
               Classification Accuracy

Chapter 7 Technical Documentation Part III - PWR Risk Screener
………………………………………………………………………………..26
     Calibration Sample
     Linking Design and Analytic Framework
     Norming Studies
     Reliability
           Marginal Reliability
           Test-Retest Reliability
     Validity
           Predictive Validity
           Classification Accuracy
     Differential Test Functioning
     Concurrent Correlations

Tables…………………………………………………….……………………29

References……………………………………………………………………..45

© 2021 EarlyBird Education, Inc.

Information in this document is subject to change without notice and does not represent a commitment on the part of
EarlyBird Education. No part of this manual may be reproduced or transmitted in any form or by any means, electronic or
mechanical, including photocopying and recording, for any purpose without the express written permission of EarlyBird
Education.

                             .                              © 2021 EarlyBird Education ½ Technical Manual ½ 3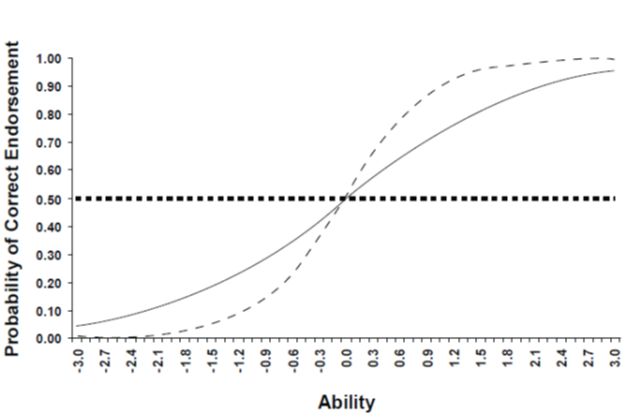
Acknowledgements
This Technical Manual for the Early Bird Kindergarten Assessment was written and based on
the research of:

Nadine Gaab, PhD., Associate Professor of Education at the Harvard Graduate School of
Education, formerly of Boston Children’s Hospital/Harvard Medical School.

Yaacov Petscher, PhD., Professor of Social Work at Florida State University, Associate Director
of the Florida Center for Reading Research, Director the Quantitative Methodology and
Innovation Division at FCRR.

Dyslexia Screener
The research for the development of the Boston Children’s Hospital Early Literacy Screener
was funded through generous grants provided by the following family foundations:
   • The Heckscher Foundation for Children
   • The Oak Foundation
   • The Poses Family Foundation
   • The Peter and Elizabeth C. Tower Foundation
   • The Emily Hall Tremaine Foundation
   • And extensive in-kind donations from Boston Children’s Hospital.

The authors would like to thank these funders for their support of this project across a multi-
year research study, as well as the many teachers, school and district administrators, and
children who participated in this research. Additionally, many experts and leaders in the fields
of literacy, education, school administration, educational policy, technology, developmental
medicine and neuroscience have served as advisors to this project, helping to ensure the
development of a screener that is both scientifically sound, and tailored to the needs of today’s
educators.

PWR Screener
The items, dynamic flow, computer-adaptive algorithms, creation of the development
application, and psychometric work for this component skills battery (called the Florida Center
for Reading Research Reading Assessment; FRA) were funded by grants from the Institute of
Education Sciences (IES) to Florida State University [Barbara Foorman, Ph.D. (PI), Yaacov
Petscher, Ph.D., Chris Schatschneider, Ph.D.) :

Institute of Education Sciences, USDOE ($4,447,990), entitled “Assessing Reading for
        Understanding: A Theory-Based, Developmental Approach,” subcontract to the
        Educational Testing Service for five years (R305F100005), 7/1/10-6/30/15 (Foorman,
        PI on subcontract).

                       .                       © 2021 EarlyBird Education ½ Technical Manual ½ 4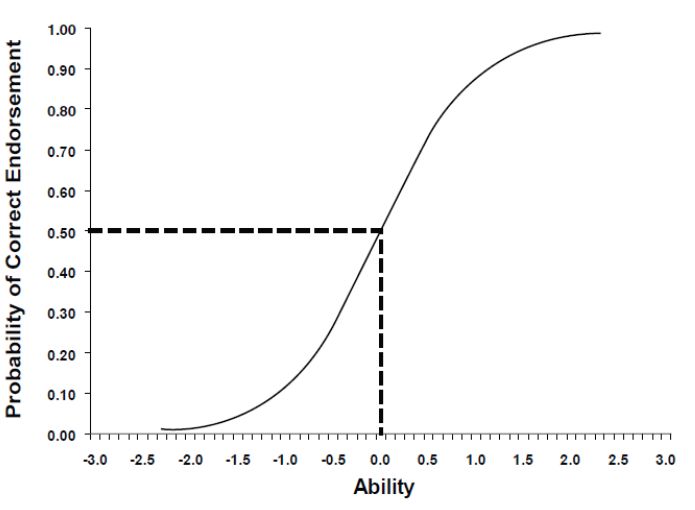
Institute of Education Sciences, USDOE (R305A100301; $1,499,741), entitled “Measuring
        Reading Progress in Struggling Adolescents,” awarded for four years, 3/1/10-2/28/14.
        (Foorman, PI; Petscher and Schatschneider, Co-Is).

We would like to acknowledge the following individuals for their leadership in to executing
the work funded by the above two IES grants: Dr. Adrea Truckenmiller, Karl Hook, and Nathan
Day. We also would like to thank the numerous school districts, administrators, and teachers
who participated in the research funded by these two grants.

                      .                      © 2021 EarlyBird Education ½ Technical Manual ½ 5
Chapter 1: Introduction
The development of basic reading skills is one major goal during the first years of elementary
school. However, in the United States, 65% of 4th graders are not reading on grade-level
according to studies conducted by the National Center for Education Statistics (McFarland et
al., 2019) and it has been shown that 70% of children who are poor readers in 3rd grade remain
poor readers throughout their educational career (Foorman, Francis, Shaywitz, Shaywitz, &
Fletcher, 1997). Furthermore, difficulties with learning to read have been associated with a
cascade of socioemotional difficulties in children, including low self-esteem; depression; and
feelings of shame, inadequacy, and helplessness (Valas, 1999). Children with learning
disabilities are less likely to complete high school and are increasingly at risk of entering the
juvenile justice system (Mallett, Stoddard-Dare, & Workman-Crenshaw, 2011). Despite the
cascade of negative consequences, most children are currently identified only after they fail
over a significant period of time and outside of the window for most effective interventions,
which has been termed the “dyslexia paradox” (Ozernov-Palchik & Gaab, 2016a,b). Research
has shown that the most effective window for early reading interventions is in kindergarten and
first grade (Lovett et al., 2017; Wanzek et al., 2018; Catts et al., 2015)), most likely even earlier.
When at-risk beginning readers received intensive reading instruction, 56%–92% (across six
research studies) achieved average reading ability (Torgesen, 2004). Early literacy milestone
screening moves this from a reactive to a proactive model and (if evidence-based response to
screening is implemented) enables a preventive educational approach.
We aimed to develop a screener for the identification of children at risk for atypical reading
and language skills in kindergarten. We are fortunate to have several consensus documents that
review decades of literature about what predicts reading success (National Research Council,
1998; National Institute of Child Health and Human Development, 2000; Rand, 2002; Rayner,
Foorman, Perfetti, Pesetsky, & Seidenberg, 2001).
Mastering the Alphabetic Principle
What matters the most to success in reading words in an alphabetic orthography such as English
is mastering the alphabetic principle, the insight that speech can be segmented into discrete
units (i.e., phonemes) that map onto orthographic (i.e., graphemic) units (Ehri et al., 2001;
Rayner et al., 2001). Oral language is acquired largely in a natural manner within a
hearing/speaking community; however, written language is not acquired naturally because the
graphemes and their relation to phonological units in speech are invented and must be taught
by literate members of the community. The various writing systems (i.e., orthographies) of the
world vary in the transparency of the sound-symbol relation. Among alphabetic orthographies,
the Finnish orthography, for example, is highly transparent: phonemes in speech relate to
graphemes in print (i.e., spelling) in a highly consistent one-to-one manner. Similarly
graphemes in print relate to phonemes in speech (i.e., decoding) in a highly consistent one-to-
one manner. Thus, learning to spell and read Finnish is relatively easy. English, however, is a
more opaque orthography. Phonemes often relate to graphemes in an inconsistent manner and
graphemes relate to phonemes in yet a different inconsistent manner. For example, if we hear
the “long sound of a” we can think of words with many different vowel spellings, such as crate,
brain, hay, they, maybe, eight, great, vein. If we see the orthographic unit –ough, we may
struggle with the various pronunciations of cough, tough, though, bough. The good news is
that 69% of monosyllabic English words—those Anglo-Saxon words most used in beginning
reading instruction—are consistent in their letter to pronunciation mapping (Ziegler, Stone, &
Jacobs, 1997). Most of the rest can be learned with grapheme-phoneme correspondence rules
(i.e., phonics), with only a small percentage of words being so irregular in their letter-sound
. © 2021 EarlyBird Education ½ Technical Manual ½ 6relations that they should be taught as sight words (Ehri, Nunes, Stahl, & Willows, 2001;
Foorman & Connor, 2011).
In the EarlyBird Assessment, the alphabetic principle is assessed with individually-
administered tasks that measure letter-sound knowledge, phonological awareness, and word
reading (for more advanced kindergarteners).
Comprehending Written Language
Knowledge of word meanings. Mastering the alphabetic principle is a necessary, but not
sufficient, condition for understanding written text. We may be able to pronounce printed
words, but if we don’t know their meaning our comprehension of any text is likely to be
impeded significantly. Hence, our knowledge of word meanings is crucial to comprehending
what we read. Grasping the meaning of a word is more than knowing its definition in a
particular passage. Knowing the meaning of a word means knowing its full lexical entry in a
dictionary: pronunciation, spelling, multiple meanings in a variety of contexts, synonyms,
antonyms, idiomatic use, related words, etymology, and morphological structure. For example,
a dictionary entry for the word exacerbate says that it is a verb meaning: 1) to increase the
severity, bitterness, or violence of (disease, ill feeling, etc.); aggravate or 2) to embitter the
feelings of (a person); irritate; exasperate (e.g., foolish words that only exacerbated the
quarrel). It comes from the Latin word exacerbātus (the past participle of exacerbāre: to
exasperate, provoke), equivalent to ex + acerbatus (acerbate). Synonyms are: intensify,
inflame, worsen, embitter. Antonyms are: relieve, sooth, alleviate, assuage. Idiomatic
equivalents are: add fuel to the flame, fan the flames, feed the fire, or pour oil on the fire. The
more a reader knows about the meaning of a word like exacerbate, the greater the lexical
quality the reader has and the more likely the reader will be able to recognize the word quickly
in text, with full comprehension of its meaning (Perfetti & Stafura, 2014). In the EarlyBird
screener, knowledge of word meanings is measured in kindergarten by two vocabulary tasks:
1) a word matching task called Word Matching and 2) a receptive vocabulary task called
Vocabulary. During the Word Matching task, the child’s task is to tough the two out of three
words (or pictures) which are also presented orally that go together (e.g., blue, triangle, yellow).
During the Vocabulary task, students hear a spoken word and need to decide which one of the
four presented pictures represents that word.
Oral listening comprehension/syntactic awareness. In addition to understanding word
meanings, another important aspect of successful reading acquisition is the ability to
understand complex sentences which includes morphological and syntactic awareness. Syntax
or grammar refers to the rules that govern how words are ordered to make meaningful
sentences. Children typically acquire these rules in their native language prior to formal
schooling. However, learning to apply these rules to reading and writing is a goal of formal
schooling and takes years of instruction and practice. In the EarlyBird screener, there are two
tasks in kindergarten that address oral listening comprehension/syntactic awareness . One is
called Following Directions and requires that the student touch the objects on the screen as
prescribed by the directions (e.g., click on the cat and then click on the heart; click on the book
after clicking on the airplane; before clicking on the book, click on the smallest cat). The other
task is called Oral Listening Comprehension and requires that the student listen to a sentence
and touch the one of four pictures which best represents the sentence (e.g., point to the picture
of the bird flying away from the nest). It is important to note that atypical reading development
has a multifactorial etiology. Causes can be observed on biological, psychological, and/or
environmental levels and the identification of children who exhibit atypical reading
development requires multifactorial strategies for screening and interventions (Catts &
. © 2021 EarlyBird Education ½ Technical Manual ½ 7Petscher, 2020; Ozernov-Palchik et al., 2016a,b). Numerous longitudinal research studies (for
an overview see Ozernov-Palchik et al., 2016a) have identified behavioral precursors of
typical/atypical reading development. In general, research has established that successful
reading acquisition requires the integration of the “mechanics” of reading (e.g. decoding skills
which require letter sound knowledge and phonological awareness) and oral language skills,
including vocabulary and oral listening comprehension (Scarborough, 2001). Early pre-literacy
skills related to these two components have been shown to predict reading skills and these
include phonological awareness, phonological memory, letter sound/name skills, rapid
automatized naming, vocabulary and oral listening skills. The EarlyBird tool incorporates all
of these skills as outlined below.
Description of EarlyBird Game System
The EarlyBird Kindergarten Assessment is a gamified mobile app, that is easy, quick,
accessible, and child-centered, and can be completed prior to formal reading instruction. It is
self-administered in small groups with teacher oversight and, depending on the subtests
administered, takes 20-50 minutes per child. The assessments address literacy milestones that
have been found to be predictive of subsequent reading success in kindergarten aged children.
No trained adult administration is needed. Scoring is largely automated. EarlyBird includes
screening for severe reading risk (hereafter referred to as Dyslexia Screener) and moderate
reading risk (hereafter referred to as Potential for Word Reading, or PWR screener). The
technical documentation is presented separately for each screener system even though the
assessment system is streamlined in the EarlyBird administration process.
In the game, the child enters a park and is told that they can go on a journey in order to reach
the lake to sail their toy sailboat. The child is paired with a feathery friend, named Pip, who
will travel with them and act as a guide as they meet new animal friends, and demonstrate each
assessment before the child attempts them. At the end of each game, the child is rewarded with
a virtual prize, travelling along the path and getting closer to their final destination at the lake.
When the child finishes the game, a score report is created on the teacher’s web-based
dashboard.
All subtests can be administered in Fall, Winter and Spring – acknowledging that they are
normed against one time of year. To enable the most appropriate use of the assessment,
recommendations will provide guidance on which subtests should be administered given the
time of year and/or which subtests provide the appropriate follow-on should a child
demonstrate weakness in select subtests.
Chapter 2: Subtest Information
Description of Subtests
Phonemic/Phonological Awareness
Rhyming – Moose: Rhyming is a computer adaptive task that presents three pictures at a time,
naming each one. After the student listens to the three words, he or she identifies the two
rhyming words by tapping the rhyming pictures.
. © 2021 EarlyBird Education ½ Technical Manual ½ 8For example, “Which two words end with the same sound?” The words with pictures ‘duck’,
‘man’, and ‘fan’ are presented. After the student listens to the three words, he or she identifies
the two rhyming words as ‘man’ and ‘fan’.
First Sound Matching – Tiger: First Sound Matching is a computer adaptive task that
measures a student’s ability to isolate and match the initial phonemes in words. This task
presents one picture as a stimulus, asking the student to listen to the first sound in that word.
Three additional pictures are presented asking the student to touch the picture with the
matching first sound.
For example, “This is a dog, and hand, toy, doll. Which one starts with the same sounds as,
dog?” The student touches the picture of the dog to identify the correct matching first sound.
Phonological Awareness Blending (Blending) – Kangaroo: The Blending task is a computer
adaptive task that requires students to listen to a word that has been broken into parts and then
blend them together to reproduce the full word. The items in this task include compound words,
words that require blending of the onset and rime, and words requiring the blending of three or
more phonemes (e.g.: “What would the word be if I say: /h/ /orn/”).
Phonological Awareness Deletion (Deletion) – Elephant: The Deletion task is a computer
adaptive task that measures the ability to remove phonological segments from spoken words
to form other words. The items in this task include compound words, words that include the
onset and rime, and words including three or more phonemes ( e.g.: “Say ladybug” “Now, say
ladybug without saying /bug/”).
Nonword Repetition - Ostrich: Nonword Repetition is a computer adaptive task that presents
sounds in a spoken word form for the student to listen to and repeat. This can be in the form
of a one- to five-syllable word. The student hears phonemes in a sequence that they have not
heard before and asked to repeat the sequence.
For example, a student hears the word ‘tav’ and is asked to repeat. The student must rely on
their phonological short-term memory to repeat the sequence correctly.
Oral Language
Word Matching (WM) - Gorilla: Word Matching is a computer adaptive task that measures
the ability to perceive relationships between words that are related by semantic class features
where three written words (or pictures) appear on the screen and are pronounced by the app.
The student then selects the two words that go together best (e.g.: “Fish, Moon, Sun: Which
two go together best?”).
Oral Sentence Comprehension (OSC) - Rhino: The Oral Sentence Comprehension task is a
computer adaptive receptive syntactic measure in which the student selects the one picture out
of the four presented on the screen that depicts the sentence given by the computer (e.g., click
on the picture of the bird flying towards the nest).
Follow Directions (FD) - Zebra: The Follow Directions task is a computer-adaptive task that
requires students to listen to and interpret spoken directions of increasing length and
complexity; remember the names, characteristics, and order of mention of pictures; and identify
from among several choices the targeted objects. Items consist of an array of objects on the
screen and a set of audio instructions. Students respond to the directions by touching the
specified objects on the screen, as instructed (e.g., click on the cat and then click on the heart).
. © 2021 EarlyBird Education ½ Technical Manual ½ 9Vocabulary – Alpaca: Vocabulary is a computer adaptive task that measures a student’s
receptive vocabulary skills. Students are listening to one word and need to decide which picture
is representing the word. The students are presented with four pictures at a time and asked to
find one in particular.
Sound/Symbol Correspondence
Letter Name - Crocodile: Letter Name is a computer adaptive task where four letters are
presented in uppercase. The student is prompted with the name of one of the letters and asked
to identify the correct letter by touching it on the screen.
For example, “Touch the letter O.” The student sees choices B, O, H, and A and responds by
touching a letter ‘O’ on the screen.
Letter Sound - Giraffe: Letter Sound is a computer adaptive task where four graphemes are
presented in uppercase. These graphemes include individual letters as well as digraphs. The
student is prompted with the sound of one of the graphemes and asked to identify the correct
grapheme by touching it on the screen.
Rapid automatized Naming
Rapid Automatized Naming - Polar bear: The Rapid Automatized Naming task uses a set
of five objects (house, door, cat, ear, bed) that are repeated in random order in five rows,
totaling 50 objects. The student is measured on how fast he or she is able to name each object
out loud across each row. The number of seconds it takes for the student to name all 50 objects
provides the data for the final score. The student’s response is recorded to the dashboard and
available to the teacher for later confirmation of time and accuracy.
Word Reading is a computer-adaptive task where a word appears on the screen. The student
then attempts to read it aloud. These words represent a wide range of difficulty from single
syllable sight words to multi-syllable words.
Chapter 3: Score Definitions
Several different kinds of scores are provided in order to facilitate a diverse set of educational
decisions. In this section, we describe the types of scores provided for each measure, define
each score, and indicate its primary utility within the decision making framework. A percentile
rank is provided for each computer adaptive task at each time point.
Potential For Word Reading (PWR)
The PWR score is the probability, expressed as a percentage, that a student will reach grade-
level expectations in word reading, by the end of the year. How it works: An analysis was done
to determine which subtest scores, for the particular time of year (fall, winter or spring), are
most predictive of achieving targeted grade-level performance at the end of the year. Reaching
expectations, for the purposes of this analysis, is defined as performing above 40th percentile
on the SESAT – 10 (Stanford Early School Achievement Test): a reasonable standard for
measuring grade level expectation word reading in Kindergarten. The PWR score is a multi-
factoral calculation that involves a selection of the most predictive subtests and an aggregation
and weight averaging of that data according to degree of predictability to generate a single
. © 2021 EarlyBird Education ½ Technical Manual ½ 10output score. For Kindergarten, the screening tasks include phonological awareness blending,
letter name knowledge and word matching, and, at year end, word reading. The PWR can be
administered/calculated three times per year: Fall, Winter and Spring.
Dyslexia Risk Flag
The Dyslexia Risk “Flag” indicates the likelihood that a student will be at risk for severe word
reading struggles at year end [presuming the student doesn’t receive appropriate remediation].
This risk calculation is based on a compilation of research conducted by the authors and other
leaders in the field, revealing that those with severe word reading risk profiles are likely to
have dyslexia. How it works: An analysis was done to determine which subtest scores are most
predictive of the targeted performance at the end of the year. For the purposes of this analysis,
severe word reading struggles are defined as performing at or below 16th percentile on the
KTEA-3 Phonological Processing. The calculation involves a selection of our most predictive
subtests and an aggregation and weight averaging of that data according to degree of
predictability to generate a single output score which is conveyed as a “flag”. That flag
indicates the likelihood that a student will score poorly on the KTEA task. Any child flagged
for dyslexia risk is at high risk for low reading proficiency by year end and needs supplemental
and/or intensive instruction targeted to the student’s skill weaknesses. The Dyslexia Risk Flag
can be administered/calculated any time of year, recognizing that it is based on a normative
sample performance for the late fall/early winter period.
Subtest Score Percentiles
Percentile ranks can vary from 1 to 99, and the distribution of scores were created from a large
standardization sample and divided into 100 groups that contain approximately the same
number of observations in each group. For example, a kindergarten student who scored at the
60th percentile would have obtained a score better than about 60% of the students in the
standardization sample. The percentile rank is an ordinal variable meaning that it cannot be
added, subtracted, used to create a mean score, or in any other way mathematically
manipulated. The median is always used to describe the midpoint of a distribution of percentile
ranks. Because this score compares a student’s performance to other students within a grade
level, it is meaningful in determining the skill strengths and skill weaknesses for a student as
compared to other students’ performance.
Chapter 4: Psychometric Approaches
Item Response Theory (IRT)
Scores from the EarlyBird Assessments were analyzed through a combination of measurement
frameworks and techniques. Traditional testing and analysis of items involves estimating the
difficulty of the item (based on the percentage of respondents correctly answering the item) as
well as discrimination (how well individual items relate to overall test performance). This falls
into the realm of measurement known as classical test theory (CTT). While such practices are
commonplace in assessment development, IRT holds several advantages over CTT. When
using CTT, the difficulty of an item depends on the group of individuals on which the data
. © 2021 EarlyBird Education ½ Technical Manual ½ 11were collected. This means that if a sample has more students that perform at an above-average
level, the easier the items will appear; but if the sample has more below-average performers,
the items will appear to be more difficult. Similarly, the more that students differ in their ability,
the more likely the discrimination of the items will be high; the more that the students are
similar in their ability, the lower the discrimination will be. One could correctly infer that scores
from a CTT approach are entirely dependent on the makeup of the sample.
The benefits of IRT are such that 1) the difficulty and discrimination are not dependent on the
group(s) from which they were initially estimated, 2) scores describing students’ ability are not
related to the difficulty of the test, 3) shorter tests can be created that are more reliable than a
longer test, and 4) item statistics and the ability of students are reported on the same scale.
Item difficulty. The difficulty of an item (b) has traditionally been described for many
tests as a “p-value”, which corresponds to the percent of respondents correctly answering an
item. Values from this perspective range from 0% to 100% with high values indicating easier
items and low values indicating hard items. Item difficulty in an IRT model does not represent
proportion correct, but is rather represented as estimates along a continuum of -3.0 to +3.0.
Figure 1 demonstrates a sample item characteristic curve which describes item properties from
IRT. Along the x-axis is the ability of the individual. As previously mentioned, the ability of
students and item statistics are reported on the same scale. Thus, the x-axis is a simultaneous
representation of student ability and item difficulty. Negative values along the x-axis will
indicate that items are easier, while positive values describe harder items. Pertaining to
students, negative values describe individuals who perform below average, while positive
values identify students who perform above average. A value of zero for both students and
items reflects average level of either ability or difficulty.
Along the y-axis is the probability of a correct response, which varies across the level of
difficulty. Item difficulty is defined as the value on the x-axis at which the probability of
correctly endorsing the item is 0.50. As demonstrated for the sample item in Figure 1, the
difficulty of this item would be 0.0. Item characteristic curves are graphical representations
generated for each item that allow the user to see how the probability of getting the item correct
changes for different levels of the x-axis. Students with an ability (θ) of -3.0 would have an
approximate 0.01 chance of getting the item correct, while students with an ability of 3.0 would
have a nearly 99% chance of getting an item correct.
. © 2021 EarlyBird Education ½ Technical Manual ½ 12Figure 1: Sample Item Characteristic Curve
Item Discrimination. Item Discrimination is related to the relationship between how a
student responds to an item and their subsequent performance on the rest of a test. In IRT it
describes the extent to which an item can differentiate the probability of correctly endorsing an
item across the range of ability (i.e., -3.0 to +3.0). Figure 2 provides an example of how
discrimination operates in the IRT framework. For all three items presented in Figure 2, the
difficulty has been held constant at 0.0, while the discriminations are variable. The dashed line
(Item 1) shows an item with strong discrimination, the solid line (Item 2) represents an item
with acceptable discrimination, and the dotted line (Item 3) is indicative of an item that does
not discriminate. It is observed that for Item 3, regardless of the level of ability for a student,
the probability of getting the item right is the same. Both high ability students and low ability
students have the same chance of doing well on this item. Item 1 demonstrates that as the x-
axis increases, the probability of getting the item correct changes as well. Notice that small
changes between -1.0 and +1.0 on the x-axis result in large changes on the y-axis. This indicates
that the item discriminates well among students, and that individuals with higher ability have
a greater probability of getting the item correct. Item 2 shows that while an increase in ability
produces an increase in the probability of a correct response, the increase is not as large as is
observed for Item 1, and is thus a poorer discriminating item.
. © 2021 EarlyBird Education ½ Technical Manual ½ 13Figure 2: Sample Item Characteristic Curves with Varied Discriminations 2PL models were fit using mirt package (Chalmers, 2012) and were evaluated using local fit (i.e., performance of the individual items) and goodness-of-fit based onβ the M2 statistic (Maydeu-Olivares, 2013), the root mean square error of approximation based on M2 (RMSEA2), the Comparative Fit Index (CFI) and the Tucker-Lewis Index (TLI). M2 is often sensitive to sample size in terms of rejecting the fitted model, thus, the RMSEA2 is useful for determining adequate fit (
Guidelines for Retaining Items

Several criteria were used to evaluate item performance. The first process was to identify items
which demonstrated strong floor or ceiling effects in response rates >= 95%. Such items are
not useful in creating an item bank as there is little variability in whether students are successful
on the item. In addition to evaluating the descriptive response rate, we estimated item-total
correlations. Items with negative values are indicative of poor functioning such that it suggests
individuals who correctly answer the question tend to have lower total scores. Similarly, items
with low item-total correlations indicate the lack of a relation between item and total test
performance. Items with correlations
delta scale; Holland & Thayer, 1988). Effect size values = 1.5 is considered large.

Marginal Reliability

Reliability describes how consistent test scores will be across multiple administrations over
time, as well as how well one form of the test relates to another. Because the PWR uses Item
Response Theory (IRT) as its method of validation, reliability takes on a different meaning
than from a Classical Test Theory (CTT) perspective. The biggest difference between the two
approaches is the assumption made about the measurement error related to the test scores. CTT
treats the error variance as being the same for all scores, whereas the IRT view is that the level
of error is dependent on the ability of the individual. As such, reliability in IRT becomes more
about the level of precision of measurement across ability, and it may sometimes be difficult
to summarize the precision of scores in IRT with a single number. Although it is often more
useful to graphically represent the standard error across ability levels to gauge for what range
of abilities the test is more or less informative, it is possible to estimate a generic estimate of
reliability known as marginal reliability (Sireci, Thissen, & Wainer, 1991) with:

                                          ¯    #"# − #$∗
                                                       #
                                          !=
                                                   #"#

where #"# is the variance of ability score for the normative sample and #$∗
                                                                         # is the mean-squared

error.

Test-Retest Reliability

The extent to which a sample of students performs consistently on the same assessment across
multiple occasions is an indication of test-retest reliability.

Construct Validity

Construct validity describes how well scores from an assessment measure the construct it is
intended to measure. Components of construct validity include convergent validity, which can
be evaluated by testing relations between a developed assessment and another related
assessment, and discriminant validity, which can be evaluated by correlating scores from a
developed assessment with an unrelated assessment. The goal of the former is to yield a high
association which indicates that the developed measure converges, or is empirically linked to,
the intended construct. The goal of the latter is to yield a lower association which indicates that
the developed measure is unrelated to a particular construct of interest.

Predictive Validity

The predictive validity of scores to the selected criterions were addressed through a series of
linear and logistic regressions. The linear regressions were run two ways. First, a correlation
analysis was used to evaluate the strength of relations between and among each the EarlyBird
Assessments and norm-referenced tests. Second, a multiple regression was run to estimate the
total amount of variance that the linear combination of selected predictors explained in selected
criterions.

                       .                        © 2021 EarlyBird Education ½ Technical Manual ½ 16
Classification Accuracy
Logistic regressions were used, in part, to calibrate classification accuracy. Students’
performance on the selected criterions were coded as ‘1’ for performance at or above the 40th
percentile on the SESAT (for PWR) or below the 16th percentile on the KTEA-3 Phonological
Processing (for Dyslexia Risk flag), and ‘0’ for scores that did not meet these criteria. In this
way, the PWR represents a prediction of success and the Dyslexia flag is a prediction of risk.
Each dichotomous variable was then regressed on a combination of EarlyBird Assessments.
As such, students could be identified as not at-risk on the multifactorial combination of
screening tasks via the joint probability and demonstrating adequate performance on the
criterion (i.e., specificity or true-negatives), at-risk on the combination of screening task scores
via the joint probability and not demonstrating adequate performance on the criterion (i.e.,
sensitivity or true-positives), not at-risk based on the combination of screening task scores but
at-risk on a criterion (i.e., false negative error), or at-risk on the combination of screening task
scores but not at-risk on the criterion (i.e., false positive error). Classification of students in
these categories allows for the evaluation of cut-points on the combination of screening tasks
(i.e., PWR) to determine which the cut-point maximizing selected indicators. The concept of
risk or success can be viewed in many ways, including the concept as a “percent chance” which
is a number between 0 and 100, with 0 meaning there is no chance that a student will develop
a problem, and 100 being there is no chance the student will not develop a problem. When
attempting to identify children who are “at-risk” for poor performance on some type of future
measure of reading achievement, this is typically a yes/no decision based upon some kind of
“cut-point” along a continuum of risk.
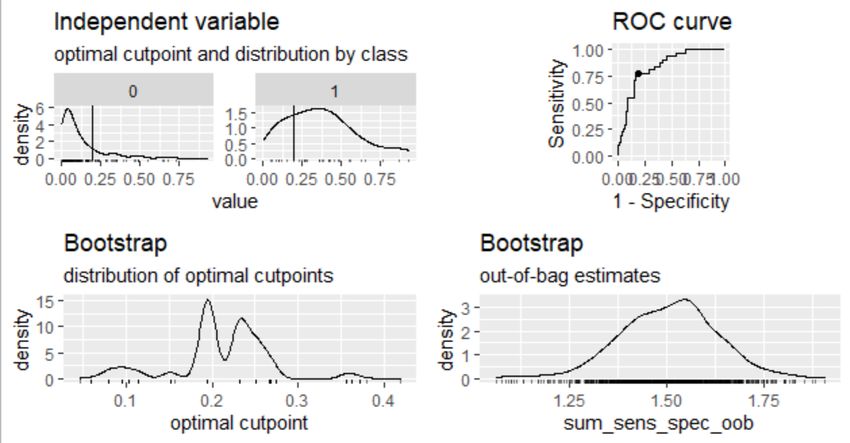
Decisions concerning appropriate cut-points are made based on the level of correct
classification that is desired from the screening assessments. A variety of statistics may be used
to guide such choices (e.g., sensitivity, specificity, positive and negative predictive power; see
Schatschneider, Petscher & Williams, 2008) and each was considered in light of the other in
choosing appropriate cut-points. Area under the curve, sensitivity, and specificity estimates
from the final logistic regression model were bootstrapped 1,000 times in order to obtain a 95%
confidence interval of scores using the cutpointr package in R statistical software.
Technical Documentation
The following sections provide technical detailing of the samples, data collection efforts, and
associated results with the Dyslexia Risk and PWR Screener systems. The Dyslexia Risk
system was validated through efforts at Boston Children’s Hospital and the PWR system was
validated through efforts at Florida State University; thus, validation processes are described
within each system along with evidence from an integration study led by Boston Children’s
Hospital. To facilitate access to pertinent technical information, Part I provides a brief
summary of results approximately commensurate with criteria from the National Center on
Intensive Intervention’s (NCII) academic screening tool chart criteria. Part II provides detailed
documentation of procedures and results from the Dyslexia Risk Screener Validation Study.
Part III provides detailed documentation of procedures and results from the PWR Screener
Validation Study.
. © 2021 EarlyBird Education ½ Technical Manual ½ 17Chapter 5: Technical Documentation Part I - NCII Reliability, Classification Accuracy, Validity
Criteria Information
Model-Based Marginal Reliability with Confidence Interval from 2PL Unidimensional, Item
Response Theory – for the EarlyBird subtests
Task Marginal Reliability 95% CI LB 95% CI UB
First Sound Matching 0.88 0.87 0.91
NonWord Repetition 0.91 0.89 0.92
Word Matching 0.91 0.90 0.92
Letter Names 0.85 0.83 0.87
Letter Sounds 0.97 0.96 0.97
Phonological Awareness Blending 0.99 0.98 0.99
Phonological Awareness Deletion 0.94 0.93 0.95
Word Matching 0.87 0.84 0.89
Following Directions 0.94 0.93 0.94
Word Reading 0.98 0.97 0.99
Sentence Comprehension 0.89 0.88 0.90
RAN - - -
Note. RAN is a time-limited task and does not have a marginal reliability estimate.
Fall/Winter Classification Accuracy for Dyslexia Risk (16th percentile KTEA – Phonological
Processing)
Mean Bootstrapped Area Under the Curve = 0.85 (95% Confidence Interval = 0.80, 0.90)
Mean Bootstrapped Sensitivity = 0.81
Mean Bootstrapped Specificity = 0.80
True Positive N = 24, True Negative N = 124, False Positive N = 29, False Negative N = 7.
Base rate = 16.8%
Fall/Winter Classification Accuracy for Potential for Word Reading Success (40th percentile
–SESAT Word Reading)
Mean Bootstrapped Area Under the Curve = 0.84 (95% Confidence Interval = 0.81, 0.88)
Mean Bootstrapped Sensitivity = 0.81
Mean Bootstrapped Specificity = 0.72
True Positive N = 60, True Negative N = 74, False Positive N = 29, False Negative N = 14.
Base rate = 41.8%
Spring Classification Accuracy for Potential for Word Reading Success (40th percentile –
SESAT Word Reading)
Mean Bootstrapped Area Under the Curve = 0.88 (95% Confidence Interval = 0.86, 0.90)
Mean Bootstrapped Sensitivity = 0.83
Mean Bootstrapped Specificity = 0.87
True Positive N = 58, True Negative N = 79, False Positive N = 12, False Negative N = 13.
Base rate = 41.8%
. © 2021 EarlyBird Education ½ Technical Manual ½ 18Fall/Winter Predictive Validity Coefficient for Dyslexia Risk (KTEA – Phonological
Processing)
Multiple r = .61, 95% CI = .50, .69, n = 184
Fall/Winter Predictive Validity Coefficient for Potential for Word Reading Success (SESAT
Word Reading)
Multiple r = .67, 95% CI = .58, .74, n = 183
Spring Concurrent Validity Coefficient for Potential for Word Reading Success (SESAT Word
Reading)
Multiple r = .73, 95% CI = .65, .79, n = 164
. © 2021 EarlyBird Education ½ Technical Manual ½ 19Correlations among Winter EarlyBird subtests, and Spring Standardized Assessment Battery
Variable M SD 1 2 3 4 5 6 7 8 9 10 11 12 13 14 15 16 17 18 19 20
1. BL (N=210) -2.23 2.38
2. DEL (N=101) -1.14 1.41 .44
3. FD (N=97) -1.09 1.25 .17 .17
4. LN (N=94) 3.07 2.87 .14 .26 .27
5. LS (N=213) -0.08 1.60 .39 .31 .18 .23
6. SS (N=97) -0.32 0.94 .17 .17 .26 .18 .25
7. VP (N=213) 0.33 1.64 .20 .23 .09 .22 .22 .34
8. FSM (N=191) 0.18 0.99 .56 .37 .15 .26 .51 .16 .25
9. NWR (N=200) 0.12 0.85 .48 .44 .16 .27 .37 .16 .24 .51
10. RHYM (N=195) 0.14 0.90 .26 .23 .34 .47 .25 .20 .38 .39 .43
11. WM (N=204) 0.09 0.89 .30 .32 .34 .40 .30 .48 .34 .46 .51 .39
12. RAN (N=175) 84.27 27.86 -.30 -.09 -.09 -.24 -.28 -.16 -.22 -.41 -.23 -.23 -.25
13. K-LWR (N=139) 96.78 13.50 .27 .14 .33 .19 .43 .28 .13 .45 .25 .34 .22 -.26
14. K-NWD (N=111) 92.45 13.01 .23 .12 .21 .28 .31 .26 .15 .46 .27 .42 .24 -.33 .86
15. K-P (N=215) 100.02 14.85 .39 .46 .33 .30 .35 .17 .27 .51 .46 .53 .36 -.20 .63 .72
16. K-D (N=103) 93.17 14.74 .31 .15 .39 .23 .31 .24 .12 .50 .24 .43 .23 -.40 .84 .81 .84
17. WID (N=192) 97.16 16.29 .22 .05 .34 .24 .34 .17 .18 .48 .23 .41 .24 -.26 .91 .77 .62 .84
18. WA (N=192) 99.31 14.45 .30 .03 .29 .28 .27 .15 .23 .49 .34 .47 .32 -.24 .79 .75 .71 .80 .81
19. SWE (N=108) 94.03 16.44 .31 .23 .44 .19 .40 .20 .22 .52 .30 .44 .26 -.27 .92 .79 .71 .88 .91 .77
20. PDE (N=108) 94.95 13.62 .27 .18 .39 .14 .34 .05 .18 .54 .30 .44 .30 -.34 .82 .82 .71 .84 .77 .73 .85
21. CELF (N=219) 103.26 12.17 .12 .08 .43 .37 .25 .38 .28 .27 .44 .43 .45 -.02 .21 .34 .46 .31 .21 .31 .29 .36
Note: M = mean, SD= standard deviation, BL = Blending, DEL = Deletion, FD = Following Directions, LN = Letter Name Knowledge, LS =
Letter Sound Knowledge, SS = Sentence Structure/Oral Sentence Comprehension), VP = Vocabulary/Vocabulary Pairs,, FSM = First Sound
Matching, NWR = Nonword Repetition, RHYM = Rhyming, WM = Word Matching, K-LWR = KTEA Letter Word Recognition, K-NWD =
KTEA Nonsense Word Decoding, K-P = KTEA Phonological Processing, K-D = KTEA Dyslexia, WID = WRMT Word Identification, WA =
WRMT Word Attack, SWE = TOWRE Sight Word Efficiency, PDE = TOWRE Phonemic Decoding Efficiency, CELF = CELF Sentence
Structure. Bold values indicates p < .05.
© 2021 EarlyBird Education ½ Technical Manual ½ 21Chapter 6: Technical Documentation Part II - Dyslexia Risk Screener
The Gaab Lab (then at Boston Children’s Hospital) designed and executed two validation
studies for BELS (now EarlyBird) over the course of the 2018/2019 (Pilot Study; results
available upon request) and 2019/2020 (Validation Study) academic school year.
Procedures
BCH validation study was designed as a nationwide study to assess predictive validity of the
screener. The goal of the study was to measure the extent to which BELS can predict end-of-
year language and literacy outcomes when administered at the beginning of the Kindergarten
school year. The first phase of predictive validation was completed between August and
November 2019. We assessed 419 children (215 female, 200 male, 4 unknown, average age
of 5.08 years; Table 1 and 2) in 19 schools and eight states in every region of the country
including MT, MO, MA, NY, LA, PA, RI, and TX. Using the same exclusionary/inclusionary
criteria as the 2018/2019 validation study, we tested 100 children with some degree of familial
history of dyslexia or reading difficulty and 328 without a familial history. 22.83% of parents
reported their combined income; approximately 39% of those parents reported a combined
income of less than $100K. Of the 94% of parents who reported their child’s race and ethnicity,
34.42% identified their children as non-white or multiracial. Children were tested within an
eight-week window after their first day of Kindergarten using all twelve assessments in the
App, developed at Boston Children’s Hospital (BCH) as well as Florida State University’s
(FSU) Florida Center for Reading Research. We added items to multiple screener components
that were previously validated at FSU.
The initial plan (before COVID-19 restrictions) was to retest these participants in the spring of
2020 with the following comprehensive standardized early literacy outcomes assessment
battery in order to assess predictive validity of the screener. With the onset of the COVID-19
pandemic, travel became restricted and schools were closed for in-person data collection. We
were therefore be unable to visit all of the locations in-person to collect data. Therefore, the
team quickly adapted the entire psychometric assessments to be administered virtually over
Zoom. After multiple pilot sessions, the virtual protocol was finalized in early May. The team
used a combination of the screen share feature on Zoom and Q-global, which is Pearson’s web-
based administration system, to conduct these assessments. A detailed overview about the
virtual assessment protocol can be found here: https://osf.io/wg4ef/. Children were tested either
at home or in school and a variety of technology challenges were solved, especially in children
from low-income family backgrounds.
From early May until the end of October, we were able to successfully collect follow-up data
from 219 participants. Participants were tested in 8 States (MA, NY, RI, MT, LA, MO, PA,
TX) and 19 schools. Specifically, by spring we had 419 students still attending the schools
where they were tested in the Fall. Of the 419, we were able to test 219 either in-person or
remotely, giving us a testing rate of 54%. 199 participants were not tested in this second phase
of validation due to multiple reasons:
(1) Parents of the participants were not interested in participating in a virtual testing session or
were unable to be reached by the research team. The original intent of the study was for the
© 2021 EarlyBird Education ½ Technical Manual ½ 22parents to have minimal participation in the study, as the bulk of the communication was to be
done with schools. COVID-19 complications and school closures unexpectedly altered the
study structure.
(2) Some schools were not interested in in-school virtual testing due to their increased work-
load during remote schooling periods.
For the second phase of predictive validation, 219 participants (108 female, 108 male and 3
unknown, average age 6 years 7 months) were tested with the follow-up paper-pencil
psychometric battery in spring/summer 2020. There were 48 children with some degree of
familial history of dyslexia or reading difficulty and 171 children without a familial history in
the sample. 48% of parents reported their combined income and approximately 39% of those
parents reported a combined income of less than $100k. 98% of parents reported their child’s
race and ethnicity. Of those parents, 12.3% identified their children as non-white or multiracial.
Participants were either tested in their homes virtually or in school virtually. Out of the 219
children tested this spring, 105 were tested in person. These participants were tested by a
psychometric tester in-person because they were either tested before schools were closed or
tested by a local tester who didn’t have travel/visiting restrictions at the school. All of the
participants received a detailed score report that outlined the assessments that were
administered with their respective scores. These score reports were also shared with the schools
(if parents gave us the permission). Having two data points from 219 participants, from the app
last fall and from the psychometric assessments this year, allowed for the evaluation of the
screener’s predictive validity.
Psychometric Results
Classical Test Theory Results
First Sound Matching (FSM)
The mean p-value (i.e., percent correct) for FSM items was 0.59 (SD = 0.15) with a
minimum of 0.39 and a maximum of 0.91.
NonWord Repetition (NWR)
The mean p-value (i.e., percent correct) for NWR items was 0.49 (SD = 0.22) with a
minimum of 0.08 and a maximum of 0.91.
Rhyming (RHYM)
The mean p-value (i.e., percent correct) for RHYM items was 0.67 (SD = 0.14) with a
minimum of 0.36 and a maximum of 0.89.
Word Matching (WM)
The mean p-value (i.e., percent correct) for WM items was 0.68 (SD = 0.23) with a
minimum of 0.24 and a maximum of 0.98. Eleven items presented with ceiling effects (i.e., p-
value >= .95) and were removed from the item bank.
Multiple-Group Item Response Modeling (MG-IRM)
First Sound Matching (FSM)
Model fit for the FSM unidimensional 2PL-IRM resulted in a rejection of the null
hypothesis of a correctly specified model (M2 =911.91, p0.39. The mean a value was 1.35 (SD = 0.51) with a minimum of 0.40 and a maximum of 2.46.
Marginal reliability was .87.
NonWord Repetition (NWR)
Model fit for the FSM unidimensional 2PL-IRM resulted in a rejection of the null
hypothesis of a correctly specified model (M2 =996.47, pFigure 3: ROC curve for prediction of severe phonological awareness risk
© 2021 EarlyBird Education ½ Technical Manual ½ 25Chapter 7: Technical Documentation Part III - PWR Risk Screener
Description of Calibration Sample
Data collection for the PWR Risk Screener began by testing item pools for the Screen tasks
(i.e., Letter Sounds, Phonological Awareness, Word Reading, Vocabulary Pairs, and Following
Directions). A statewide representative sample of students that roughly reflected Florida’s
demographic diversity and academic ability (N ~ 2,400) was collected on students in
Kindergarten as part of a larger K-2 validation and linking study. Because the samples used for
data collection did not strictly adhere to the state distribution of demographics (i.e., percent
limited English proficiency, Black, White, Latino, and eligible for free/reduced lunch), sample
weights according to student demographics were used to inform the item and student parameter
scores. Tables 6-7 include the population values and derived weights applied to all analyses.
Linking Design & Item Response Analytic Framework
A common-item, non-equivalent groups design was used for collecting data in our pilot,
calibration, and validation studies. A strength of this approach is that it allows for linking
multiple test forms via common items. For each task, a minimum of twenty-percent of the total
items within a form were identified as vertical linking items to create a vertical scale. These
items served a dual purpose of not only linking forms across grades to each other, but also
linking forms within grades to each other.
Because the tasks in the PWR Risk Screener were each designed for vertical equating and
scaling, we considered two primary frameworks for estimating the item parameters: 1) a
multiple-group IRT of all test forms or 2) test characteristic curve equating. We chose the latter
approach using Stocking and Lord (1983) to place the items on a common scale. All item
analyses were conducted using Mplus software (Muthen & Muthen, 2008) with a 2pl
independent items model.
Norming Studies
Data was collected on approximate 2,000 kindergarten students across multiple districts in
Florida who participated in the calibration and validation studies. Table 8 provides a
breakdown of the sample sizes used by grade level for each of the PWR adaptive tasks.
Reliability
Marginal reliability for the computer-adaptive tasks (Table 9) was quite high, ranging from .85
for Letter Names to .99 for Phonological Awareness - Blending. Values of .80 are typically
viewed as acceptable for research purposes while estimates at .90 or greater are acceptable for
clinical decision making (Nunnally & Berstein, 1994). Test-retest Reliability was estimated
for students participating in the field testing of the PWR Tasks by correlating their ability scores
across three assessments. Retest correlations for the assessments (Table 10) were the strongest
between winter and spring assessment periods. Correlations between the fall and spring tended
to be the lowest, which is expected as a weaker correlation from the beginning of the year to
the end suggests that students were differentially changing over time (i.e., lower ability students
may have grown more over time compared to higher ability students). Similarly, the low
© 2021 EarlyBird Education ½ Technical Manual ½ 26correlations from fall to winter for Word Matching likely reflects individual change across
assessments.
Validity
Predictive Validity
The predictive validity of the Screening tasks to the SAT-10 Word Reading (SESAT in K) was
addressed through a series of linear and logistic regressions. The linear regressions were run
two ways. First, a correlation analysis was used to evaluate the strength of relations between
each of the Screening task ability scores with SESAT. Pearson correlations between PWR tasks
and the SESAT Word Reading task ranged from .38 to .59 (Table 11). Second, a multiple
regression was run to estimate the total amount of variance that the linear combination of the
predictors explained in SESAT (46%).
Classification Accuracy
For the logistic regressions, students’ performance on the SESAT Word Reading test was
coded as ‘1’ for performance at or above the 40th percentile, and ‘0’ for scores below this target.
This dichotomous variable was then regressed on a combination of PWR tasks. By
dichotomizing scores on the screener as ‘1’ for not at-risk for reading difficulties and ‘0’ for
at-risk for reading difficulties, students could be classified based on their dichotomized
performances on both the PWR screening tasks and the SESAT. As such, students could be
identified as not at-risk on the combination of screening tasks and demonstrating grade level
performance on the SESAT (i.e., specificity or true-negatives), at-risk on the combination of
screening task scores and below grade level performance on the SESAT (i.e., sensitivity or
true-positives), not at-risk based on the combination of screening task scores but not at grade
level on the SESAT (i.e., false negative error), or at-risk on the combination of screening task
scores but at grade level on the SESAT (i.e., false positive error). Classification of students in
these categories allows for the evaluation of cut-points on the combination of screening tasks
(i.e., PWR probability) to determine which cut-point maximizes predictive power.
Classification accuracy for the fall/winter screener (Table 12) included area under the curve
(AUC) = .84 (95% CI = .81, .88), sensitivity = .81, specificity = .72, positive predictive power
= .67, negative predictive power = .84, and overall correct classification = .76 with a sample
base-rate of 41.8% approximating our 40th percentile normative cut-point on the SESAT.
Classification accuracy for the spring screener (Table 12) included area under the curve (AUC)
= .88 (95% CI = .86, .90), sensitivity = .81, specificity = .87, positive predictive power = .83,
negative predictive power = .86, and overall correct classification = .85 with a sample base-
rate of 41.8% approximating our 40th percentile normative cut-point on the SESAT.
Differential Test Functioning
An additional component of checking the validity of cut-points and scores on the assessments
involved testing differential accuracy of the regression equations across different demographic
groups. This procedure involved a series of logistic regressions predicting success on the
SESAT (i.e., at or above the 40th percentile). The independent variables included a variable
that represented whether students were identified as not at-risk based on the identified cut-point
on a combination score of the screening tasks, a variable that represented a selected
© 2021 EarlyBird Education ½ Technical Manual ½ 27You can also read