Earnings Call Presentation - 9M 2018 - October 2018 - Eleving
←
→
Page content transcription
If your browser does not render page correctly, please read the page content below
Earnings Call Presentation
9M 2018

                     October 2018
Disclaimer
The information contained in this presentation has been prepared by Aalto Capital GmbH, a registered corporate finance boutique located in Munich, Germany, based among others on
materials provided to us by Mogo Finance.
The information in this presentation has not been independently verified and is subject to updating, completion, revision and further amendment. The presentation does not purport to
contain all information that a prospective lender may require. While the information contained herein has been prepared in good faith, neither the Borrower nor its shareholders,
directors, officers, agents, employees, or advisors, give, has given or has authority to give, any representations or warranties (expressed or implied) as to, or in relation to, the accuracy,
reliability or completeness of the information in this presentation or any revision thereof, or of any other written or oral information made or to be made available to any interested party or
its advisors (all such information being referred to as information) and liability therefore is expressly disclaimed save by each person in respect of their own fraud. Accordingly, the
Borrower and its shareholders, directors, officers, agents, employees or advisors do not take any responsibility for, and will not accept any liability whether direct or indirect, expressed or
implied, contractual, statutory or otherwise, in respect of the accuracy or completeness of the information or for any of the opinions contained herein or for any errors, omissions or
misstatements or for any loss, how so ever arising from the use of this presentation.
Information contained in this presentation is confidential information and the property of the Borrower. It is made available strictly for the purposes referred to above. The presentation
and any further confidential information made available to any recipient must be held in complete confidence and documents containing such information may not be reproduced, used
or disclosed without the prior written consent of the Borrower. This presentation shall not be copied, published, reproduced or distributed in whole or in part at any time without the prior
written consent of the Borrower. By accepting delivery of this presentation, the recipient agrees to return it to the Borrower at the request of the Borrower.
This presentation should not be considered as the giving of investment advice by the Borrower or any of its shareholders, directors, officers, agents, employees or advisors. Each party
to whom this presentation is made available must make its own independent assessment of the Borrower after making such investigations and taking such advice as may be deemed
necessary. In particular, any estimates or projections or opinions contained herein necessarily involve significant elements of subjective judgment, analysis and assumption and each
recipient should satisfy itself in relation to such matters. Neither the issue of this presentation nor any part of its contents is to be taken as any form of commitment on the part of the
Borrower to proceed with any transaction nor is the right reserved to terminate any discussions or negotiations with any prospective lenders. In no circumstances will the Borrower be
responsible for any costs, losses or expenses incurred in connection with any appraisal or investigation of the Borrower.
This presentation does not constitute, or form part of, any offer or invitation to sell or issue, or any solicitation of any offer to subscribe for or purchase any securities in the Borrower, nor
shall it, or the fact of its distribution, form the basis of, or be relied upon in connection with, or act as any inducement to enter into, any contractor commitment what so ever with respect
to such securities. The Borrower assumes that the recipient has professional experience and is a high-net worth individual or Borrower this presentation has not been approved as any
governmental agency.
By accepting this presentation, the recipient represents and warrants that it is a person to whom this presentation may be delivered or distributed without a violation of the laws of any
relevant jurisdiction. This presentation is not to be disclosed to any other person or used for any other purpose and any other person who receives this presentation should not rely or act
upon it. Neither the Borrower nor its directors make any recommendation as to the matters set out in the presentation. Prospective lenders interested in investing in the Borrower are
recommended to seek their own independent legal, tax and/or financial investment advice from a competent financial advisor. The whole of the presentation should be read. Reliance on
this presentation for the purposes of engaging in any investment in the Borrower may expose an individual to a significant risk of losing the entire investment and may not be suitable for
all recipients.
2Presenter
Edgars Egle Maris Kreics
Chief Executive Officer Chief Financial Officer
● Edgars has been at Mogo Finance since 2015. Prior ● Has been at Mogo Finance since 2015
taking Mogo group's CEO position, Edgars held the Chief ● Maris holds a Master’s degree in Finance from BA School
Operating Officer’s position at Mogo Finance for 2 years of Business and Finance
● He has 12 years of international managerial experience ● Before joining Mogo Finance he spent 2 years in a
● Edgars has held various senior operations roles in corporate finance role working for the biggest
Evolution Gaming and Linedata (both providing industry telecommunications service company in Latvia –
award winning services) - Head of Latvia operations, Lattelecom. Before that he spent 7 years in PwC. Two of
Head of EMEA customer service, Asia-pacific pre-sales them in New York, working exclusively on one of the
● Edgars holds a Master’s degree in Management of largest (top 5 by market capitalization) S&P 500 Tech
Information Technology from Riga Technical University. company’s lead audit team, which was responsible for
managing other audit teams globally
● Maris is a CFA Charterholder and a member of ACCA
since 2011 (fellow since 2016)
3Operational highlights
Significant growth in loans issued ● Significant growth in core business with Group loans issued
in EURm increasing by approx. 75.5% equaling around EUR 93m (9M 2017:
75.5% 92.9
approx. EUR 53m), of which EUR 63m issued in mature markets1)
53.0
(9M 2017: EUR 43m)
● Consolidated number of active customers up significantly by
9M 2017 9M 2018 approx. 40.9% to over 62,000 (31 December 2017: approx. 44,000)
● Launch of operations in Albania, Belarus and Ukraine, steady
Significant growth in net loan portfolio
growth in countries launched in 2017 – Bulgaria, Romania, and
38.8%
in EURm 134.9 Moldova – with loan demand for the most part exceeding
97.2
expectations
● Operations in Armenia acquired with consolidation as of August
FY 2017 9M 2018 2018 already profitable on a monthly basis.
● Successful internal regional restructuring completed to deliver
Significant growth in active customers
future focus, business and cost efficiencies
40.9%
ca. 62,000
● Improved management efficiencies by separating car sales
ca. 44,000 management from financing activities
● Optimization of financing costs to 11.2% in Q3 2018 (6M 2018:
12.3%)
FY 2017 9M 2018
1) Mature markets are Latvia, Lithuania, Estonia and Georgia 4Geographic diversification
Lithuania Estonia
● Population: 2.8m ● Population: 1.3m
Poland ● Passenger cars: 1.2m ● Passenger cars: 0.7m Latvia
● Launch: May 2013 ● Launch: September 2013
● Population: 38.0m ● Loans issued 9M 2018: EUR 12.4m ● Loans issued 9M 2018: EUR 9.0m
● Passenger cars: 20.7m ● Net Loan Portfolio 9M 2018: EUR 22.6m ● Net Loan Portfolio 9M 2018: EUR 18.9m ● Population: 2.0m
● Launch: August 2016 ● EBITDA 9M 2018: EUR 5.3m (EUR 4.4m) ● EBITDA 9M 2018: EUR 4.1m (EUR 3.0m) ● Passenger cars: 0.7m
● Loans issued 9M 2018: EUR 2.7m ● Launch: May 2012
● Net Loan Portfolio 9M 2018: EUR 5.8m ● Loans issued 9M 2018: EUR 19.7m
● EBITDA 9M 2018: EUR -2.3m (EUR -0.9m) ● Net Loan Portfolio 9M 2018: EUR 37.4m
● EBITDA 9M 2018: EUR 6.8m (EUR 5.4m)
Moldova Belarus
● Population: 3.6m ● Population: 9.5m
● Passenger cars: 0.5m ● Passenger cars: n.a
● Launch: August 2017 ● Launch: April 2018
● Loans issued 9M 2018: EUR 4.4m ● Loans issued 9M 2018: EUR 0.8m
● Net Loan Portfolio 9M 2018: EUR 4.2m ● Net Loan Portfolio 9M 2018: EUR 0.8m
● EBITDA 9M 2018: EUR 0.1m (EUR -0.1m) ● EBITDA 9M 2018: EUR 0.2m
Romania Ukraine
● Population: 19.6m ● Population: 45.0m
● Passenger cars: 5.2m ● Passenger cars: n.a
● Launch: January 2017 ● Launch: September 2018
● Loans issued 9M 2018: EUR 6.1m ● Loans issued 9M 2018: EUR 0.0m
● Net Loan Portfolio 9M 2018: EUR 7.1m ● Net Loan Portfolio 9M 2018: EUR 0.0m
● EBITDA 9M 2018: EUR 0.1m (EUR -0.5m) ● EBITDA 9M 2018: EUR -0.1m
Albania Georgia
● Population: 2.9m ● Population: 3.7m
● Passenger cars: 356k
Bulgaria Armenia
● Passenger cars: 0.9m
● Launch: December 2017 ● Launch: June 2014
● Population: 7.1m ● Population: 2.9m
● Loans issued 9M 2018: EUR 0.7m ● Loans issued 9M 2018: EUR 18.6m
● Passenger cars: 3.2m ● Passenger cars: n.a
● Net Loan Portfolio 9M 2018: EUR 0.5m ● Net Loan Portfolio 9M 2018: EUR 20.9m
● Launch: March 2017 ● Launch: August 2017
● EBITDA 9M 2018: EUR -0.4m (EUR -0.0m) ● EBITDA 9M 2018: EUR 2.6m (EUR 2.6m)
● Loans issued 9M 2018: EUR 8.6m ● Loans issued 9M 2018: EUR 9.7m
● Net Loan Portfolio 9M 2018: EUR 8.5m ● Net Loan Portfolio 9M 2018: EUR 7.7m
● EBITDA 9M 2018: EUR -0.1m (EUR -0.3m) ● EBITDA 9M 2018: EUR 0.2m
Source: Eurostat, International Organization of Motor Vehicle Manufacturers
% of Mogo’s loans issued for 9M-2018
5
Note: Population data for 2016, passenger car data for 2016Mogo Hubs & Longo
Organizational restructuring to improve efficiency
€ Former structure
• Credit risk management
• Collaterals management
OPCOS OPCOS OPCOS OPCOS OPCOS OPCOS
OPCOS OPCOS OPCOS OPCOS OPCOS OPCOS
€ Improved management efficiency
• Focus on core competencies
• Diversification through platform
• Concentration on used car sales • Liquidity improvement
• Quality management • Reduction of main risk driver
• Client retention
• Cost savings by omitting
• Current operations in Latvia,
commissions
Estonia and Lithuania.
Operations in Georgia and
Armenia are picking up
6Financial highlights
Growth as targeted
Interest and similar income significantly increased ● Significant growth in interest income that correlates with Net
41.7 loan portfolio increase
54.4% 34.9%
35.2
● Improving EBITDA by 9.2% to EUR 16.6m (9M 2017: EUR
27.0 26.1
15.2m) on the back of strong revenue growth and solid grip
on costs while still growing portfolio and number of
operational countries
9M 2017 9M 2018 9M 2017 9M 2018 ● Optimization of financing costs to 11.2% in Q3 2018 (6M
Mogo Finance group Mature countries 2018: 12.3%)
● Stable loan portfolio quality: NPL 14.5% (35+DPD) of gross
Harmonized EBITDA improved significantly 2)
portfolio with provision coverage ratio of 88.4%
20.1 ● Cost to income ratio:
33.1%
9.2% o Slight increase to 32.4% (9M 2017: 28.1%) impacted by
16.6
new country launches and completed internal restructuring
15.2 15.1
o Improved by economies of scale in mature countries with
cost to income ratio decreasing to 22.4% (9M 2017:
9M 2017 9M 2018 9M 2017 9M 2018 28.4%)
Mogo Finance group Mature countries ● Strong capitalization ratio: Improved to 12.2% (2017: 11.8%).
1) Mature markets are Latvia, Lithuania, Estonia and Georgia 7
2) Harmonized for setup/restructuring costs for HUB employees and potential saving on interest expenses as if accounted for the period ended 30 September 2018 as a wholeFinancial highlights
Revenue EURm EBITDA EURm
41.7 20.8 20.1
38.4
35.2 16.6
29.6 15.4
19.4
6.7
1) 2) 1) 2)
2015 2016 2017 Sep.
9M Sep.
9M 2015 2016 2017 9M 9M
2018 2018
2018 2018 2018
Interest coverage ratio Cost to income ratio Capitalization ratio
47% 32.4%
2.27x 2.33x
2.19x
2)
1.80x 33%
30% 21.0%
28%
1.16x 1.36x
16% 12.2%
10.6%
-0.5%
1) 2) 1)
2015 2016 2017 9MSep. Sep.
2018 Sep. 2015 2016 2017 9M 2) 9M 2015 2016 2017 9M
Sep. 9M
Sep.
2018 2018
2018 2018 2018 2018 2018
LTM LTM
1) Including mature countries (Latvia, Lithuania, Georgia and Estonia) only 8
2) Harmonized for setup/restructuring costs for HUB employees and potential saving on interest expenses as if accounted for the period ended 30 September 2018 as a wholeDiversified loan portfolio
Net loan portfolio by country Net loan portfolio diversification
30.09.2018
2015: EUR 56.1m 2017: EUR 97.2m 30.09.2018: EUR 134.9m
3.1% 0.6% 0,4% 0%
1% 4.3%
5.3% 28%
5.7% 13% 26%
25% 6.3% 33%
14.1% 22% 42
16%
15% %
15.5%
21% 15%
17% 20% 17%
74% 16.7%
14%
28.1%
Latvia Lithuania Estonia
Mature and Start-up
profitable countries Mid-tier countries countries Georgia Mid-tier & Start-up countries
Share of recently launched countries (Romania, Bulgaria, Diversifying the risk with sustainable growth through geographical
Moldova, Poland, Albania, Belarus, Armenia and Ukraine) in expansion
portfolio increasing, as operations mature
9Non-performing loans and provisioning
Net loan portfolio quality analysis NPL (35+ DPD) & impairments
30.09.2018 from gross loan portfolio 1)
9%
6% 16%
14%
Current
12%
1-10 days overdue 10%
9% 8%
11-30 days overdue 6%
4%
31-34 days overdue 2%
0%
76% 35+ days overdue (NPL)
2016 2016 2016 2016 2017 2017 2017 2017 2018 2018 2018
Q1 Q2 Q3 Q4 Q1 Q2 Q3 Q4 Q1 Q2 Q3
35+ DPD from total, % Impairments / Gross Portfolio
● Conservative internal NPL definition ● NPL ratios in line with targeted ratios
● Performing loan portfolio “current” and “1-10 days overdue” ● Profit maximizing strategy for mature countries with
is equal to 85% improved scorecards
● Prudent impairment policy, with effective impairment rate of ● Start-up countries and mid-tear countries in process of
9% from gross loan portfolio scoring model improvements for profit maximization
● Provision coverage (total provisions/gross NPL) ratio 88%
● IFRS 9 full adoption and full provisions taken into account
1) Gross loan portfolio = Net loan portfolio + Provisions 10Assets & Liabilities
Assets, EURm Liabilities, EURm
158.6
8.3
112.5
71.0 Net interest
62.0 bearing
54.1 Non-related parties
77.5 liabilities
EUR 133.4m P2P
Bonds
2015 2016 2017 9M 2018
2015 2016 2017 9M 2018
Cap ratio -1% 20% 12% 12% Average cost of borrowing
13.00% 13.00% 13.00%
● 90% of assets consists of net loan portfolio and cash
● Simple and clear structured balance sheet 11.21%
10.58%
● Reducing funding costs
9.95%
● Improving capitalisation
2016 2017 6M 2018 9M 2018 FY 2018
Bond issuance of EUR 50m Scenario: Tap issuance of EUR 25m
Scenario: Tap issuance of EUR 50m
11Strategy
Controlling
● New HUBs will be created,
retaining ‘hands on’
approach ● HUB structures
● Flexibility and speed of Sustainable
● Establishing Longo
execution ● Clear focus on core profitable
● New countries will either by business growth
added to existing HUB or
new HUBs created
Short-term strategy
Mid-term strategy
12Summary
● Strong growth of assets with good asset quality
● Solid financial performance - especially in mature countries
● Bonds to replace more expensive P2P funding
● Everything is set-up for profitable and controlled growth
● Sustainable business model
13Appendix
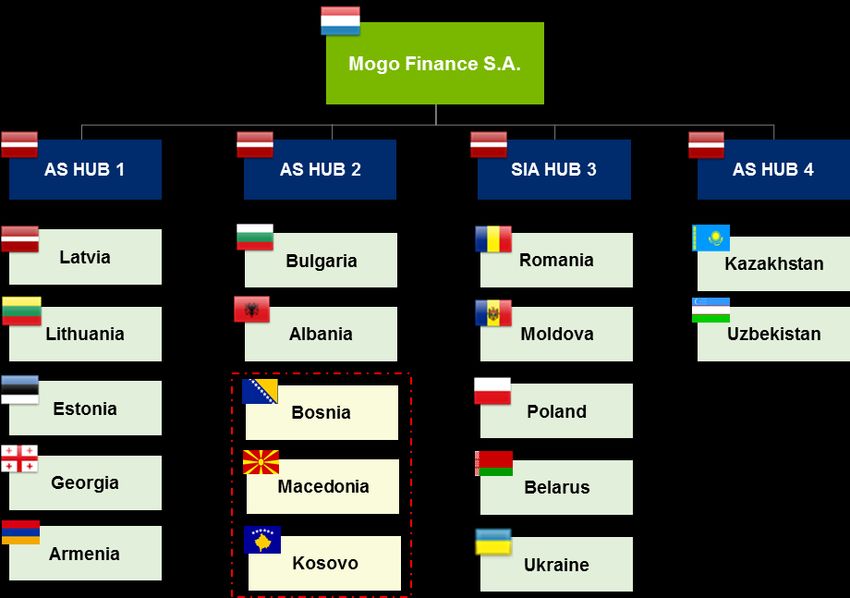
14Legal (operational) structure
Management, current
Founders
and former employees
95% 5%
Mogo Finance S.A.
AS HUB 1 AS HUB 2 SIA HUB 3 AS HUB 4 AS Longo Group
Mogo AS Mogo Bulgaria EOOD MOGO Loans SRL TOO Mogo Longo Netherlands
Kazakhstan B.V
Mogo UAB LT Mogo Albania SHA MOGO Kredit LLC OOO Mogo Lend Longo Georgia LLC
Mogo OÜ Mogo d.o.o. Sarajevo 1) MOGO Ukraine LLC Longo Estonia OU
Mogo LLC Mogo DOOEL Skopje 1) Mogo S,p. z.o.o. Longo LLC
Mogo UCO LLC Mogo sh.p.k 1) Mogo IFN SA UAB Longo LT
Risk Management
Services OU AS Longo Latvia
AS Loango
15
1) Not yet a part of the consolidated groupBalance sheet
Assets, EURm 2015 2016 2017 9M 2018 Equity & Liabilities, EURm 2015 2016 2017 9M 2018
ASSETS EQUITY
Intangible assets 0.7 1.1 1.2 3.2 Share capital 1) 0.0 0.0 0.0 0.1
Property plant and equipment 0.6 0.5 0.4 0.9 Share premium 2.0 10.0 0.0 0.0
Finance lease receivables 35.0 42.3 63.9 88.5 Reserves 0.0 0.0 0.1 0.0
Instalment loan portfolio (long term) 0.0 0.0 0.7 1.3 Foreign currency translation
0.0 (0.5) (0.5) (0.4)
reserve
Deferred tax 0.5 0.2 0.2 0.8
Retained earnings (2.4) 3.0 11.5 13.8
Other non-current assets 1.5 1.9 2.0 4.7
Non-controlling interest 0.0 0.2 0.4 0.4
Total non-current assets 38.3 45.7 68.5 99.4
Subordinated borrowings 0.0 0.0 0.0 2.5
Cars for resale 0.0 0.0 0.8 1.9 TOTAL EQUITY (0.4) 13.2 11.5 16.4
Finance lease receivables 21.2 21.5 32.1 43.8 LIABILITIES
Instalment loan portfolio (short Non current borrowings 59.0 51.9 70.8 121.3
0.0 0.0 0.5 1.3
term)
Total non-current liabilities 59.0 51.9 70.9 121.3
Repossessed vehicles 0.0 1.1 2.2 1.5
Current borrowings 1.7 3.4 25.8 16.3
Other receivables 1.7 0.5 3.1 4.2 Other liabilities 1.6 2.6 4.2 4.6
Cash and cash equivalents 0.7 2.2 5.2 6.5 Total current liabilities 3.4 6.0 30.0 20.9
Total current assets 23.7 25.4 44.0 59.2 TOTAL LIABILITIES 62,4 57.9 100.9 142.2
TOTAL ASSETS 62.0 71.0 112.5 158.6 TOTAL EQUITY + LIABILITIES 62.0 71.0 112.5 158.6
16
1) Share capital in 2016 & 2017 of EUR 31,036Income statement
Group financials, EURm 2015 2016 2017 9M 2018 9M 2017
Interest and similar income 19.4 29.6 38.4 41.7 27.0
Interest expense and similar expenses (5.8) (7.2) (9.4) (12.5) (6.5)
Net interest income 13.6 22.4 29.0 29.2 20.5
Impairment expense (3.6) (4.2) (6.9) (13.3) (5.1)
Loss arising from cession of financial lease receivables (0.0) (0.4) (0.2) 0.0 0.0
Selling expense (1.8) (1.3) (1.4) (1.5) (0.8)
Administrative expense (7.4) (8.6) (9.3) (12.1) (6.8)
Other operating income 0.1 0.1 0.2 3.8 0.3
Other operative expenses (0.4) (0.4) (0.6) (3.7) (0.3)
Other interest receivable and similar income 0.0 0.0 0.1 0.0 0.0
Other interest receivable and similar expenses (1.0) (0.8) (0.9) 0.0 0.0
Profit before taxes (0.4) 6.6 10.0 2.4 7.8
Corporate income tax (0.4) (1.0) (1.0) 0.6 (0.4)
Deferred corporate income tax 0.2 (0.3) (0.0) (0.6) 0.0
Net profit for the year (0.6) 5.6 9.0 2.4 7.4
Other comprehensive income 0.1 (0.0) (0.5) 0.1 0.0
Total comprehensive income for the year (0.5) 5.6 8.5 2.5 7.4
1)
(Adjusted) net profit (0.5) 5.6 8.5 6.2 7.4
17
1) Harmonized for setup/restructuring costs for HUB employees and potential saving on interest expenses as if accounted for the period ended 30 September 2018 as a wholeStatement of Cash Flow
9M 9M 9M 9M
EURm 2015 2016 2017 EURm 2015 2016 2017
2018 2017 2018 2017
Cash flows to/from operating Cash flows to/from investing
activities activities
Profit before tax (0.4) 6.8 10.0 2.4 7.8 Purchase of property, plant and
(1.1) (1.2) (0.7) (1.5) (0.4)
equipment and intangible assets
Adjustments for:
Loan repayments received 0.0 0.0 0.1 0.3 0.2
Amortisation and depreciation 0.3 0.6 0.6 0.6 0.5
Loans issued 0.0 (0.0) (0.6) (4.4) (0.4)
Interest expense 5.7 6.9 8.5 13.8 5.4
Interest received 0.0 0.0 0.0 0.2 0.0
Interest income (0.0) (0.0) 0.0 (0.2) 0 Net cash flows to/from investing
(1.1) (1.2) (1.3) (5.4) (0.6)
Loss/(gain) on disposal of property, activities
(0.1) 0.4 0.0 0.0 (0.1)
plant and equipment
Impairment expense 3.6 0.4 6.9 13.3 5.1 Cash flows to/from financing
(Gain)/loss from fluctuations of activities
0.8 (0.8) (0.9) (0.0) (0.2) Proceeds from issue/(repayment) of
currency exchange rates 2.0 0.0 (10.0) 0.0 (5.9)
share premium
Increase in accrued liabilities 0.1 0.5 0.9 0.0 0.0
Proceeds from borrowings 26.4 3.1 41.2 45.5 21.1
Operating profit before working
10.1 14.9 25.9 29.9 18.5 Payments for borrowings acquisition
capital changes (4.9) (0.2) (0.4) (6.0) (0.1)
costs
Increase in inventories 0.1 (0.0) (0.8) (1.1) (0.2)
Interest paid (5.7) (7.2) (7.8) (9.8) (5.1)
Increase in receivables (25.8) (6.9) (43.6) (51.3) (25.7)
Securities repurchased (2.8) 0.0 0.0 0.0 0.0
Increase/(decrease) in payables 0.9 (0.2) 0.4 0.6 (0.3)
Net cash flows to/from financing
14.7 (4.4) 23.0 29.7 10.0
Cash generated to/from operations (14.8) 7.8 (18.1) (21.9) (7.7) activities
Corporate income tax paid (0.8) (0.4) (0.8) (1.1) (0.6) Effect of exchange rates on cash and
0.1 (0.3) 0.1 0.0 0.0
Net cash flows to/from operating cash equivalents
(15.6) 7.3 (18.8) (23.0) (8.3)
activities Change in cash (1.7) 1.5 3.0 1.3 1.1
Cash at the beginning of the year 2.4 0.8 2.2 5.2 2.2
Cash at the end of the year 0.8 2.2 5.2 6.5 3.3
18Thank you for your attention! Mogo Finance Group Contact person Skanstes street 50 Māris Kreics, Group CFO LV-1013 Riga, Latvia Phone: +371 66 900 900 Home page: www.mogofinance.com E-mail: maris.kreics@mogofinance.com Investor Relations Contact person Aalto Capital Group Manfred Steinbeisser, Managing Partner Bahnhofstr. 98 Sven Pauly, Consultant D-82166 Graefelfing / Munich, Germany Phone: +49 89 89 86 777 0 Home page: www.aaltocapital.com E-mail: manfred.steinbeisser@aaltocapital.com
You can also read