Earthquakes Reconnaissance Data Sources, a Literature Review
←
→
Page content transcription
If your browser does not render page correctly, please read the page content below
Preprints (www.preprints.org) | NOT PEER-REVIEWED | Posted: 29 June 2021                           doi:10.20944/preprints202106.0714.v1

     Review

     Earthquakes Reconnaissance Data Sources, a Literature Review
     Diana Maria Contreras Mojica 1, Sean Wilkinson2 and Philip James3

                                    1   Newcastle University; diana.contreras-mojica@newcastle.ac.uk
                                    2   Newcastle University; sean.wilkinson@newcastle.ac.uk
                                    3   Newcastle University; philip.james@ncl.ac.uk

                                    * Correspondence: diana.contreras-mojica@newcastle.ac.uk; Tel.: (+44 47552064262)

                                    Abstract: Earthquakes are one of the most catastrophic natural phenomena. After an earthquake,
                                    earthquake reconnaissance enables effective recovery by collecting building damage data and other
                                    impacts. This paper aims to identify state-of-the-art data sources for building damage assessment
                                    and guide more efficient data. This paper reviews 38 articles that indicate the sources used by dif-
                                    ferent authors to collect data related to damages and post-disaster recovery progress after earth-
                                    quakes between 2014 and 2021. The current data collection methods have been grouped into seven
                                    categories: fieldwork or ground surveys, omnidirectional imagery (OD), terrestrial laser scanning
                                    (TLS), remote sensing (RS), crowdsourcing platforms, social media (SM) and closed-circuit televi-
                                    sion videos (CCTV). The selection of a particular data source or collection technique for earthquake
                                    reconnaissance includes different criteria. Nowadays, reconnaissance mission can not rely on a sin-
                                    gle data source, and different data sources should complement each other, validate collected data,
                                    or quantify the damage comprehensively. The recent increase in the number of crowdsourcing and
                                    SM platforms as a source of data for earthquake reconnaissance is a clear indication of the tendency
                                    of data sources in the future.

                                    Keywords: Earthquake reconnaissance; fieldwork surveys; closed-circuit television videos (CCTV);
                                    remote sensing (RS), crowdsourcing platforms and Social Media (SM).

                                    1. Introduction

                                         Each year, disasters cause significant human and economic losses. Out of these dis-
                                    asters, earthquakes are one of the most catastrophic natural phenomena. These events
                                    have caused more than 23 million deaths between 1902-2011 [1] and substantial physical,
                                    social, economic [2] and occasionally institutional, cultural and environmental losses. Fol-
                                    lowing an earthquake, there is a substantial demand and need for spatial information [3,
                                    4] about population location [5], evacuation routes, availability of resources [6], size of the
                                    affected area and distribution of damage. Later, during the emergency phase, it is neces-
                                    sary to collect more detailed data about damages in the structural components of build-
                                    ings [7].

                                          Earthquake reconnaissance enables collecting perishable data on building perfor-
                                    mance to prepare statistics, calibrate and validate engineering models, and identify the
                                    construction deficiencies that lead to inadequate structural performance. This paper aims
                                    to identify state-of-the-art data sources for building damage assessment and serve as a
                                    guide to make more efficient data collection based on the experiences in the last years.
                                    Damage is understood as a change in the mechanical, material and/or geometric proper-
                                    ties of a building, affecting its performance and behaviour [8]. Damage data is highly ‘per-
                                    ishable’ or ephemeral since damaged structures may be altered or removed during rescue
                                    or early recovery [9] activities [10] or modified by aftershocks. A large earthquake

            © 2021 by the author(s). Distributed under a Creative Commons CC BY license.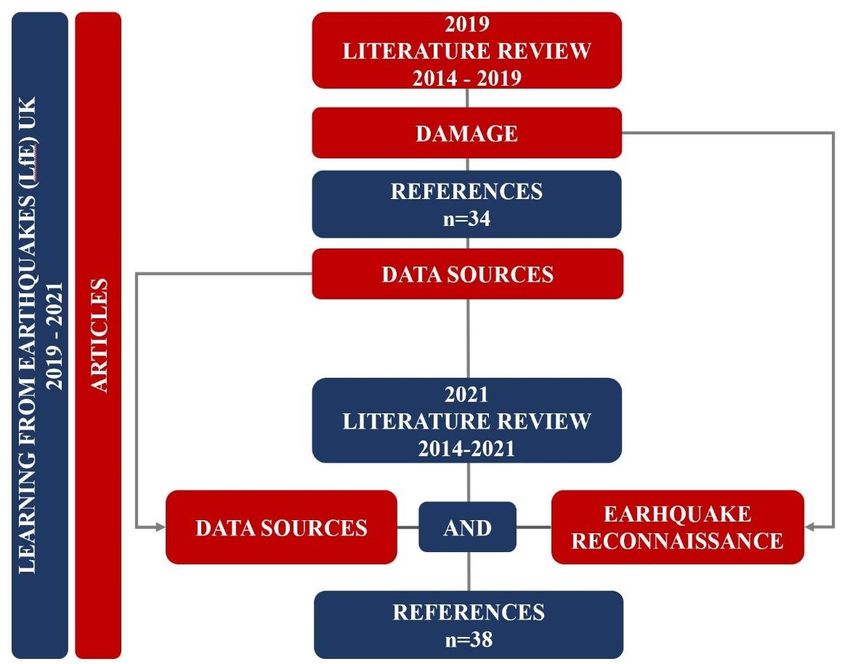
Preprints (www.preprints.org) | NOT PEER-REVIEWED | Posted: 29 June 2021                 doi:10.20944/preprints202106.0714.v1

                                 produces extensive building damage and affects the operational conditions of other struc-
                                 tures [11] in and around an urban area [12]. Additionally, economic and social conse-
                                 quences are usually related to loss of buildings usability [13, 14]. Buildings are essential
                                 places to live [15], to do business or to carry out activities [16]; this is the reason why most
                                 of the losses [1] and 75% of the casualties [17] in disasters are due to building damage [1].
                                 Building damage assessment is a critical activity to secure the safety of the public [7] and
                                 provide information for disaster relief, early recovery planning [12] and later reconstruc-
                                 tion [18-20], especially due to the threat of aftershocks. Moreover, damage assessment is
                                 essential for assessing disasters' social and economic impact [19, 21]. The effectiveness of
                                 post-disaster activities during the response and recovery phases depends on accurate and
                                 early damage estimation[22].

                                       In the past, conventional recording and measurement tools, such as photography,
                                 note-taking and surveying, were used by reconnaissance investigators to collect data and
                                 document field observations. Nowadays, the availability of state-of-the-art instrumenta-
                                 tion, mobile data collection technologies, training and field support services has increased
                                 the ability of field investigation teams to capture perishable data during post-disaster
                                 phases [10]. Currently, there are two data sources in the disaster management cycle: sen-
                                 sor-generated such as the data collected by remotes sensing (RS) tools, CCTV or satellites
                                 and user-generated content collected from social media (SM) platforms [23, 24]. Quantita-
                                 tive assessment of damage is the process of determining the physical damage of the ex-
                                 posed elements in the affected area. The result of the damage assessment will be the ag-
                                 gregate quantities of damages for an exposure unit. This quantitative assessment is used
                                 to assess the direct economic loss as the basis for calculating the value of economic losses:
                                 the replacement cost [19] or insurance payouts of value to international aid organisation,
                                 bi-lateral/multilateral donors and the insurance industry [25]. During the emergency or
                                 relief phase, the quantitative assessment of damage starts with the structural component
                                 of the buildings due to its essential role in the safety of the population affected by earth-
                                 quakes and the estimation of temporary shelter needed [9]. Structural damage evaluation
                                 implies a visual inspection to establish whether the building structure components are
                                 damaged, which of them, and degree and if the degree of damage represents a risk for the
                                 building’s occupants. These data are necessary for understanding the trend of natural dis-
                                 aster impacts and existing planning and building practices [26]. Earthquake reconnais-
                                 sance enables collecting perishable data on building performance to prepare statistics, cal-
                                 ibrate and validate engineering models, and identify the construction deficiencies that
                                 lead to inadequate structural performance [27]. Damage detection and characterization
                                 involve five closely related subjects [11], i.e., structural health monitoring (SHM), condi-
                                 tion monitoring (CM), non-destructive evaluation (NDE), statistical process control (SPC)
                                 and damage prognosis (DP)[8].

                                      This paper is divided into five sections. The introduction includes a brief background
                                 on the topic of earthquake reconnaissance and data sources over time. The second section,
                                 on methods, elaborates on the criteria for selecting the articles that comprise the literature
                                 review. The third section focuses on the results, including the data sources identified
                                 through the literature review. The fourth section focuses on discussing the interaction of
                                 data sources identified, and the fifth section contains the conclusions.

                                 2. Materials and Methods
                                      A literature review was conducted to identify state-of-the-art data sources for earth-
                                 quake reconnaissance. Peer-reviewed research articles included in this literature review
                                 were identified from the Web of Science and in the framework of the project: Learning
                                 from Earthquakes (LfE) UK, a joint project undertaken by Newcastle University, the Uni-
                                 versity College of London (UCL) and Cambridge University. Considering that we are
Preprints (www.preprints.org) | NOT PEER-REVIEWED | Posted: 29 June 2021 doi:10.20944/preprints202106.0714.v1
interested in state-of-the-art, we focused on publications made in the last five years. The
search was conducted between February 2019 and June 2021. In the literature review un-
dertaken at the beginning of the project, we reviewed references published between 2014
and 2019. At the end of the project, we reviewed references published between 2016 to
2021. Eventually, this literature review included references published between 2014 and
2021, the last seven years. According to their relevance, older references were reviewed
only when referred by the authors of identified references. Still, they are not counted
among the total number of reference reviewed because we want to highlight only state-
of-the-art data sources. Although the main focus was data sources for earthquake recon-
naissance, data sources for damages assessment after other natural phenomena or anthro-
pogenic events were reviewed but not counted in the review. The flow diagram of the
methodology applied is depicted in Figure 1.
Figure 1. Methodology.
3. Results
This paper reviews more than 38 articles that indicate the sources used by different
authors to collect data related to damages and post-disaster recovery progress after earth-
quakes between 2014 and 2021. The data collection sources and methods identified in our
literature review have been grouped into seven categories: fieldwork or ground surveys,
omnidirectional imagery (OD), terrestrial laser scanning (TLS), remote sensing (RS),
crowdsourcing platforms, social media (SM) and closed-circuit television videos (CCTV).
In the case of RS, we identified six sources: satellite images, unmanned aerial vehicles
(UAVs) and small unmanned aerial vehicles (sUAV), light detection and ranging (LiDAR),
high-resolution synthetic aperture radar (SAR), interferometric synthetic-aperture radar
(InSAR), real aperture radar (RAR). We identified seven crowdsourcing platforms: did
you feel it (DYFI), Earthquake network, LastQuake, MyShake, Raspberry Shake, Quick-
Deform and TSER System. We identified three SM platforms as data sources for earth-
quake reconnaissance: Earthquake network, Facebook and Twitter. The summary of the
references reviewed is listed in Table 2.Preprints (www.preprints.org) | NOT PEER-REVIEWED | Posted: 29 June 2021 doi:10.20944/preprints202106.0714.v1
Table 2. Summary of references reviewed for this literature review.
Data sources References
Fieldwork or ground surveys [28], [29], [30], [10], [31], [22], [32], [33], [34]
Omnidirectional imagery (OD) [35]
Terrestrial laser scanning (TLS) [36]
Satellite images [37], [19]
UAVs & sUAV [22], [38], [39]
LiDAR [26]
Remote sensing (RS)
SAR [12], [40]
InSAR [41], [42], [43], [44]
RAR [8]
DYFI [45]
Earthquake network [46]
LastQuake [47]
Crowdsourcing platforms MyShake [48]
Raspberry Shake [49]
QuickDeform [50]
TSER System [51]
Earthquake network [46]
Social media (SM) platforms Facebook [52]
Twitter [53], [54],[55]
Closed-circuit television videos (CCTV) [56], [57]
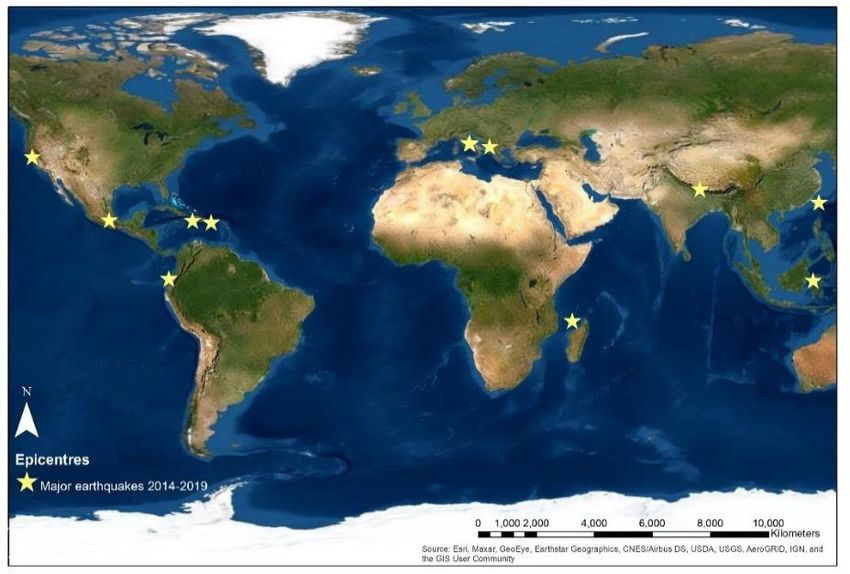
Missions deployed, or missions that have had their results published during the pe-
riod covered by this literature review are Albania [47, 58], Puerto Rico [45, 46], Mayotte
[52], Mexico [28-30], Palu – North Sulawesi (Indonesia) [53, 56, 59], Hualien (China) [51],
Central Italy [32, 33, 35, 60], Muisne (Ecuador) [35], Nepal [1, 40, 49], and Napa - California
(USA) [54, 55], Haiti [12] and L’Aquila (Italy) [14, 37]. The location of major earthquakes
epicentres from 2014 – 2019 included as case studies in this literature review is depicted
in Figure 3.
Figure 3. Spatial distribution of epicentres of major earthquakes occurred from 2014 – 2019.
3.1. Fieldwork or ground surveysPreprints (www.preprints.org) | NOT PEER-REVIEWED | Posted: 29 June 2021 doi:10.20944/preprints202106.0714.v1
Post-disaster structural damage assessment is typically based on ground surveying
methods [22]. The objective of these missions is to learn about the performance of infra-
structure and structures under seismic loading, collecting accurate damage data [35] for
further research [29], and scientific understanding of their physical, socio-economic, envi-
ronmental [10], cultural and institutional consequences. In-situ structural observations
sometimes include records not limited to the mechanism of structural failure and obser-
vations of undamaged structures and the extend and scale of damage to structures at a
global and component level [35]. To develop a detailed building damage map, it is neces-
sary to identify the damage for building-by-building [12, 53] after an earthquake or hur-
ricanes; most building damage assessment relied on a foot-on-ground approach [61]. This
detailed inspection is the most reliable [22] and generates invaluable information on the
seismic performance of the affected building stock [31]. However, the limited period that
the mission is deployed and the street level constraints on the extent of observations make
it less reliable at collating damage statistics, which are particularly important for validat-
ing and developing fragility and vulnerability functions [35].
Fieldwork or ground surveys are a traditional approach to estimate the spatial dis-
tribution of earthquake impacts to building clusters, performed by volunteer groups con-
sisting of structural engineers, architects, researchers with experience in building instru-
mentation, geotechnical and seismologist specialist [29] and undergraduate students of
these fields. These missions collect structural, geotechnical, seismological and damage in-
formation[29]. Earthquake reconnaissance missions are undertaken by national or inter-
national organisations such as the Earthquake Engineering Field Investigation
Team (EEFIT) [10, 27, 35, 58, 62, 63], the Geotechnical Extreme Events Reconnaissance As-
sociation (GEER)[10, 27, 32, 33, 62, 64], and Earthquake Engineering Research Institute
(EERI) [10, 32, 35]. In Italy, the European Centre for Training and Research in Earthquake
Engineering (EUCENTRE) and the Italian Network of University Laboratories for Earth-
quake Engineering (ReLUIS) have organized earthquake reconnaissance missions and
conducted follow-on seismic policy analyses. For six decades, the New Zealand Society
for Earthquake Engineering (NZSEE) has supported reconnaissance research of earth-
quakes and major tsunamis in the world [10]. The Asian Technical Committee (ATC3)
‘Geotechnology for natural hazards’, the Building Research Institute of Japan and the
Nepalese Engineering Society has conducted reconnaissance missions in Asia after natu-
ral phenomena. Another organization that have supported reconnaissance missions in the
United States (US) is the American Society of Civil Engineers (ASCE). Additionally, some-
times, self-organized teams with a focused-hypothesis driven research question or inquiry
are formed to collect data [10]. In the 2017 Puebla-Morelos earthquake case, also known
as the 2017 Puebla earthquake or the 2017 Mexico earthquake, the Applied Technology
Council (ATC) deployed a team to Mexico city sponsored by the ATC Endowment Fund.
This team was joined by practising architects, engineers, professors and local agencies
[29]. The NZSEE, in collaboration with the Universidad Autonoma de Metropolitana
(UAM) Azcapotzalco, the American Concrete Institute (ACI) Disaster Reconnaissance
team, and the Colegio de Ingenieros Civiles de Mexico (CICM) also deployed a team for
the same earthquake in Mexico [30] and the team of the Stanford’s John A. Blume Earth-
quake Engineering Centre as well [28].
In a foot-on-ground survey, the assessment is conducted manually [34], one building
after another [26], each reconnaissance mission takes one week. However, the ATC’s re-
connaissance mission after the 2017 Puebla-Morelos earthquake lasted three days[29]. To
maximize the area to inspect, three teams from three to four structural engineers were
deployed each day in this specific mission. Each team involved at least one Spanish
speaker to interact with residents and one local structural engineer [29]. Usually, there is
a preliminary data collection before going into fieldwork [32]. Traditionally paper forms
were utilised, but nowadays, smartphones are used as tools to complete investigation
forms and collect multi-media data (e.g. photos, audios and videos) [34]. One examplePreprints (www.preprints.org) | NOT PEER-REVIEWED | Posted: 29 June 2021 doi:10.20944/preprints202106.0714.v1
was the damage assessment app used by the EEFIT mission team deployed to Albania to
collect damage data after the earthquake in 2019 [58]. The EERI, through its program
Learning from Earthquakes (LFE) was the first professional organization to organize re-
connaissance missions to significant seismic events. This organization recently has formed
a virtual earthquake reconnaissance teams (VERT) to conduct ‘virtual’ (i.e., not on-site)
assessment within 48 hours after an earthquake[10]. The Applied Technology Council re-
connaissance mission for the 2017 Puebla-Morelos earthquake focused not only on build-
ings with significant but also minimal damage. No inspections were undertaken on col-
lapsed buildings, considering that those buildings do not have suggestive evidence of
where or why the failures occurred[29]. This ATC’s reconnaissance mission collected
damage and geotechnical data, earthquake ground motions from several suites and am-
bient vibration recordings from buildings instrumented by the team during the reconnais-
sance trip [29]. This ATC mission instrumented seven of the inspected buildings with an
array of accelerometers [29]. The NZSEE and UAM team focused on extensive and wide-
spread damage where local site effect could have contributed to the significant damage in
buildings. At the same time, that evaluated the performance of the repaired and retrofitted
buildings after the 1985 Michoacan earthquake [30]. Stanford’s John A. Blume Earthquake
Engineering Centre surveyed the affected area in Mexico from the 29 th to the 24th Septem-
ber. It complemented the database of collapsed buildings with data collected from news-
papers and SM until the 1st November 2017 [28].
The GEER deployed two teams in Central Italy. The first team integrated entirely by
Italians located potential landslides sites of interest. Later, a second team was deployed to
collect data in the identified places by the first team [32]. Manual inspection and docu-
mentation of landslides were done by the GEER team in central Italy using standard ge-
ologist’s tools: scale, measuring tape, clinometer, compass, rock hammers and total sta-
tion. Key landslide dimensions were measured on each manually inspected point, i.e.,
length, wide, scarp heigh, and slope inclination [32]. Notes were taken about the slide
mass or rockfall constituent materials, local geology, observed groundwater and seepage
conditions, and anthropogenic activity in the area. The width and height of the rockfall
source were measured using total stations, while slope inclination below the rock source
was either estimated or measured [32]. The geologic hammer was utilized to infer the rock
strength. Stratification, weathering, spacing, joint width and infill material were evalu-
ated. Distances were estimated for most of the rock falls, given that lateral and vertical
distances of the rollout were too large to measure manually. Boulder fragments were in-
spected with measurements of boulder size [32]. Parallel to the GEER mission and with
its support during the planning phase and the support of the Italian Department of Civil
Protection (DPC by its acronym in Italian), EERI, EUCENTRE, and ReLuis also deployed
a mission in Central Italy to study the effects of the earthquake sequence not only on the
built environment but also on the communities located in the affected areas. Another ob-
jective was to assess the retrofitting methodologies and evaluate their effectiveness in mit-
igating the damaging effects of ground shaking [33]. These three organizations also de-
ployed two missions. The first mission was deployed following the 2016 Amatrice earth-
quake and the second mission after the earthquake sequence in 2017 when it was consid-
ered safe to enter the restricted zones [33]. The mission teams were formed by engineers
with expertise in lifelines and structures focused on bridges and buildings. Besides engi-
neering aspects, the mission collected data related to emergency management and the
performance of critical infrastructures (CI) such as hospital and schools [33].
3.2. Omnidirectional imagery (OD)
The outcomes of the fieldwork or ground surveys can be improved by the unique
viewpoints and perspectives delivered by the OD camera technology. Employing OD
cameras is possible to collect chains of omnidirectional images. The development of onlinePreprints (www.preprints.org) | NOT PEER-REVIEWED | Posted: 29 June 2021 doi:10.20944/preprints202106.0714.v1
platforms to host the collected images makes it possible that those photo chains can be
easily visualized to simulate an immersive ‘walk through’ of a landscape with 360 de-
grees, ideal for comprehensive damage inspections in reduced access zones [35].
Previous studies have reported an acceptable level of accuracy of virtual surveys
compared to street ones [35, 65, 66]. Chains of OD images could be utilized to increase
sample sizes by improving statistical structural damage data, allowing robust sampling
techniques to be used across an area impacted by an earthquake [35]. EEFIT tested this
data source in two different post-earthquake contexts: the 2016 Muisne earthquake in Ec-
uador and 2016 Central Italy. In both cases, the same camera equipment was used: a Ricoh
Theta S. The imagery was visualized employing the Mapillary platform to assess construc-
tion typologies, number of stories and degree of damage [35]. The context of the two
EEFIT missions is different in the scale of the damage, the buildings affected, the urban
context, the local topography, and the earthquake's characteristics.
In the 2016 Muisne earthquake in Ecuador, damage data collected through a series
of rapid visual surveys (RVS) conducted in the field was compared to the data collected
virtually along the same routes using chains of OD images. This mission validated the
utilization of OD imagery with RVS data to compare virtual surveys later using OD im-
agery to the damage data extracted from satellite imagery [35]. In 2016 Central Italy, the
work was focused on testing OD imagery's ability, collected during the walk-through, to
provide a better understanding of damage regarding the damage maps provided by the
European Copernicus Emergency Management Service. These maps were delineated
based on the timely geospatial information derived from RS and completed with available
open data sources in situ for emergency response. [35].
This technology shows significant capabilities in identifying aggregated ‘low’ and
‘high’ damage grades, failure modes, number of stories and construction typologies.
There are some potential issues with the proper identification of disaggregated lower
damage (e.g.Damage grades 0-3 according to the European Macroseismic Scale-98)[35].
The comparison of RVS and OD based post-earthquake survey data identified challenges
to overcome. Those challenges are poor image quality, insufficient photosphere captures
related to the extent of its overlap, lack of photos close enough to each other, and obstruc-
tions such as trees, walls, or vehicles [35]. More advanced cameras could improve the
quality of the image, and the gaps between pictures can be solved by reducing the distance
between images (between 6 and 12 m), especially on obstructed streets (e.g. tree-lined).
Moreover, uncertainties related to the validity of the information inferred using this
method and the challenges associated with collecting detailed data still need to be ad-
dressed.
3.3. Terrestrial laser scanning (TLS)
Detailed structural surveys and landslide can be done to obtain high-resolution dig-
ital elevation models (DEM) using terrestrial laser scanning (TLS)[10]. This method man-
aged to capture the entire geometry of the Baptistery of San Giovanni in Florence, Italy,
with the level of detail required to identify and measure cracks, settlement, displacement,
missing mosaic tiles and other types of damages [36]. This data collection method uses a
scanner that reflects a laser off of a rotating mirror to acquire a sphere of measurements
from one central point of view. TLS uses a time of flight measurement technique that cal-
culates distance based on the time it takes for the laser to return from a surface or a phase
shift method that compares the emitted and received phases of the laser [36, 67]. TLS pro-
vides accurate 3D geometry with millimetre [68] and range, reducing the effort involved
in measuring and post-processing [69]. The laser scanner integrates GPS and correlates
individual scans in post-processing, making it suitable for surveying based. Another tech-
nique for detailed survey is structure from Motion (SfM); this photogrammetric technique
uses two-dimensional images taken from multiple viewpoints to compute a 3DPreprints (www.preprints.org) | NOT PEER-REVIEWED | Posted: 29 June 2021 doi:10.20944/preprints202106.0714.v1
representation of the scene being surveyed. Both TLS and SfM are line-of-sight (LOS) tech-
niques, which means that the device only records measurements from the first surface it
sees and nothing beyond that. In case of 3D environments, multiple imaging positions are
therefore required to perform a complete digital 3D representation [36].
3.4. Remote sensing (RS)
The building-by-building inspection may not be possible in areas with significantly
damaged structures. Therefore is necessary to consider alternative contactless, non-inva-
sive RS techniques and means to safely inspect and report about the operative conditions
and structural health and of affected buildings[11]. The use of imaging technology has
been increasing rapidly as data gathering, and enriching tool boosting mission capabilities
and ensure their safe deployment in areas affected by earthquakes [35]. For about the last
decade, high-resolution optical satellite and aerial images have been increasingly used for
a rapid building-damage survey after an earthquake [25]; they have become an important
tool for rapid and reliable structural damage assessment (SDA) [22]. We identified in our
literature review six RS data sources used for earthquake reconnaissance. Those sources
are satellite images, unmanned aerial vehicles (UAVs), small unmanned aerial vehicles
(sUAV), light detection and ranging (LiDAR), high-resolution synthetic aperture radar
(SAR), interferometric synthetic-aperture radar (InSAR). The RS data sources are orga-
nized below according to the complexity to extract and process the data collected.
3.4.1. Satellite images
Aerial photography was the source of damage data to estimate the size of the impact
area quickly, before the availability of very high resolution (VHR) satellite images. The
spatial extent of building damage after earthquakes can be detected by combining pre and
post-disaster very high-spatial-resolution (VHR) satellite images such as Quickbird[37].
Images are compared for change detection (CD)[38] using approaches such as Pixel or
object-based image analysis (OBIA), visual or manual interpretation with the support of
GIS software [19, 37]. Damages in buildings are detected according to changes detected in
relational (borders), spectral (ratio, mean, GLCM texture, brightness) and spatial (com-
pactness, volume, shape) features [37]. Very high-resolution satellite images can also be
used to reference historical data compared with VHR images acquired by UAVs for
CD[38]. Satellite imagery accurately captures the higher damage levels, but it is coarser in
capturing lower damage degrees due to technical limitations of the distance and the at-
mospheric conditions when an image is captured and the satellite optical radius, affecting
levels of the output accuracy. Then in the case of building damage assessment, further
data is required given that the level of detail provided by satellite images is not satisfac-
tory [35]. Satellite images are also valuable for generating accurate digital elevation mod-
els (DEM)[70], which are later used to detect and monitor ground and structural defor-
mations [37].
3.4.2. Unmanned aerial vehicles (UAVs) and small Unmanned aerial vehicles (sUAV)
After earthquakes, overflights with aeroplanes and helicopter are initially done to
identify the extent of the affected area. However, in recent years a new source of post-
disaster aerial data has matured with unmanned aerial vehicles (UAVs) [10, 22]. This
method can be effectively used to acquire images of a target region quickly. It is even more
effective when the UAV images are sent immediately for processing to an operational
ground control station. The spectral information is a crucial aspect of the change detection
problem, depending on the sensor loaded on the UAV platform and less on the reference
image. UAVs captures multi-perspective high-resolution imagery, are easy to transport,
deploy and fly, accesses easily destroyed areas and are cost-effective than traditionalPreprints (www.preprints.org) | NOT PEER-REVIEWED | Posted: 29 June 2021 doi:10.20944/preprints202106.0714.v1
airborne approaches [38, 39]. The GEER mission for the Central Italy case study selected
based on their portability, rapidity in data collection and superior field of view, UAVs to
take images for assessing potential landslides, being one of the principal data collection
tools [32].
The GEER team utilised three UAV platforms. Two commercial off-the-shelf (COTS)
UAV platforms and one customized/modified for aerial photography: DJI Phantom 4,
Sensefly eBee, and Align TRex 800e, respectively [32]. The first UAV platform was em-
ployed to collect high-resolution imagery from a sloped or vertical surface, where vertical
control was required. The second UAV platform was utilized to capture nadir images of
places over large areas, given their superior speed and flight endurance. The third plat-
form was employed in only one location, considering constant heavy winds in that spe-
cific place. Although LiDAR is significantly slower than UAV-based inspections, it was
still faster than manual inspection of large areas and its accuracy higher than UAV-based
remote sensing [32]. The onboard camera of the UAV is the governing factor that deter-
mines the quality of the data collected. Speed and altitude can be adjusted mid-flight,
while minimal adjustment can be made for improving camera performance. Digital sin-
gle-lens reflex (DSLR) or DSLR-equivalent cameras are chosen over point-and-shoot cam-
eras, but they require larger UAV platforms to carry them[32].
Automated small unmanned aerial vehicles (sUAV) acquired images of damages in
the mountain village of Pescara del Tronto after the earthquake in 2016 and later images
of the progress of the reconstruction efforts in 2018 [64]. The imagery data was used for
3D reconstruction using SfM. The sequential 3D reconstructed models enable building
identification, movement detection, and volumetric measurements and document the
building identification, movement detection, volumetric measurements, and document
recovery progress [64]. The 3D models were developed using BentleyTM ContextCapture.
This software establishes the 3D point locations in a scene using camera metadata and
GPS. The photos contain the data utilized to calculate inter-spatial intersections[64]. A
view-planning algorithm delineated optimized angles and photo locations through
'greedy heuristics’ to capture better orthogonal views of Pescara del Tronto and solve the
drawbacks of the nadir grid approach. This view-planning algorithm identifies the best
sensor location for observing a site or an object by planning oblique images for optimized
SfM [64]. These computational tools together produce photogrammetric outcomes that
look down vertically and at several oblique angles. In 2018, two new algorithms were
applied to capture the images during the return mission: optimized view and flight path,
which increased the completeness of the 3D models by providing oblique angles. The im-
ages captured in this return mission generate textured mesh models and dense point
clouds to collect data about the progress of the city's reconstruction, its geotechnical back-
ground and the surrounding countryside [64]. The advantages of utilising sUAV in earth-
quake reconnaissance are that it makes it unnecessary for the missions to enter damaged
areas, reduces the inspection time for data collection [47], and collects data in both the
physical and the social and economic dimension.
One of the constraints to obtain data through this source is the increasing regulation
for the operation of UAVs and the rapidity that these regulations are evolving. Neverthe-
less, UAV’s useful role for impact estimation after natural phenomena is now acknowl-
edged by most regulatory agencies, favouring the acquisition of the flight permit [32].
3.4.3. Light Detection and Ranging (LiDAR)
The LiDAR approach has been used to estimate the damage after hurricanes [10] and
earthquakes[71]. One approach consists of laser-generated point cloud data that contains
3-dimensional (3D) coordinate information and reflection intensity of a building, whichPreprints (www.preprints.org) | NOT PEER-REVIEWED | Posted: 29 June 2021 doi:10.20944/preprints202106.0714.v1
integrated into an algorithm are used for the structural assessment using photogrammet-
ric techniques [71]. Another approach consists of a density-based algorithm extract build-
ing clusters. Then, a cluster matching algorithm is developed to match post-event and pre-
event building clusters using multi-temporal datasets. Roof features involving changes in
the area, volume, orientation and shape are identified as indicators of building damage
[72]. High-rise or median-rise buildings are relatively easy to detect in airborne point
cloud data as they have large footprints as compared to residential homes [72].
Detailed structural surveys can be done using terrestrial light detection, and Ranging
(LiDAR) and the GEER team used it at landslide locations during the reconnaissance mis-
sion in central Italy [32]. Light Detection and Ranging can cover large areas and be highly
accurate, but shadows cast by changes in hillsides and slopes can block critical areas of
view. In this case, additional surveys from alternative directions are necessary or fusing
with a UAV-bases SfM point cloud model [32].
3.4.4. High-resolution synthetic aperture radar (SAR)
Synthetic aperture radar (SAR) is an essential mean for obtaining disaster infor-
mation given its strong penetrability, speediness, comprehensive coverage and all-
time/all-weather imaging capabilities. It is often used to detect not only building damage
but also to monitor ground and structural deformations [50]. In 2010, after the earthquake
in Haiti, heavily damaged urban areas were assessed using SAR intensity images (Ter-
raSAR-X and COSMO-SkyMed) and building footprints [12]. The backscattering coeffi-
cient between pre- and post-earthquake images changes more in collapsed buildings than
in less damaged ones because there is a stronger reflection from the rubble. A linear dis-
criminant function based on the difference and correlation coefficient between the images
was developed to detect collapsed buildings. This discriminal analysis has managed to
detect almost 75% of the buildings correctly [12].
Post-event dual polarimetric SAR images for earthquake damage assessment are
used for the 2015 Nepal earthquake. The radar scattering characteristics of undamaged
and damaged urban areas are compared using polarimetric features derived from PAL-
SAR-2 and Sentinel 1 images [40]. Supervised classification, feature selection and split-
based image analysis were utilized on a PALSAR-2 image [40]. Higher correlations were
found between the damaged and texture features derived from the intensity cross-polari-
zation [40]. Employing 30% data for testing and 70% of the data for training, the support
vector machine (SVM) classifier reached an accuracy of 80.5% compared with the reference
data generated from the damage map produced by the United Nations Operational Satel-
liteApplications Programme (UNOSAT)[40]. This method has the advantage that only a
post-event SAR dataset is needed [40]. Earthquake damage Visualization (EDV) use SAR
data for rapid detection of earthquake damage. The normalized difference between pre-
seismic and co-seismic coherences, and vice versa, are employed to calculate the forward
(from pre-seismic to co-seismic) and backward (from co-seismic to pre-seismic) change pa-
rameters, correspondingly [1]. The average values of the pre-seismic and co-seismic coher-
ence maps are the third change-free parameter. These three parameters were eventually
merged into the EDV as a red, green and blue (RGB) composite imagery [1]. The earth-
quake damage is visualized efficiently through the EDV employing Horizontal transmit
and Horizontal receive (HH), and Horizontal transmit and Vertical receive (HV) polariza-
tions data from the Advanced Land Observing Satellite-2 (ALOS-2) [1]. The performance
of the EDV was tested in the Kathmandu Valley, struck by the 2015 Nepal earthquake [73].
The cross-validation results indicated that the EDV is more sensitive to building damage
than other methods and its utilization in other earthquakes is feasible [1]. In the last years,
SAR based techniques have been also applied to recognize deformation phenomena such
as earthquake-related surface deformation and ruptures, massive landslides and subsid-
ence [70]. High-resolution synthetic aperture radar data from Sentinel-1 and near-fieldPreprints (www.preprints.org) | NOT PEER-REVIEWED | Posted: 29 June 2021 doi:10.20944/preprints202106.0714.v1
GPS data from four stations, i.e. CHLM, KKN4, NAST, and NDL Nepal Geodetic Network,
was utilised to investigate the coseismic and postseismic surface displacement associated
with the Gorkha earthquake[42]. The first Sentinel-1 data acquisition after the Gorkha
earthquake was made on the 29th April 2015, and it was taken as a reference date. Three
deformation maps were generated for the reference date on the 11th May, 4th June and 22nd
July 2015 [42]. An upliftment of about 1 m near Khatmandu and subsidence of about 0.8 m
toward the north along the LOS of the correspondent satellite was revealed by the defor-
mation map generated from the coseismic interferogram [42].
3.4.5. Interferometric Synthetic-Aperture Radar (InSAR)
The European Space Agency (ESA) launched Sentinel-1A in 2014, the first half of a
two-satellite constellation providing the most extensive and systematic coverage of SAR
data to that date [74] and the first mission to deliver data on a near-real-time, open-access
basis[41]. From that moment on, Sentinel-1A data have been utilised to make observations
that are centimetres-to-centimetres in magnitude, associated with earthquakes such as the
Mw 7.8 Gorkha, Nepal [41, 43, 44] and other geohazards. Comparing InSAR coherence
maps from and after an extreme event can produce damage proxy maps (DPM) [32, 75].
Radar and optical images were combined to measure ground displacements and deter-
mine the kinematics and geometry of thrust faulting for the Himalayas. Interferometric
Synthetic-Aperture Radar data from ESA was processed to derive surface offsets and sur-
face line-of-sight ground motion from the correlation of amplitude images from Landsat-
8 and SAR [76]. These observations were complemented with other published surface dis-
placements from ALOS-2 SAR satellite and global positioning system (GPS) coseismic off-
sets. Up to 2 metres of south-southwest motion and almost 1 metre of uplift in Kathmandu
basin and the surrounding Lesser Himalaya were observed, whereas north of this, a large
region of the higher Himalaya subsided by about 0.6 metres [76]. Surface slip associated
with the Main Frontal Thrust (MFT) was not shown by geodetic satellite measurements
(InSAR, SAR azimuth correlation and optical image correlation), which had significant
implications for interpreting seismological records. Nevertheless, a triggered near-surface
slip was found with the Sentinel-1 coseismic interferograms along 26-Km-long disconti-
nuity, 10 km north of the MFT. Broadly consistent surface offsets, peaking 60 millimetres
of surface motion towards the radar, were showed by independent interferograms on two
overlapping descending tracks with acquisition made 4 and 11 days after the main
shock[76].
Interferometric Synthetic-Aperture Radar and GPS were utilised to study coseismic
and early postseismic deformation associated with the Gorkha earthquake by mapping
done by different groups [42]. The analysis of data collected found coseismic and early
postseismic (4-88 days) surface displacement. The same data was jointly geodetic inverted
for coseismic and postseismic slip on the Main Himalaya Thrust (MHT), providing a de-
tailed slip distribution pattern on the causative fault. First, the coseismic and early post-
seismic InSAR and GPS data were inverted using a more realistic fault model with four-
segment fault planes having variable dip angles representing the MHT geometry. Second,
the spatiotemporal evolution of the early postseismic deformation of the Gorkah earth-
quake was mapped using InSAR and GPS data[42]. After correcting for orbital ramps and
atmospheric phase delay, LOS were generated using 11 interferograms. The postseismic
GPS displacement supports the InSAR observations and the inverted coseismic defor-
mation closely matches the observed InSAR and GPS deformations. The InSAR data pair
(29/04/2015-11/05/2015), along with the GPS-derived velocity for a window time of 13
days, was chosen for afterslip inversion as it represents early postseismic movements (4-
16 days after the Gorkha earthquake), without being influenced by the MW 7.3 main after-
shock occurred on the same fault on the 12th May 2015 . The afterlift inversion was under-
taken using the same fault parameterization as the coseismic slip inversion [42].Preprints (www.preprints.org) | NOT PEER-REVIEWED | Posted: 29 June 2021 doi:10.20944/preprints202106.0714.v1
3.4.6. Real Aperture Radar (RAR)
The RAR technology can be used for rapid building condition screening to provide
in almost real-time, trustworthy information about its condition and performance. The
basic principle is to record the dynamic properties of a structure under ambient vibration
[77]. Monitoring kinematic variables makes it possible to extract complete modal infor-
mation of the vibrational behaviour and then infer its operational conditions. [8].
The radar device can detect and range objects by acquiring echoes from different tar-
gets contained in its antenna field of view (FOV). The amplitude peaks correspond to re-
sponses from sections of the observed structure located at different distances. The operat-
ing distance and the characteristics of the backscattering surface strongly affect the radar
response. A radar observation utilises the time elapsed between the transmission and re-
ception of an electromagnetic waveform to provide a signal named range profile. This sig-
nal comprises peaks of different amplitudes and identifies the observed structure's main
reflecting parts [8]. The measurement involves three steps. First, the amplitude profile as
a function of the range is collected. Second, when the radar echo intensity assures an ade-
quate signal-to-noise ratio (SNR), the corresponding part of the structure can be associated
with the echo's interferometric phase; third, the displacement time record is extracted from
the time variations of the phase[8].
Real aperture radar and numerical modelling were used to record the displacement
response of a selected building severely damaged due to the MW5.1 2011 Lorca earthquake
(Spain). The IBIS-S, a radar device with interferometric capability, a sensor module, a con-
trol PC, a power supply and data procession software were employed to monitor the dis-
placement time history of the vibration of the surveyed building [8]. The objective of this
test was to determine the feasibility of the RAR-based method to identify the safe state of
a damaged building after an earthquake, avoiding accessing unsafe structures [8]. The re-
sult shows a good consistency between the experimental and numerical approaches and
the observed damage, demonstrating that RAR is a supplementary RS method to safely
report operative conditions and structural health of a building after an earthquake [8].
3.5. Crowdsourcing platforms
Eyewitness reports have always been part of seismology, and large volumes of eye-
witnesses observations can boost rapid situational awareness [47]. Online tools offer the
possibility that ‘citizen engineers’ and volunteers to analyse large amounts of data to
quickly provide a qualitative assessment of damage degree and different types of build-
ings post-earthquake [35]. We identified in our literature review seven crowdsourcing
platforms used for earthquake reconnaissance: Did You Feel It (DYFI), Earthquake net-
work, LastQuake, MyShake, Raspberry Shake, QuickDeform and The Taiwan Scientific
Earthquake Reporting (TSER) System. The crowdsourcing platforms identified are listed
below in alphabetical order.
3.5.1. ‘Did You Feel It’ (DYFI)
The United States Geological Survey (USGS) developed the ‘Did You Feel It’ (DYFI) in
1999. ‘Did You Feel It’ is an online system to collect macroseismic intensity (MI) data,
shaking and damage reports from earthquakes eyewitnesses to process them automati-
cally [47] for generating intensity maps right after an earthquake [45]. This system spread
questionnaires distributed after earthquakes to collect information about their impacts
[51]. In case of earthquakes outside the United States, DYFI data rapidly confirm its oc-
currence for seismic analysis and scientist at the USGS National Earthquake InformationPreprints (www.preprints.org) | NOT PEER-REVIEWED | Posted: 29 June 2021 doi:10.20944/preprints202106.0714.v1
Centre (NEIC), giving a quick indication of the impact of shaking effects. Intensity data
collected through DYFI are utilized to provide shaking constraints for the USGS Global
ShakeMap system. This shaking constraints input for the USGS Prompt Assessment of
Global Earthquakes for Response system allows the USGS to alert agencies and users
worldwide of significant earthquakes and their likely impact [45].
The DYFI software package is totally open source. Incoming entries from multiple web
servers are processed and aggregated over postal ZIP codes (in the US), and 1-km and 10
km aggregated boxes for each earthquake to make interactive maps and plots served via
the USGS Earthquake Program web pages [45]. ‘Did You Feel It’ is a program for commu-
nity internet intensity maps (CIIM) developed based on the questionnaires filled in that
assigns average intensity level to each ZIP code [55]. Aggregation allows to combine the
observations from different users and complete the gaps in relevant intensity markers.
Two relevant questionnaire indices are combined with other users within their commu-
nity to produce an intensity calculation [45]. Did You Feel It contributors usually select
the most recent earthquake when contributing or searching for information [45, 47]. Some
of them still contribute for months after an earthquake; therefore, DYFI maps result from
aggregated MI models that change over time. The DYFI questionnaire includes questions
about user’s situation, experiences, and behaviours, going beyond the calculation of MI.
This data makes the DYFI database, the repository of millions of comments relevant for
social sciences [45]. Essentially, DYFI depends on entries from the general public, being
citizen-based science. Shakemap and DYFI have significantly facilitated the use of MI in
the US, training citizens to think in terms of varying intensities produced by an earth-
quake [45].
3.5.2. ‘Earthquake network’
Earthquake Network is a citizen science research project implementing an earth-
quake early warning system (EEW) based on smartphone crowdsourcing [52]. People in-
stall a smartphone application, and they receive real-time alerts when the smartphone
network detects earthquakes [46]. Frequently, users install the app after strong earth-
quakes in their location; therefore, the network of smartphones soars to the point that it
manages to detect aftershocks and future earthquakes. In the same way, users uninstall
the app in periods of ‘seismic calm’ diminishing detections in the area [46]. The Earth-
quake Network app is, at the same time, the instrument to receive the EEW and to detect
an earthquake. When the smartphone is unused and charging, the app monitors the ac-
celerometer for detecting vibrations likely due to an earthquake. If a seismic movement is
detected, a signal is sent to a server that collects signals from all the smartphones [46, 52].
Following the algorithm, the server decides in real-time if an earthquake is happening. If
confirmed, the server infrastructure sends an EEW to the users located in the affected area.
Those close to the epicentre receive the EEW first, possibly even before feeling the earth-
quake. Hence, the Earthquake network makes an early warning service available to users
interested in making their smartphones available for detection when their smartphone is
not in use[46].
For real-time detection of earthquakes, the Earthquake network sends signals to a
server located in Europe. The infrastructure is currently based on nine servers that receive
a large number of signals from the network and the numerous users opening the app
when they experience the earthquake. Whatever signal received by the server infrastruc-
ture activates a statistical algorithm that determines if an earthquake is happening. Then
the analysis is done at a global scale and in real-time [46]. Users can report the impact of
an earthquake pushing a button in the app interface, reporting the earthquake's impact
considering only three levels: mild, strong, and very strong, to make it fast. SpatialPreprints (www.preprints.org) | NOT PEER-REVIEWED | Posted: 29 June 2021 doi:10.20944/preprints202106.0714.v1
coordinates of the smartphones are automatically sent with the felt report. If several re-
ports are received from a specific area simultaneously, a notification is sent to the
smartphone users through the Firebase Cloud Messaging (FCM) platform. Usually, users
receive first the EEW activated by smartphones, and within one minute, they receive the
notification activated by users. The user is redirected to a map showing all felt reports by
clicking on the notifications. As an example, reports were collected in Puerto Rico within
60 seconds after the 3.6 Magnitude earthquake; thus, users were aware of the low impact
of the earthquake before any official information was released[46]. Earthquake Network
app has a second strategy to send smartphone coordinates by SMS or email to a list of
trusted contacts when an EEW is received. The aim is that SMS/e-mail will be sent before
lifelines (phone network/Internet) are affected and the EEW received before the shaking
starts. However, the smartphone must be on at the time of the earthquake. After receiving
the SMS/e-mail, users can report their status by pressing a button in the app's user inter-
face indicating: ‘I am fine’ or ‘I need help’[46].
3.5.3. ‘LastQuake’
The European Mediterranean Seismological Centre (EMSC) developed a multichannel
rapid information system consisting of websites, a Twitter quakebot called LastQuake,
and an eponym smartphone app [45-47, 52] at the interface between global users looking
for information the EMSC. This multichannel has two objectives: To offer practical infor-
mation in regions where an earthquake is felt and collect reports from users containing
direct and indirect observation related to the intensity and damages caused by the earth-
quake [17]. LastQuake app also monitors people activity soon after the earthquake [46].
The rapid provision of tremor detection triggers the LastQuakep app and EMSC website
user’s engagement, who act as real-time seismic sensors. An earthquake can generate sev-
eral automatic tweets published by the quakebot and updates on the website. These tweets
and updates describe earthquake parameters, epicentral plot, maps, felt reports, historical
seismicity, tsunami information and links to the user's comments [17].
There are two kinds of data collected from users: crowdsourced data (felt reports, ge-
otagged pictures, videos and open comments) and crowdsourced detections (users reac-
tions and experience on the ground)[17, 47]. Then it is only necessary to identify the geo-
graphic origin of the website visitors through their IP (Internet Protocol) to determine
where the earthquake was felt without the need for any seismological data [17]. There are
two other complementary crowdsourced earthquake detection methods in operation:
Twitter Earquake Detection (TED). This approach identifies a surge in the number of
tweets, including the keyword ‘earthquake’ in various languages and the traffic analysis
generated by LasQuake app launches, which works like the website traffic analysis. If
many people located in the same area open the app simultaneously, there is a high prob-
ability that an earthquake has happened, and hence an alert is sent [46]. A push notifica-
tion is submitted to LastQuake app users once the crowdsourced detection has been con-
firmed. Felt reports are collected through a multilingual online macroseismic question-
naire available on the EMS website or using the 12 cartoons depicting different shaking
and damage levels [51]. Each cartoon was representing an intensity level of the European
Macroseismic Scale 1988 [47]. These cartoons have made more efficient the collection of
reports at a global scale [17]. Plotting the location of the LastQuake app launches is possi-
ble to map the felt area automatically.
3.5.4. MyShake project
The ‘Myshake’ project aims to build a global smartphone seismic network to develop a
large-scale earthquake early warning (EEW) and other application to boost the power of
crowdsourcing [46, 48]. This project implemented by UC Berkeley Seismological Labora-
tory [46] is based on MyShake mobile application, which first detects earthquake shakingPreprints (www.preprints.org) | NOT PEER-REVIEWED | Posted: 29 June 2021 doi:10.20944/preprints202106.0714.v1
on a single phone. Then this detection is confirmed on the MyShake servers using a ‘net-
work detection’ algorithm activated by multiple single-phone detections[48]. This app is
utilised to continuously monitor the smartphone accelerometer to measure earthquakes
and send alerts [46]. It is assumed that 0.1% of the population in each region has the My-
Shake mobile application installed on their smartphone. The system works better (alerts
generated between 4 and 6 seconds, errors are similar to 0:5 magnitude units, and epicen-
tres are typically within 10 km of true locations) in high-density populations and onshore
regions with an upper crustal earthquake with a magnitude higher than M7:0. In the op-
posite case, low density and offshore areas, alerts are slower, and the uncertainty in mag-
nitude and location soar, but the system still works for earthquakes with a magnitude
higher than M 5.5 [48].
3.5.5. Raspberry Shake
Raspberry Shake is a crowdsourcing operation based on relatively affordable seismic
sensors that can be easily installed in houses or schools, used in several citizen seismology
projects [52]. After the 2015 magnitude 7.8 Ghorka earthquake in Nepal, it was found that
the population was not aware of their country's high seismic hazard. Therefore, they had
an insufficient level of preparedness. One of the reasons for this problem is that earth-
quake-related topics are not part of the school curriculum. Hence, an initiative to intro-
duce seismology in schools, focusing on education and citizen seismology, was imple-
mented in Nepal [49]. Considering its performance in a laboratory test, suitability for the
field conditions, the seismic sensor installed in schools was a Raspberry Shake 1D (RS1D).
Additional criteria to select this sensor were low cost (below 500 USD), easily applicable
for educational purposes, high sensitivity to detect local earthquakes, ease to handle and
the possibility of recording data without an additional computer. These seismometers in-
stalled in 22 schools develop the Nepal School Seismology Network delivering online data
openly [49]. This program started in Western Nepal, because people there have limited
opportunity to learn about earthquakes. There has been no significant earthquake for 500
years in this region [49], and it has an acceptable travel time between different sites where
the seismometer was installed. Facebook and Twitter were used in Nepal to spread infor-
mation about the Nepal School Seismology Network and ask interested schools to fill in
the request form[49]. The criteria to select the 22 schools among 100 that submitted the
request form were: number of students, motivation, feasibility to instal the seismometer
on the ground floor, 200 m as minimum distance to road or highway to avoid anthropo-
genic noise, own internet connection, alternate power supply and reachability of the
school by vehicle or a short walk [49]. Each seismometer installed in a school inform stu-
dents about earthquakes, waveforms, distance and magnitude of the event. Thus the net-
work is used for both sharing locally recorded data openly and teaching[49].
3.5.7. QuickDeform
Near real-time ground deformation maps generated after earthquakes are essential
for hazard assessment and usually take a couple of hours or longer to be generated by
conventional means [50]. A near-real-time coseismic ground deformation map generation
system to assist emergency response is developed. This system adopts source parameters
published by the United States Geological Survey National Earthquake Information Cen-
tre (USGS-NEIC) and empirical equations to generate the real-time (within seconds) co-
seismic ground deformation maps [50]. The ground deformation is integrated as self-
adapting spatial data fusion and visualised on an interactive WebGIS platform, named:
QuickDeform. This GIS user-oriented platform provides real-time evaluation and emer-
gency response information by viewing, searching, and customizing the seismic defor-
mation.
3.5.6. The Taiwan Scientific Earthquake Reporting (TSER) SystemYou can also read